Sprayer for Quantitative Application of Odor Stimuli
ASHRAF EL-SAYED,1, 2JOSEF GO¨DDE,3ANDHEINRICH ARN2
Environ. Entomol. 28(6): 947Ð953 (1999)
ABSTRACT A novel device is described for the quantitative application of chemical stimuli. The device uses ultrasound to disperse a solution of volatile chemicals as an aerosol. A motor-driven syringe controls the rate at which the solution is released from a glass capillary. Vibration of the capillary disperses the released solution into microdroplets that evaporate completely within a few centimeters of the tip. The ratio of chemical stimulus to solvent is maintained until the liquid is dispersed and therefore the release rate of the chemical stimulus can be set and calculated straight-forwardly from the dilution factor and the dynamically controllable speed of the syringe plunger. The sprayer permits the delivery of chemical stimulus independent of relative vapor pressures of the components and of environmental factors such as temperature. The sprayer is easy to operate, can be constructed from inexpensive materials, and can be used to emit odor stimuli in the wind tunnel or any other bioassay for pheromones and plant volatiles.
KEY WORDS pheromones, plant volatiles, odor quantiÞcation, ultrasound, release rate, olfactory stimulation
IN STUDIES OFolfaction, the quantitative application of volatile stimuli has been a long-standing problem. Quantitative odor stimulation requires that a gas, mostly air, contains a known concentration of a chem-ical stimulus. The high sensitivity of many olfactory organs necessitates the use of very low concentrations of the stimulus. In studies with insects, the stimulus is often administered using a substrate such as a Þlter paper, a rubber stopper, or polyethylene caps. The amount of test substance released per unit of time and carried with an air stream to the test animal depends on parameters such as vapor pressure, the afÞnity of test chemicals for substrate, and temperature. De-pending on the substrate used in the behavior bioas-say, doseÐresponse curves for the same pheromone blend can differ by ⬎2 log units (Linn et al. 1984, Sanders 1990). The sensitivity of insects to stimuli using these techniques can at the best be expressed on relative scales, unless the stimuli are quantiÞed using techniques such as radioactive labeling (Kaissling 1985) or they are collected on adsorbents followed by analysis (Cross 1980). Better control over the stimulus concentration is obtained with another approach, in which the test substance is allowed to equilibrate between a reservoir of a solvent-odorant mixture and a closed gas space (Fa¨rbert et al. 1997). Using this method, gas concentrations are still dependent on factors such as temperature and the diluting solvent,
which are difÞcult to control for components of dif-ferent vapor pressures or polarities.
Recently, pressurized canisters were used for dis-persing pheromone in the Þeld as aerosols for disrup-tion of sex pheromone communicadisrup-tion. The machines contain timer-activated mechanisms for releasing puffs of pheromone components. This allows the re-lease pheromones only during the ßight period and avoids unnecessary emission during the day where the insects are inactive. The pheromone chemicals in these canisters are protected from oxidative degrada-tion until after it is released into the air (Shorey and Gerber 1996, Shorey et al. 1996).
In this article we describe a device capable of re-leasing predetermined amounts of semiochemicals in constant proportions, chemical and isomeric purity. The sprayer makes it possible to emit pheromone blends at precise and biologically meaningful rates (picograms or femtograms per minute). The sprayer was developed to characterize the pheromone blend of the grapevine moth, Lobesia botrana Denis & Schif-fermu¨ller, (El-Sayed 1996, 1998a, 1999a) and it has been successfully used with other species, e.g., codling moth, Cydia pomonella L. (El-Sayed et al. 1998b, 1999b), the pea midge, Contarinia pisi Winnertz (Y. Hillbur and E.-S., unpublished data) and the North American grape berry moth, Endopiza viteana Clem-ens, (R. M. Trimble, personal communication). In addition to pheromone studies, the sprayer can also be used in studies of plant volatiles. We review the con-struction, accuracy of chemical stimuli emitted from the sprayer, and bioassays to investigate the effect of ultrasound and solvent emitted during evaporation on male behavior.
1Department of Zoology, University of Zu¨rich CH-8057 Zu¨rich,
Switzerland. Current address: Southern Crop Protection & Food Research Centre Agriculture & Agri-Food Canada, Vineland Station, ON, Canada L0R 2E0.
2To whom all correspondence should be addressed: Swiss Federal
Research Station (FAW), CH-8820 Wa¨denswil, Switzerland.
3Steinklepper Weg 1, D-35753 Greifenstein, Germany.
Materials and Methods
Operating Principles. The sprayer relies on 2 basic
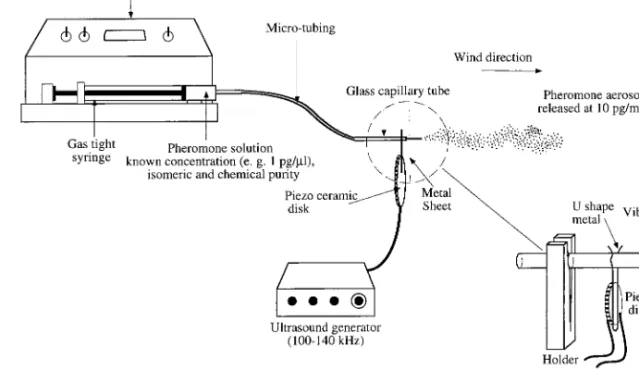
ideas: Þrst, the odorant is diluted in a solvent that has been shown to have no behavioral effect on the spe-cies of interest. Second, this odorant solution is re-leased into the air at a known rate. The odorant so-lution is released using a motor-driven syringe that pushes the odorant solution to the tip of a glass cap-illary with an opening of 10Ð50m i.d. at a rate of ⬇10 l/min (Fig. 1). The capillary tip is excited to oscillate at ⬇120 kHz, or a harmonic of this frequency. At ⬇25 m amplitude peak-to-peak, an oscillation of 120 kHz creates a peak tip velocity of 9.42 ms⫺1, and a peak tip
acceleration of 7.1 ⫻ 106ms⫺2. This releases 1 or 2
microdroplets of odorant solution at each oscillation and results in an aerosol of the solution that dis-perses and evaporates completely within ⬍5 cm from the capillary tip when placed in a wind tunnel under the bioassay conditions (Fig. 2). The release rate of the test chemicals can be controlled by 2 independent parameters: (1) the concentration of the odorant solution, and (2) the ßow rate gener-ated by the syringe pump. Both of these parameters can be quantitatively adjusted and therefore the amount of odorant released per unit of time can be precisely calculated.
Fig. 1. Sprayer set-up used in the wind tunnel experiments.
Fig. 2. Photograph of the active sprayer in the wind tunnel and a male codling moth, C. pomonella released from ⬇2 m approaching the tip of the capillary tube.
Construction. The method of exciting the tip of a
glass capillary tip to vibrate at ultrasonic frequencies was developed by Go¨dde (1986). A piezo disk of 10Ð25 mm o.d. and ⬇1Ð2 mm thickness with solderable silver coatings on both faces (Cat. Nr. 4322 020, Valvo, Ham-burg, Germany) is driven at its bending mode reso-nance by a sine or square wave of ⬇20 V peak to peak. The driving signals were taken from standard function generators (FG-8002 GoldStar Precision, Seoul, Ko-rea). A U-shaped wire 1 mm diameter is soldered to one face of the piezo disk so that the open stems reach ⬇10 mm over the rim of the disk (Fig. 1, inset). This wire serves 2 purposes: it holds the piezo disk in place by spring force and transfers the oscillations to the glass capillary tube. The tip of the capillary is an acoustical transformer, and therefore the amplitude of oscillation increases toward the end, where it may reach 100m. Glass capillaries of 1 mm o.d. and 0.4 mm i.d. (Narishige, London) were drawn out using an electrode puller (Narishige) and broken to tip diam-eters of ⬇55m o.d./40 m i.d. (determined by scan-ning electron microscopy). The geometry of the cap-illary tip may vary considerably between individual capillaries without impairing their function. If oscil-lation frequencies at higher harmonics of the funda-mental bending resonance frequency (usually in the range of 120 kHz) are intended (see Results and
Dis-cussion), the capillaries should have long, slender tips with ⬎4 mm tip range of ⬍100m i.d. Using such capillaries, vaporization was achieved at frequencies of up to 1 MHz. The frequency being adjusted visually to the resonance of the individual capillary. A micro-injection pump (CMA/100, Carnegie Medicine AB, Stockholm, Sweden) was used to deliver the odorant solution via micro tubing, 1 m long and 0.12 mm i.d. (CMA/Microdialysis, Carnegie Medicine AB, Stock-holm, Sweden) to the capillary tube (Fig. 1). A tubing adapter (CMA/Microdialysis, Carnegie Medicine) was used to connect the micro tubing to the syringe outlet and to the capillary tube inlet.
The ßow rate (dV/dt) of the odorant solution is determined by the speed of the syringe piston. Ac-cording to the law of Poiseuille (Adam et al. 1977), a given ßow rate of odorant solution builds up an odor-ant solution-head pressure (⌬P), which is propor-tional to the odorant solution ßow rate: dV/dt ⫽ ⌬P ⫻
C.For cylindrical tubes of luminal radius R and length
L, ⌬P depends on the viscosity of the ßuid according to C ⫽ ⬃R4/(8L). The narrowest part in the tubing
determines C. This is in most cases the capillary tip. Hence, ⌬P depends on the viscosity of the odorant solution and even more so on the geometry of the capillary tip. The viscosity of the odorant solution is almost identical with the viscosity of the solvent if the odorant is highly diluted.
Wind Tunnel Experiments. The 1st test of the
sprayer for releasing pheromones was carried out in the wind tunnel of Witzgall and Arn (1991). The capillary tube and piezo ceramic disk were installed at the upwind end of the tunnel behind a perforated metal sheet with 3 mm holes. The tip was oriented at the center aperture of the metal sheet and projected
⬇1.5 cm into the wind tunnel (Fig. 1). It was protected from approaching males using a glass cylinder (10 by 10 cm) with mesh at it is distal end. The pump and function generator were kept outside the tunnel. The light intensity was 30 lux at the center of the tunnel, wind speed was 30 cm/s and air temperature was 22 ⫾ 2⬚C. Twenty-Þve 2- to 3-d-old L. botrana males were immobilized at 4⬚C and transferred individually to glass release tubes (15 by 2.5 cm). Bioassays com-menced at the beginning of the scotophase and con-tinued for 4 h. Males were released individually in the wind tunnel and the following behavioral responses were recorded: activation ⫽ wing fanning, random walking in the release tube; upwind ßight ⫽ beginning of upwind ßight for at least 10Ð15 cm; landing ⫽ touchdown at the source. Differences in the number of males completing successive stages in their advance toward the source were compared using chi-square analysis (2 ⫻ 2) with Yates correction (GraphPad 1993).
Recording Flight Behavior. The ßight behavior of
male L. botrana to females without and with different ultrasound frequencies was recorded using 2 couple charge device (CCD) cameras (aqua tv HR 480, Henz Memo AG, Suhr, Switzerland) (El-Sayed et al. 1999c). The 2 cameras were placed on the side of the wind tunnel, ⬇120 cm from the tunnel and 105 cm from the ßoor. Their axis formed an angle of ⬇90⬚. The sectors covered by the 2 cameras overlapped over a space that had a maximum length of 50 cm along the tunnel axis. The lateral side of the wind tunnel opposite to the 2 cameras was illuminated using a light box. Analysis of ßight tracks was done off-line. A Macintosh program (TrackEvaluat8) was used to view and analyze the following ßight parameters: straightness ⫽ length of the net path traveled/the total distance traveled; lin-ear velocity ⫽ total distance traveled on longitudinal axis/elapse time; track angle ⫽ the deviation of the observed ßight path from the wind line. Grand mean was calculated for each of the 3 parameters to each of the pheromone source tested. The means were com-pared using one-way analysis of variance (ANOVA) (Abacus Concepts 1995).
Chemicals. The synthetic pheromones tested were
obtained from the laboratory of H.A. The chemical purity of the compounds was 93Ð99.9%. The odorant solutions were made by mixing the appropriate quan-tities of synthetic compounds in high-performance liquid chromatography (HPLC) grade ethanol. A given odorant solution was typically used for ⬇100 min and expelled at 10l/min.
Effect of Ultrasound and Solvent. The possible
ef-fects of ultrasound emission and of the solvent ethanol on the response of male L. botrana were tested. The response of males to calling females was compared with and without the presence of ultrasound and sol-vent. The sprayer and the female cage were separated by 2 cm. The sprayer was operated at 3 frequencies without solvent; ethanol was evaporated at 100 kHz and a delivery rate of 10 pg/min. Calling females in the absence of ultrasound served as control.
Accuracy of Chemical Stimuli Emitted by the Sprayer. A hexane solution containing 100 ng/l of dodecyl acetate (12Ac) and 100 ng/l octadecyl acetate (18Ac) in 1:1 ratio was allowed to evaporate from the same capillary tube at a rate of 10l/min (i.e., 1g for each compound per minute). The aerosol that formed at the tip of the capillary tube was trapped for 1 min on a Pasteur pipette, which was then eluted with 10 l of hexane. This process was continued for 8 successive minutes. The eluted solution was injected immediately into Carlo Erba gas-chromatograph equipped with a 30 by 0.32 mm i.d. DB-5 column (J&W ScientiÞc, Folsom, CA). The temperature was pro-grammed from 40⬚C (1 min hold), at 25⬚C /min to 150⬚C, 5⬚C /min to 210⬚C and 25⬚C /min to 250⬚C. Helium was used as the carrier gas at a linear ßow velocity of 35 cm/s.
Measuring Pheromone Concentration. Using the
sprayer, the odorant solution is released from the cap-illary tip as an aerosol of microdroplets. If parts of these microdroplets do not evaporate while carried with the air stream moving toward the downwind end of the tunnel, the heavier microdroplets will fall down to the ßoor of the wind tunnel. This would lead to a decline in the pheromone concentration at the down-wind end of the tunnel. To measure the pheromone concentration at different distances from the capillary tip, a portable electroantennogram (EAG) recording system (see Sauer et al. 1992; Fa¨rbert et al. 1997) with antennae from 2- to 3-d-old male L. botrana was used. The pheromone plume of (E,Z)-7,9-dodecadienyl ac-etate (E7,Z9Ð12Ac) generated from the sprayer at a release rate of 1000 pg/min in the wind tunnel was investigated horizontally (20 cm) at 50 and 166 cm from the capillary tip. The EAG system was moved horizontally through the pheromone plume using an adjustable mobile stand.
Ability of the Sprayer to Release Different Concen-trations. Four-fold dilutions of the 3-component blend
(El-Sayed et al. 1999a) in the ratio 10 pg/min E7,Z9Ð 12Ac, 0.5 pg/min of (E,Z)-7,9-dodecadien-1-ol (E7,Z9Ð12OH) and 0.1 pg/min of (Z)-9-dodecenyl acetate (Z9Ð12Ac) were prepared. A 1-l sample from a given dilution contained, 0.01, 0.1, 1, 10, and 100 pg of E7,Z9Ð12Ac. Seventy-Þve males were tested for each release rate.
Ability of the Sprayer to Release Pheromone Blends with Proportions of Components. Males were ßown to
a 2-component blend containing a constant amount of the main pheromone component, E7,Z9Ð12Ac (10 pg/ min) plus varying amounts of the minor pheromone component, E7,Z9Ð12OH (i.e., 0, 0.02, 0.1, 0.5, 2, and 10 pg/min). One hundred males were tested for each blend.
Results and Discussion
Effect of Ultrasound and Solvent. The response of L. botranamales to calling females, to calling females plus 3 frequencies of ultrasound, and to calling females plus ethanol aerosol was similar (Table 1). Not only was the ultrasound without effect on the males, the identical attractiveness of females with and without ultrasound demonstrated that the ultrasound had no effect on the femaleÕs ability to attract males. Thus, neither the ultrasound produced nor the solvent eth-anol appear to have an effect on male upwind ßight or female calling. Although ultrasound did not appear to affect the behavior of male or female L. botrana, this device should be used with caution in other insect species. Insect traps emitting ultrasound are avoided by several species of lepidoptera (Treat 1962). Ultra-sound can abruptly arrest pheromone-induced behav-ior such as wing fanning and upwind ßight (Baker and Carde´ 1978). A solution to this problem could be to operate the sprayer at the highest harmonic frequency effective for dispersing the odorant solution. A range of 1 MHz would be well above the upper limit of acoustic perception of most animals. In addition to L.
botrana,the sprayer has been tested with the following species, E. viteana, C. pomonella, the grape moth,
Eu-poecilia ambiguella Hu¨bner, the pea midge, C. pisi, with no apparent affect of either ultrasound or the solvent on male behavior. We recommend the user carry out a similar experiment before using the sprayer with a new species.
Little is known about the inßuence of the solvent on insect behavior. With ethanol or hexane at the release rate of 10l/min, no effect on behavior of males or females was apparent in all tested species so far. But, there are possible indirect effects of the solvents that should be regarded when designing experiments.
Table 1. Response of L. botrana males to calling females without and with ultrasound at 3 frequencies and ultrasound plus solvent
Sourcea Frequency,
kHz Landing,% No. tracks Straightness,rel. unitb Linear velocity,cm/sc Track angle,(⬚)d
Females 0 98 45 0.62 ⫾ 0.16 22.2 ⫾ 0.83 49.5 ⫾ 11.0
Females 10 95 48 0.60 ⫾ 0.21 24.7 ⫾ 09.2 51.1 ⫾ 13.8
Females 100 97 39 0.60 ⫾ 0.20 22.8 ⫾ 09.2 50.3 ⫾ 14.2
Females 1,000 96 45 0.57 ⫾ 0.21 22.6 ⫾ 08.3 53.1 ⫾ 10.2
Females ⫹ Ethanol 100 98 45 0.60 ⫾ 0.20 22.8 ⫾ 08.3 51.5 ⫾ 12.5
Flight parameters are means ⫾ SD, no signiÞcant differences were found between values in the same column; P ⱕ 0.05, chi-square test (InStat 1993) for percent landing, and ANOVA for ßight parameters (StatView 1995). Fifty males were tested for each treatment.
aTwo calling females were used. bF ⫽ 0.541; df ⫽ 4, 217; P ⫽ 0.7054. cF ⫽ 0.603; df ⫽ 4, 217; P ⫽ 0.6609. dF ⫽ 0.317; df ⫽ 4, 217; P ⫽ 0.8711.
With highly diluted odorant, the adsorption of the odorant to the interior surfaces of syringe, tubing, and capillary could signiÞcantly diminish the original odorant-concentration in the bulk odorant solvent mixture. The ratio of adsorbed odorant versus odorant in the bulk-solution depends on the solvent. Hence a polar odorant that is soluble in a polar solvent such as water or ethanol, as well as in a much less polar solvent such as hexane, may be adsorbed to polar surfaces only when prepared in nonpolar solvent. The resulting de-viation of the real concentration of the odorant in the odorant solvent mixture from the calculated concen-tration depends on the adsorption-capacity of the de-livery system.
Accuracy of Chemical Stimuli Emitted by the Sprayer. Gas chromatography analysis of the aerosol
collected at the capillary tip indicated that the average amount released per minute was 0.96g ⫾ 0.1 for 12Ac and 0.94g ⫾ 0.1 for 18Ac (Fig. 3). These results indicate that the amount released per unit is equal to the amount of each component in the mixture, and the ratio of the 2 substances was maintained regardless of the difference in vapor pressure of the 2 compounds.
Measuring Pheromone Concentration. Mapping
the pheromone plume at 2 distances from the tip of the capillary tube indicated trivial ßuctuation in the con-centration of ⬇2 m at the upwind and downwind end of the tunnel. Furthermore, there was no difference between the pheromone concentration at 50 and 166 cm from the tip of the capillary tube (Fig. 4). Thus, there is no apparent decline in the pheromone con-centration at least 166 cm downwind from the tip of the sprayer. This conÞrms our assumption that the aerosol emitted from the tip is completely evaporated as it moves in the downwind direction.
It could be argued that an aerosol might persist in the form of invisibly small droplets moving downwind, especially with solvents or odorants of low vapor pres-sure. As far as pure solvents that evaporate as bulk ßuids at room temperature (e.g., water, hexane, eth-anol) are concerned, this can be excluded, because the margin of the aerosol around the tip of the capillary
can be seen to be caused by evaporation of the con-stituting droplets rather than by their distribution in an increasingly large air-volume. The evaporation of a solvent and a solute are selfaccelerating because the vapor pressure of droplets is proportional to ek/r(r ⫽
radius of the droplet, k ⫽ constant) (Atkins 1994).
Releasing Different Concentration. Male response
was strongly correlated with the release rate of the 3-component blend (Fig. 5). Landing at the source was affected more by release rate than was activation of males. At 0.1 pg/min of E7,Z9Ð12Ac, ⬇38% of males arrived at the source. When similar amount was loaded on a Þlter paper or rubber septa, few males were activated and none were able to maintain upwind ßight to the source (E.-S., unpublished data). Increas-ing the release rate to 1, 10 and 100 pg/min led to gradual improvement in all the behavioral sequences of male response (Fig. 5). Maximum landing at the source was obtained at 100 pg/min; further increase of Fig. 3. Amount of 12Ac and 18Ac released by the sprayer
for 8 successive minutes as determined by aerosol collection and GC analysis.
Fig. 4. The EAG measurement of the pheromone con-centration at 2 distances from the capillary tip in the wind tunnel. (A) Upwind, ⬇50 cm from the tip. (B) Downwind, ⬇166 cm from the tip. (f) Measurement from air samples collected from the pheromone plume in the wind tunnel. (䡬) Measurement from reference samples introduced over the antennae using 3 lateral syringes for calibration.
the release rate to 1,000 pg/min reduced the number of males arriving at the source but the difference was not signiÞcant.
Releasing Pheromone Blends with Proportions of Components. Increasing the proportion of E7,Z9Ð
12OH to E7,Z9Ð12Ac in the 2-component blend greatly affected the number of males arriving at the source. Maximum landing was obtained when E7,Z9Ð 12OH was released at 0.5 pg/min (Fig. 6). At higher release rates (2 and 10 pg/min) of E7,Z9Ð12OH, the number of males arrived at the source decreased sig-niÞcantly (2⫽ 5.723, df ⫽ 1, P ⬍ 0.0167 for 2 pg/min,
2⫽ 31.64, df ⫽ 1, P ⬍ 0.0001 for 10 pg/min) (Fig. 6).
Using Þlter paper as a release substrate, Witzgall et al. (1993) conducted a similar experiment. However,
they did not observe a behavioral effect of E7,Z9Ð 12OH at any of the different proportions tested. A tentative explanation for this difference, with the Þlter paper, as used by Witzgall et al. (1993), the release rate of E7,Z9Ð12OH did not reßect the initial amount loaded on the Þlter paper, because E7,Z9Ð12OH would evaporate quickly, whereas with the sprayer the amount of E7,Z9Ð12OH released and the ratio to E7,Z9Ð12Ac over the whole experimental period was constant.
In addition to characterization of the pheromone blend for L. botrana (El-Sayed 1996, 1998a, 1999a), the sprayer has been used successfully in the study of the behavioral affects of (E,E)-8,10-dodecadien-1-ol (E8,E10Ð12OH) geometrical isomers on sex attraction of C. pomonella (El-Sayed et al. 1998b), the identiÞ-cation of C. pomonella sex pheromone components (El-Sayed et al. 1999b), and is being used for the identiÞcation of the sex pheromones of the pea midge,
C. pisi(Y. Hillbur and E.-S., unpublished data) and the sex pheromones of E. viteana (R. M. Trimble, personal communication).
The main advantage of the sprayer is that the com-position of odor plumes can be set quantitatively and stably over the whole experimental period. This can be achieved using a minimal set of stock solutions, with-out the restrictions by discrete concentration steps, by purely electronic means (e.g., computer-controlled syringe pump speed) and without the need to control environmental factors. In addition, the use of the sprayer is far more economical than traditional tech-niques because the odorant is used quantitatively. This is particularly important when using natural extracts or compounds of limited supply.
Acknowledgments
We thank R. Wehner (Department of Zoology, Zu¨rich University) for his support during this project, U. Koch for providing the EAG system and measuring the pheromone concentration, R. M. Trimble for helpful comment on the manuscript, and 2 anonymous reviewers for critically review-ing the manuscript. This work was partially Þnanced by Bundesministerium fu¨r Forschung und Technologie and BASF Company, Project No. 0319459A.
References Cited
Adam, G., P. La¨uger, and G. Stark, [eds.]. 1977. Physikalische chemie und biophysik. Springer, Berlin. Atkins, P. W. [eds.]. 1994. Physical chemistry, 5th ed.
Ox-ford University Press, OxOx-ford.
Baker, T. C., and R. T. Carde´. 1978. Disruption of gypsy moth male sex pheromone behavior by high frequency sound. Environ. Entomol. 7: 45Ð52.
Cross, J. H. 1980. A vapor collection and thermal desorption method to measure semiochemical release rates from controlles release formulations. J. Chem. Ecol. 6: 781Ð787. El-Sayed, A. 1996. Analysis of behaviour and chemical stim-uli in sex attraction of Lobesia botrana (Lepidoptera: Tortricide). Ph.D. dissertation, Zu¨rich University. El-Sayed, A., P. Witzgall, and H. Arn. 1998a. Location of the
pheromone producing gland in the European grapevine Fig. 5. Response of L. botrana males to 4 release rates of
the 3-component blend: E7, Z9Ð12Ac, E7, Z9Ð12OH, and Z9Ð12Ac (100: 5: 1).
Fig. 6. Response of L. botrana males to 2-component blends with 10 pg/min of E7, Z9Ð12Ac plus varying release rate of E7, Z9Ð12OH.
moth, Lobesia botrana (Lepidoptera: Tortricidae). Appl. Entomol. Zool. 33: 507Ð511.
El-Sayed, A., R. Unelius, I. Liblikas, J. Lo¨fqvist, M. Bengtsson, and P. Witzgall. 1998b. Effect of codlemone isomers on codling moth (Lepidoptera: Tortricidae) male attraction. Environ. Entomol. 27: 1250Ð1254.
El-Sayed, A., J. Go¨dde, P. Witzgall, and H. Arn. 1999a. Char-acterization of the pheromone blend for the grapevine moth, Lobesia botrana by using ßight track recording. J. Chem. Ecol. 25, 2: 389Ð400.
El-Sayed, A., M. Bengtsson, S. Rauscher, J. Lo¨fqvist, and P. Witzgall. 1999b. Multicomponent sex pheromone in codling moth (Lepidoptera: Tortricidae). Environ. En-tomol. 28(5): 775Ð779.
El-Sayed, A., J. Go¨dde, H. Arnard. 1999c. Computer-based video system for real-time recording of insect ßights in three dimensions (in press).
Fa¨rbert, P., U. T. Koch, A. Fa¨rbert, R. T. Staten, and R. T. Carde´. 1997. Pheromone concentration measurement with EAG in cotton Þelds treated for mating disruption of
Pectinophora gossypiella(Lepidoptera: Gelechiidae). En-viron. Entomol. 26: 1105Ð1116.
Go¨dde, J. 1986. A fast voltage-controlled continuous-ßow miniature chemostat. J. Neurosci. Methods 16: 191Ð200. GraphPad 1993. Instat biostatistics, version 2.0. GraphPad,
San Diego, CA.
Kaissling, K. E. 1985. Odorants and their application, pp. 366Ð368. In A. I. Spielman and J. G. Brand [eds.], Exper-imental cell biology of taste and olfaction, current tech-niques and protocols. CRC, Boca Raton, FL.
Linn, C. E., L. W. Bjostad, J. W. Du, and W. L. Roelofs. 1984. Redundancy in a chemical signal: Behavioral responses of male Trichoplusia ni to a six-component sex pheromone blend. J. Chem. Ecol. 10: 1635Ð1658.
Sanders, C. J. 1990. Responses of male spruce budworm moths to sex pheromone released from Þlter paper and rubber septa. Can. Entomol. 122: 263Ð269.
Sauer, A. E., G. Karg, U. T. Koch, J. J. De Kramer, and R. Milli. 1992. A portable EAG system for the measurement of pheromone concentrations in the Þeld. Chem. Senses 17: 543Ð553.
Shorey, H. H., and R. G. Gerber. 1996. Use of puffers for disruption of sex pheromone communication among na-vel orangeworm moths (Lepidoptera: Pyralidae) in al-monds, pistachios and walnuts. Environ. Entomol. 25: 1154Ð1157.
Shorey, H. H., C. B. Sisk, and R. G. Gerber. 1996. Widely seperated pheromone release sites for disruption of sex pheromone communication in two species of Lepidop-tera. Environ. Entomol. 25: 446Ð451.
Abacus Concepts. 1995. StatView for Macintosh, version 4.5. Abacus Concepts, Berkeley, CA.
Treat, A. E. 1962. Comparative moth catches by an ultra-sound and a silent light trap. Ann. Entomol. Soc. Am. 55: 716Ð721.
Witzgall, P., and H. Arn. 1991. Recording ßight tracks of
Lobesia botranain the wind tunnel, pp. 187Ð193. In I. Hrdy [eds.], Insect chemical ecology. Academia Praha and SPB Academic, The Hague.
Witzgall, P. M. Bengtsson, H. A. Bayer, S. Rauscher, and H. Arn. 1993. Flugwegaufzeichnung als Hilfsmittel fu¨r die IdentiÞkation von Schmetterlingspheromonen. Mitt. Dtsch. Ges. Allg. Angew. Entomol. 8: 659Ð662.
Received for publication 9 September 1998; accepted 21 June 1999.