Publisher’s version / Version de l'éditeur:
Journal of Thermal Insulation and Building Envelopes, 16, Apr, pp. 318-339,
1993-04
READ THESE TERMS AND CONDITIONS CAREFULLY BEFORE USING THIS WEBSITE. https://nrc-publications.canada.ca/eng/copyright
Vous avez des questions? Nous pouvons vous aider. Pour communiquer directement avec un auteur, consultez la première page de la revue dans laquelle son article a été publié afin de trouver ses coordonnées. Si vous n’arrivez pas à les repérer, communiquez avec nous à PublicationsArchive-ArchivesPublications@nrc-cnrc.gc.ca.
Questions? Contact the NRC Publications Archive team at
PublicationsArchive-ArchivesPublications@nrc-cnrc.gc.ca. If you wish to email the authors directly, please see the first page of the publication for their contact information.
NRC Publications Archive
Archives des publications du CNRC
This publication could be one of several versions: author’s original, accepted manuscript or the publisher’s version. / La version de cette publication peut être l’une des suivantes : la version prépublication de l’auteur, la version acceptée du manuscrit ou la version de l’éditeur.
Access and use of this website and the material on it are subject to the Terms and Conditions set forth at
Measured thermal resistance of frame walls with defects in the
installation of mineral fibre insulation
Brown, W. C.; Bomberg, M. T.; Ullett, J. M.; Rasmussen, J.
https://publications-cnrc.canada.ca/fra/droits
L’accès à ce site Web et l’utilisation de son contenu sont assujettis aux conditions présentées dans le site LISEZ CES CONDITIONS ATTENTIVEMENT AVANT D’UTILISER CE SITE WEB.
NRC Publications Record / Notice d'Archives des publications de CNRC:
https://nrc-publications.canada.ca/eng/view/object/?id=0c48b574-b868-4329-afbe-a209f0a43c77 https://publications-cnrc.canada.ca/fra/voir/objet/?id=0c48b574-b868-4329-afbe-a209f0a43c77
M e a sure d t he rm a l re sist a nc e of fra m e w a lls w it h de fe c t s in t he
inst a lla t ion of m ine ra l fibre insula t ion
N R C C - 3 6 0 3 0
B r o w n , W . C . ; B o m b e r g , M . T . ; U l l e t t , J . M . ;
R a s m u s s e n , J .
A p r i l 1 9 9 3
A version of this document is published in / Une version de ce document se trouve dans:
Journal of Thermal Insulation and Building Envelopes,
16, (Apr), pp. 318-339,
April-93
http://www.nrc-cnrc.gc.ca/irc
The material in this document is covered by the provisions of the Copyright Act, by Canadian laws, policies, regulations and international agreements. Such provisions serve to identify the information source and, in specific instances, to prohibit reproduction of materials without written permission. For more information visit http://laws.justice.gc.ca/en/showtdm/cs/C-42
Les renseignements dans ce document sont protégés par la Loi sur le droit d'auteur, par les lois, les politiques et les règlements du Canada et des accords internationaux. Ces dispositions permettent d'identifier la source de l'information et, dans certains cas, d'interdire la copie de documents sans permission écrite. Pour obtenir de plus amples renseignements : http://lois.justice.gc.ca/fr/showtdm/cs/C-42
Measured Thermal Resistance of Frame
Walls with Defects in the Installation of
Mineral Fibre Insulation
W. C.
BROWN,*M. T.
BaMBERG* ANDJ.
M.
ULLETT**Building Performance Laboratory lmtitute for Research in Constructior1 National Research Council Canada (IRC-NRCC)
Ottawa, Ontario, K1A OR6 Canad,,
J.
RASMUSSENRock111ool !lltematimwl AIS Hcdehusmc, Denmark
ABSTRACT: Studies have shown that convective air flow can significantly reduce the thermal resistance of frame walls insulated with mineral fibre insulation (MFl). It has also been shown that convective air flow can be avoided if the MFI products arc installed with at least one face against an air impermeable material. The evolution of MFI products has seen the introduction of products with smaller fibre diameters and lighter densities, <.nci there is a dominance of the frame wall insulation market by fric-tion fit products. The effect of these changes on the installed (field) performance of MFI products is unknown, as is the effect of"minor" installation defects on the per-formance of frame wall insulation systems. This article examines, through a program of full scale laboratory measurements, the effect of corner installation defects and product density on the thermal resistance of frame walls insulated with MFI prod-ucts.
1. INTRODUCTION
W
OOD CHIPS, SHREDDED newspaper, and dried seaweed have ,been used in the past to insulate walls of Canadian houses . For example, *Senior Research Officers.**Technical Officer.
318 J. THERMAl INSUl. AND BlDG. ENVS. Vo!t1mt' 16- April 1993
1065-2744/93/04 0318-22 $06.00/0 ©1993 Technomic Publishing Co., Inc.
M e a sure d t he rm a l re sist a nc e of fra m e w a lls w it h de fe c t s in t he
inst a lla t ion of m ine ra l fibre insula t ion
N R C C - 3 6 0 3 0
B r o w n , W . C . ; B o m b e r g , M . T . ; U l l e t t , J . M . ;
R a s m u s s e n , J .
A p r i l 1 9 9 3
A version of this document is published in / Une version de ce document se trouve dans:
Journal of Thermal Insulation and Building Envelopes,
16, (Apr), pp. 318-339,
April-93
http://www.nrc-cnrc.gc.ca/irc
The material in this document is covered by the provisions of the Copyright Act, by Canadian laws, policies, regulations and international agreements. Such provisions serve to identify the information source and, in specific instances, to prohibit reproduction of materials without written permission. For more information visit http://laws.justice.gc.ca/en/showtdm/cs/C-42
Les renseignements dans ce document sont protégés par la Loi sur le droit d'auteur, par les lois, les politiques et les règlements du Canada et des accords internationaux. Ces dispositions permettent d'identifier la source de l'information et, dans certains cas, d'interdire la copie de documents sans permission écrite. Pour obtenir de plus amples renseignements : http://lois.justice.gc.ca/fr/showtdm/cs/C-42
Thermal Rcsista11n'
4
Walls ll'ith Dcj1·cts in the ]flstallatiofl LセH@ MF/ 319a project was recorded in 1926 in Saskatchewan where cavities of a wood frame wall were ftllcd with shredded newspaper blown through holes drilled in the externa l hcathing. Th e early insulation materials were gradually re-placed by minera l ribn: in ulation (MFI) in the form of batt (material cut to cavity size) and blankets (material in roll form). (Note that the phrase "min-eral fibre" is used as the generic term for both glass fibre products and basalt or slag fibre products and as the specific term for the latter produ ct.) The first batts and blankets had ftbre diameters larger than
9
microns and were covered with a ォイ。セエ@ paper facing to protect workers handling them. They were also at least 25 mm thinner than the stud spaces in which they were in-stalled.In the 1970s, "friction-fit" MFI products became widely available in the marketplace. These products ftlled the whole cavity space and contained no protective covering. They were slightly oversized in all dimensions so that they would be held in place by the friction between the product and the cavity surfaces. Further improvements in manufacturing technology over the last two decades have led to significant reductions in the diameter of the glass fibres . Glass fibre batts and blankets have been manufactured at densi-ties as low as 8-9 kg/m3
, a value which is about half that from the late 1960s. These products retain almost the same nominal thermal resistance when measured under laboratory conditions, but often have lower stiffness than the older products.
But does material thermal resistance measured under standard laboratory conditions adequately represent field performance of the material installed in a wall? Field performance measured for some insulation systems has con-firmed laboratory values [1]. Others have not. One documented case of dis-agreement occurred in the early 1980s when a significant reduction of ther-mal resistance was measured in a full-scale study of preformed, loose-fill glass fibre insulation on an attic floor [2]. This reduction, which was caused by convective air flow ells, was not predicted by the material te ring. The situation was exacerbated by the loose-fi ll product being applied in the field at much lower den ity than that used in laboratory evaluation of the material. Similar re ults on lo c-fill attic insulation were reported in Refer-ence [3] .
In response to these findings, the manufacturer modifted the MFI product to make it less prone to convective effects, and the Canadian standard for MFI [4] was amended to require a minimum thermal resistivity for loose-fill insulations. The latter response was based on the following reasoning. • Thermal resistivity is determined by the structure of the material. • The structure of the material controls the permeability of the material. • The permeability of the material limits air flow through the material.
320 W. C. BROWN, M. T. BOMBERG, J. M. ULLETT AND J. RASMUSSEN
Therefore, setting a minimum for thermal resistivity limits the conditions that contribute to convective air flow to some extent. Manufacturers in the USA did not follow suit. In fact Oak Ridge National Laboratory (ORNL) recently reported that full-scale measurements of a similar type of loose-fill glass ftbrc product showed a discrepancy of more than 30% between pre-dicted and measured full-scale performance [5].
The ORNL report again brings into question the relationship between material and installed performance, not only for ceiling/attic installations but also for wall installations. There may be a difference between the perfor-mance of Canadian and American MFI products because the degree of re-liance on friction fit to hold the batt in place is not the same in both coun-tries. This difference could result in a different degree of installation workmanship; consequently it could produce different field performance. Similarly, the differences between North American MFI products and Euro-pean products may produce different in-use performance.
Despite changes in MFI manufacturing technology (lower density prod-ucts) and installation techniques (friction fit batts now dominate the frame wall insulation market in Canada), little is known quantitatively about the effects of "minor" installation defects on installed thermal performance. Many studies have demonstrated that full air spaces on both sides of friction fit products can produce a significant reduction in installed thermal resis-tance. However, the limits on the size of the defect necessary for the onset of convective air flow has not been investigated completely. Because of the renewed interest in the performance on installed MFI products, a research project to investigate the thermal performance of frame walls with "imfect" installation was initiated. In contrast with previous studies where per-formance was investigated with full air spaces on either side of the insula-tion, the current study investigated the effect of partial defects, namely, vertical air gaps in the corners of stud cavities which simulate imperfect in-stallation.
2. FACTORS AFFECTING FRAME WALL THERMAL RESISTANCE
2.1 Insulation
MFI products ranging from 9 kg/m3 density glass fibre to 40 kg/m3
den-sity mineral ftbrc, either basalt or slag fibre, arc available commercially. Not only do these MFI products have different initial thermal and mechanical properties but also they arc affected to various degrees by environmental fac-tors prior to their installation. Of particular signiftcancc is their ability to recover if the compressed material ィ。セ@ been stored for an extended period of time, or if it has been exposed to high humidity as a consequence of a
punc-Them/ell Rcsisranrc
4
W,li/_, IIIith D,:f(-crs in rlu· TI!Stallatit>ll Lセヲ@ i\IFI 321 ture in the packaging. Materials that do not recover properly may be espe-cially prone to poor installation.2.2 Wood Framing
According to the National Building Code of Canada, wood used for framing members should have a moisture content less than 19'!-{, by weight. However framing lumber in Canada often has significantly higher moisture content and its drying may introduce a large degree of warping and cupping [6]. Furthermore double studs at windows and corners result in cavities with non-standard dimensions. While this does not affect the structural perfor-mance of the wall, it may cause a significant degree of additional cutting and fitting during the installation of MFI batts.
2.3 Installation of MFI Batts and Blankets
Not much has been published on installation practices of MFI products. Some of the limited information available is documented in Swedish studies performed from 1961 to 1967 and coordinated by the Royal Institute of Technology.
Dahlberg and Hedman [7] examined seventeen buildings, six of which were also studied during the construction stage. Methods of fitting batts fell into three general categories:
1. Precise cut (11 buildings)
2. Undersize cut, in which spaces were fitted with extra pieces (5 buildings) 3. Slightly oversize, in which pieces that were too large were squeezed at the stud to fit into the cavity (4 buildings), and significantly oversize, in which buckling occurred (5 buildings)
Methods 1 and 2 resulted in a large number of narrow (7 mm wide on av-erage) open joints between insulation pieces or between insulation and wood frame, but no wide open joints were observed. The total length of open joint observed per square meter ranged from 100 mm to 750 mm. Method 3 fre-quently produced a large number of air spaces between the insulation and the sheathing. Because it was thought that convective air flow requires both open joints and air spaces, this aspect received special attention. It was observed in three walls, but in only one case did it appear to be signifi-cant- cracks of 130 nun length per square meter of wall and air spaces be-tween the insulation and sheathing on 50% of the face with an average depth of I 0 mm.
2.4 Installation Defects
An extensive study of convective air flow effects with MFI in wood-frame walls was performed in 1962-3 by Wolf, Solvason and Wilson [8]. Two
122 W. C. BROWN , M. T. BaMBERG, J. M. ULLEn AND J. RAsMusseN
Table 1. Thermal resistance of wall with and without convecfion barrier (polyethylene} as measured by Wolf eta/. [9} .
R-Value* (m2·K/W)
Horizontal
Insulation Dividers w/Barrier
A none I. 9 1 ••
A mid-height 1.87
B none 1. 9 1
'Includes inside and outside film resistances during the fest. ''Barriers on both sides of insulation.
w/o Barrier 0.88 1.01 0.99 Reduction 46% 54% 51%
types ofMFI were used-Type A with density ranging between 13 and 14.5 kg/m3
and Type B with density between 32 and 40 kg/m3
• The test specimen,
2440 mm X 2440 mm, was finished with plywood sheathing. The insula-tion batts, 50 mm thick, were installed in the stud cavity with 19 mm deep air spaces on either face. Thermal resistance of the test specimens was measured in a guarded hot box with a temperature difference of about 50 K. The results (Table 1) showed large reductions of thermal resistance when both sides of the insulation were exposed to the air spaces. Conversely, only a minor reduction occurred when a convection barrier was installed on both sides or one side with the other side exposed to air. Swedish studies [9,10) reported similar effects. Reduction of thermal resistance occurred with air spaces on both sid es of the insulation but good agreement between measured and calculated thermal resistance was observed when stud cavities were completely filled.
These Canadian and Swedish studies show that the reduction of thermal resistance that follows faulty installation technique depends primarily on the existence of air spaces on both sides of the insulation. Subsequent research
f1
1, 12] has investigated the effectiveness of sheet materials such as weather barriers or vapour barriers to ensure that installed thermal resistance of in-sulated walls matches predicted values. The National Building Code of Canada recognizes the potential for poor thermal performance arising from faulty installation technique and includes the following specific installation requirement for insulation [13]:9.25.4.2. Batt-Type i11sulation . Batt-type lnsulati!ll'l maw!facrured with 110 111£'111·
brane 011 either fac e shall be instaUcrl so rlwr at least vm•face Is h1 ju(( and w11tinuous
Wil-t act with daddl11g, sheathitl.f? or vther air-impermeable membrane.
The issue of convective air movement and its effect on the thermal resis-tance of frame walls with MFI appears often in the literature, mainly as ex-perimental studies highlighting the need for controlling convective air flow
TIHT/IIcli Rc>i>tcwcc
4
H'<TIIs 11'itl1 Dcfi·crs ill r/1e [IIStallarioll エセH@ MF/ 323in the cavity [14,15] or improvements in computational models (5,16,17]. One work [18] provided an experimental demonstration of the "threshold gap" necessary to connect two air spaces existing on both sides of the insula-tion. The studied example included foil faced 50 mm thick insulation placed between two 15 mm thick air spaces. A variable gap was provided at the ends of the cavity to connect these two spaces. In the horizontal orientation gaps 4-5 mm wide were necessary to initiate convective air flow. However, in the vertical orientation gaps less than 1 mm wide were found to be suffi-cient to initiate convective air flow.
3. DETERMINATION OF FRAME WALL THERMAL RESISTANCE
3.1 Calculations Based on ASHRAE Models
Two simplified ASHRAE heat transfer models, generally referred to as the "parallel" and "series-parallel" models, are used to predict the thermal resis-tance of wood frame walls [19]. The first model assumes only parallel flow, i.e., the shortest heat flow path without any contribution from the lateral heat flow. The overall thermal resistance is obtained from the area weighted average of parallel path conductance values. The second model assumes another extreme case, namely, a perfect equalization of temperature at each material layer interface; the overall thermal resistance is the sum of the ther-mal resistances of each layer.
These models represent two limiting cases of multidirectional heat trans-fer; the actual thermal resistance of an assembly must fall between them. The higher the ratio between the longest and the shortest heat flow paths across the assembly, the closer the actual thermal resistance comes to the series-parallel model. For instance a good approximation for the thermal resistance of multi-slotted ceramic or concrete hollow blocks can be obtained by using 2/3 of the R-value from the series-parallel model and 1/3 of the R-value from the parallel model. A 50/50 mixing rule has been shown to produce better than 5
a;.,
agreement between measured and calculated values for insulated wood frame walls [20].3.2 Measurement of Thermal Resistance of Frame Walls
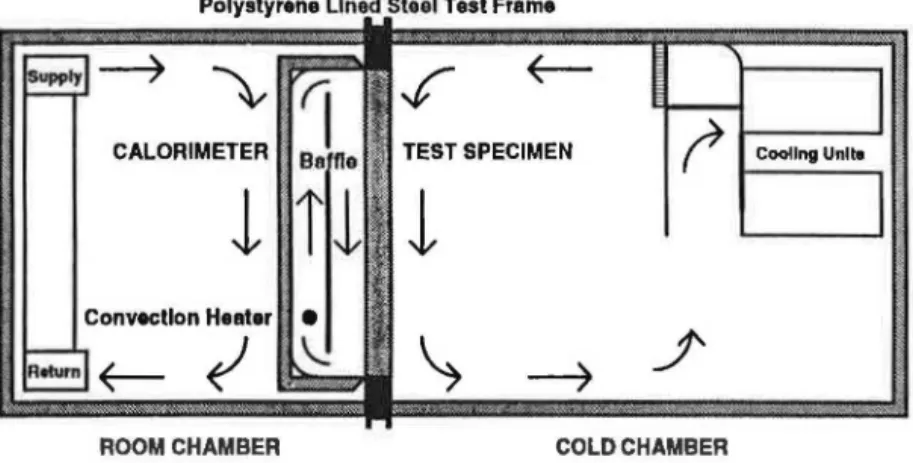
The Guarded Hot Box (GHB) Test Facility at the National Research Council conforms, ゥセ@ general, to that standardized in ASTM C236 [21] (Figure 1). It consists of a cold (weather) chamber where air temperatures can be set between 0°C and - 40°C, a calorimeter (metering box) with 2440 mm X 2440 mm test area where air temperatures can be set between
15°C and 25°C, and a room chamber that acts as a thermal guard for the metering box. The calorimeter is constructed with 76 mm thick
poly-"324 W. C. BRoWN, M. T. BaMBERG, J. M. ULLETT AND J. RAsMussEN
Polystyrene Lined Steel Test Frame
セセ@
""\, r
f
セ@I
I,
セ@
CALORIMETER . Ba ne TEST SPECIMEN Cooling Unite
'
l
i l
l
I
Convection Healer
•
セセ@
;
セ@
\
セ@_j'
ROOM CHAMBER COLD CHAMBER
FIGURE 1. Vertical section through NRC's guarded hot box test facility.
isocyanurate foam covered on both sides by fiberglass-reinforced polyester resin. All walls of the calorimeter are instrumented with a thermopile that forms a sensitive heat flux transducer. This heat flux transducer is used to adjust the room chamber air temperature so that there is negligible heat transfer through the walls of the calorimeter.
A 40 mm thick baffie is located 230 mm from the back wall of the calorimeter. It stretches the full width of the calorimeter, but leaves a gap
238 mm high at the top and the bottom. A row of electric heaters is installed behind the baffie and convective air circulation from the heater carries heat to the test specimen surface. There is, however, also the radiative heat trans-fer from the baffie and calorimeter surfaces to the specimen. To account for these two mechanisms ofheat transfer an equivalent hot side temperature is calculated such that, if both the air and the baffie temperatures had this equivalent temperature, the same heat flow would result [22]. Power to the calorimeter is ュ・MZZセオイ」、@ continuously; 6 hour averages are recorded . A test is considered to be at steady state when four consecutive averages change less than 1
o;,,.
PRECISION
There are two aspects of precision, the measurement precision and the ability to build identical specimens. The second aspect is addressed later dur-ing discussion of the test results. NRC has two GHB f.1cilities [22,23
J
that are identical in size, but differ in the heat transfer mechanisms in both the calorimeter and the cold chamber. An estimate of the first aspect of preci-sion, the measurement precipreci-sion, can be obtained by measuring the thermal resistance of the same test specimen in both facilities. Results of one series ofTher111al ResistaiiC<' of Walls ll1ith Defects i11 th e l11St11llatio11
4
iHFI 325such measurements arc presented in Table 2 . The difference between thermal resistance measured in the two facilities is significantly less than 1 o,{,, dis-playing a level of precision similar to that obtained from small scale tests performed in the Thermal Insulation Test Facility [24,25] .
4. THERMAL RESISTANCE OF FRAME WALLS WITH INSTALLATION DEFECTS
4.1 Scope of the Research Program
The objective of this research study was to examine the effects of material density and installation defects on the thermal resistance of wood frame walls. Three MFI products were included in the study: Product 1 was a medium density glass f1bre batt, Product 2 was a high density mineral fibre batt, and Product 3 was a low density glass fibre blanket that was cut to l.ength to produce batts f the required size. These batts repre ent the range of MFl structure (fibre structure, density, permeability) available commer-cially. The in tallation defect selected for this tudy was an empty space in the sheathing/stud corner, as would be reated by incomplete batt recovery or by edge squeeze as observed in Reference [7) . Anecdotal information, in-cluding non-systematic site surveys, had indicated that MFI products were being installed in frame walls with such defects. Three levels of defects were examined in the study, namely, 0%, 3%, and 6% of the cross section area of the MFI product.
4.2 Test Specimens
SELECTION OF INSULATION MATERIALS
For each MFI product, a sample lot consisting of at least 20 batts were numbered for identification; recovery thickness and mass were measured for each batt. The density of the batts was calculated for the installed thickness of 140 mm. Batts with the lowest recovery thickness, and lowest and highest density were discarded leaving 13 batts representing each product in the
Table 2. Thermal resistance of a round-robin wall test specimen measured in NRC's two guarded hot box test facilities.
GHB #1 GHB #2
hot1 • °C 33.2 19.3 18.6 35. 3 20.2
Twld1 * °C - 2.0 -5 . 1 - 34.9 -0 .9 -5.0
R-va1ue, m2·K/W 1.96 2.06 2. 14 1.96 2.05
• h ot is the equivalent temperature lor the baHie and air temperature.
20.2 -35 .0 2.14
326 W. (. 9ROWN, M. T. BOMBERG, J. M. ULLETT AND J. RASMUSSEN
study. The thermal resistance of a batt with average density was measured in the Thermal Insulation Test Facility at NRC at the installed thickness (140 mm), while the remaining 12 batts were randomly installed in the wall test speomen.
The labeled (nominal) thermal resistance of Product 1 was 3.5 m2·K/W at
a tltickness of 152 mm. Thi product howed good recovery thickness, rang-ing from '156 mm t '168 mm; th density ranged from 12.9 kg/m3
to 14.2 kg/m3 with an average
f
13.7 kg/m'. Selected batts had density ranging from 13.5 kg/m3 to 14 kg/m3•
The labeled thermal resistance of Product 2 was 3.76 1112-K/W at a
thick-ness of 140 m111. This product showed good recovery thickthick-ness, ranging from 142111111 to 149 mm; the density ranged from 32.1 kg/m3 to 37.3 kg/m3 with an average of35.1 kg/m3
. Selected batts had densities ranging from 32.9
kg/m' and 37.1 kg/m'.
The labeled thermal resistance of Product 3 was 3.35 1112·K/W at a
thick-ness of 159 mm. This product showed poor recovery thickthick-ness, ranging from 143 mm to 160 111m, and the density ranged from 7.6 kg/m' to 9.7 kg/m' with an average of 9.0 kg/m'. elected batts had densities ranging from 8.2 kg/1113 to 9.5 kg/m3
• (It should be noted that while three rolls were
purchased, one roll was rejected prior to specimen selection because its color and thickness were not consistent with the other two rolls.)
CONSTRUCTION OF THE TEST SPECIMENS
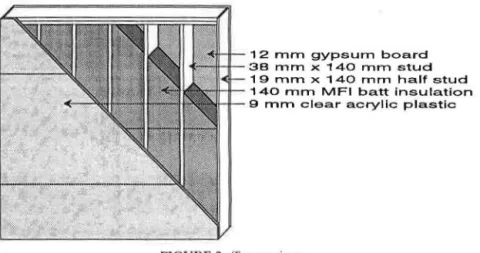
The test specimen (Figure 2) was 2440 mm X 2440 mm and of 38 mm X 140 111111 wood frame construction. It was constructed with a single
bottom plate, a double top plate, and the studs were located at 406 mm on
1 2 mm gypsum board 38 mm x 140 mm stud
1 9 mm x 140 mrn half stud 140 rnrn MFI batt insulation 9 rnrn clear acrylic plastic
centre. To provide precise and reproducible dimensional and thermal resis-tance of the frame, clear "C" selected pine with moisture content not greater than 9'X, was used as the framing lumber. Furthermore, to eliminate any potential air movement between the adjacent cavities, 25 mm wide by 3 mm thick strips of open cell foam were adhered to the faces of the top and bot-tom plates and the studs to form a gasket with the interior and exterior fmishes .
The interior (hot) side was covered with 12 mm gypsum board fmished with two coats of vapour barrier paint. The gypsum board was fastened to the frame by No. 8 X 32 mm drywall screws approximately 200 mm on centre; it was installed with two horizontal joints, each about .610 mm from the top or bottom and scaled with vinyl tape. The gypsum board remained in place for the entire test program.
The exterior (cold) side was covered with 9 mm clear acrylic plastic, pre-drilled at 204 mm intervals and countersunk with No. 6 X 32 mm wood screws used for mounting. (Note that the infra-red transmission characteris-tics of acrylic plastic are such that the material can be used in place of an opaque sheathing material.) Taped, horizontal joints were located opposite the joints in the gypsum board. All changes to the insulation were made from the cold side by removing the acrylic plastic.
The insulation was carefully installed in the stud cavity for the 0% defect test specimen. For the 3
o;,,
and 6'Yo
defect test specimen, the installation defects were located at the four vertical corners of the stud cavity. To ensure consistency, fibreglass screening material was used to maintain the shape of the defects (Figure 3) .INSTRUMENTATION OF THE TEST SPECIMENS
The test specimen was mounted into a 2440 mm X 2440 nun opening of a polystyrene-lined steel test frame. The perimeter was taped to eliminate air leakage around the test specimen.
Air temperature of the calorimeter and of the cold chamber were each measured with eight equally spaced thermocouples and six thermocouples measured the calorimeter baffie temperature. Figure 4 shows the locations of 30 gauge Type T thermocouples used to measure specimen surface tempera-tures and Figure 5 shows the locations of 36 gauge Type T thermocouples used to measure temperatures within the test specimen. These thermo-couples were located in the two center stud cavities and at the three levels shown in Figure 4. Thermocouples mounted to the wood studs were soldered to 5 mm X 10 mm copper shims to average local temperature vari-ations. All thermocouples are calibrated to ensure precision of ± 0.1 °C.
One differential pressure transducer measured the pressure difference be-tween the warm and cold surfaces of the insulation at the mid-height of a
328
Hot Side
Cardboard used to allow
stapling to the stud from the cold tide.
Cold Side
FIGURE 3. Detail of 6'Y,, installation defect .
I( 915 VQP セ@
r
-
..
-
.
-
-
-
..
-
..
-
-I --
Mセ M--
MセM f.- - - , - - -f---1 - - - -1 - - •
l
level1'
'(I
' 'II
+
I
+
t
+
I)
I
+
I
' I ' ) ' 'I
I
I
I
I
I
I
6 0 ' ' ' ' ' 'I
I
I
I
I
I
I
' ' ' '•
'IT
+
I
+
I
+ I
+
I
3Ps '
' Level2 ' 'I
I II
(+
...
+
:)
' 1.. ) 305I
I
I
I
I
' ' ' 'll
+
I
+
I
I
+
I
' ' ' 'I
I
I
I
I
610 ' ' ' ' 'I
I
Level3I
I
' ( II)
+
'.,
+
.
+
I
I_l_
' I-
- L.
- I.
--
.
- I.
-
-
J
ォMMSPUセ@-
712 203 203 - 712 SPUセ@t
L
セ@
9
TiH'IIIJcli R('sistallc(' Hセヲ@ Walls ll'ith Dtjl·cts i11 the lllstallatioll (ifJ'vtFI
IX
•
•
IX
•
•
X
セRPS@
}II.,
203 203}II.,
RPSセ@
'
406
Note: All dimensions In millimeters. VIewed from above.
FIGURE 5. Location of thermocouples in the cross section of the test specimen.
329
47
46
47
T
stud cavity. A second transducer measured the differential pressure between the top and bottom of a cavity along a stud on the cold side.
4.3 Measured Thermal Resistance of the Test Specimens
Table 3 lists the surface-to-surface thermal resistance measured for test specimens insulated with the three MFI products included in the study. Note that the thermal resistance for Products 1 and 3 with 0% defects was not measured with - 20°C cold side temperature.
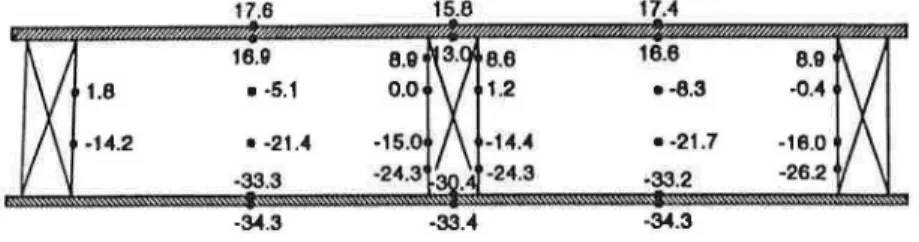
4.4 Measured Temperature Distributions
Figure 6 presents a sample of temperature measurements from within the specimen, in this case from Level2 of the test specimen insulated with Prod-uct 1 with 6% defects. Differences of temperature for otherwise identical locations arc attributed to slight differences in the placement of thermo-couples and to variations in the structure of the material. However these dif-ferences are small and generally speaking all measured temperatures show a consistent pattern. Average test temperatures for the two instrumented stud cavities were normalized to the hot/cold air temperature difference. Table 4
Table 3. Thermal resistance measured for frame walls insulated with three
different MFI products installed with three different levels of defects.
Product 1 Product 2 Product 3
Tcold 0% 3% 6% 0% 3% 6% 0% 3% 6%
-5°C 3.15 3.08 2.87 3.29 3.22 3.10 2.95 2.80 2.53
-20°C 3.07 2.62 3.37 3.23 2.97 2.76 2.24
.130 W. C. BROWN, M. T. BoMBERG, J. M. ULLETT AND J. RASMUSSEN 17.6 15.8 17,4 16.9 8.9 8.8 16.8 8.9 1.6 • -5.1 1.2 • -8.3 -0.4 -14.2 • -21.4 -14.4 • ·21.7 ·18.0 -33.3 -24.3 ·33.2 -26.2 -34.3 ·33.4 ·34.3
FIGURE 6. Temperatures measured at Level 2 of test specimen with Product 1 with 6'Y,,
defects.
lists the normalized temperatures measured in the test specimens insulated with the three MFI products included in the study.
5. ANALYSIS OF MEASURED RESULTS AND DISCUSSION
5.1 Repeatability of Specimen Construction
Table 5 lists thermal resistance measured in a repeated test of Product 2 and third test involving Product 2', all with 0% defects. The rebuilt speci-men was constructed with all batts installed in the same locations in the test specimen. Product 2' was manufactured on the same product line as Prod-uct 2 and the average density installed in the test specimen was within 2% of that ofProduct 2 (35.8 kg/m3
vs. 35.1 kg/m3
). The results indicate that the
thermal resistance measured for the ftrst specimen built with Product 2 (Oc-tober 1992) was 2-3% higher than that measured for the rebuilt specimen (March 1993). However, the thermal resistance measured for the test speci-men with Product 2' was quite close to that measured for the rebuilt Prod-uct 2 specimen.
Table 4. Normalized temperatures in 1/3 and 213 of the insulation thickness at three levels on test specimens subiected to 55 K air to air temperature difference .
Product 1 Product 2 Product 3
0% 3% 6% 0% 3% 6% 0% 3% 6% Level 1 1/3 0.48 0.65 0.72 0.48 0.58 0.73 0.64 0.66 0.80 2/3 0.24 0.33 0.41 0.22 0.29 0.39 0.30 0.33 0.46 Level 2 1/3 0.53 0.50 0.53 0.47 0.50 0.52 0.59 0.54 0.52 2/3 0.22 0.21 0.25 0.22 0.21 0.24 0.30 0.24 0.24 Level 3 1/3 0.51 0.35 0.21 0.49 0.34 0.27 0.56 0.38 0.18 2/3 0.21 0.13 0.06 0.21 0.15 0.08 0.28 0.16 0.05
T her111al Rcsisraurc <!f ltJ,'a/ls ll'irh Dlji•rrs i11 rhc [IISta/l,lfioll of M Fl 33 1
Table 5. Thermal resistance measured for test
specimens with Product 2 with 0% defects built in
October 1992 and rebuilt in March 1993 and Product 2' built in February 1993.
Product 2 Product 2 '
T,old Oct '92 Mer '93 Feb '93
-5°C 3.36 3.29 3.32
-20°C 3.37 3.36
-35°C 3.54 3. 43 3.43
The temperatures measured in the O ctober and M arch tests indicated that, while the temperature gradient thr ugh the studs remained th arne for both tests, the temperature g radient through the insulatio n changed measurably. The conclusion js that the thermal perform ance of the insulation was different for the two test specimens, but it could not be established whether the change was a consequence of handling the batts during removal and placement in the test specimen or whether it should be attributed to other effects. Given that the second test result agrees well with that of Product 2', the second results will be used as the baseline for Product 2.
The repeatability of test specimen defect construction was also checked. Table 6 lists thermal resistance measured in a repeated test of Product 2 with 3% defects. The rebuilt specimen was constructed with all batts installed in the same locations in the test specimen. The results show excellent agreement between thermal resistance measured for a specimen built in November 1992 and rebuilt in January 1993 and indicate that the defects can be constructed with the same precision as the rest of the specimen.
The results presented in Table 5 indicate that the uncertainty attainable on "ideal" specimens is 2-3%. However, combined with the results in Table 6,
Table 6. Thermal resistance measured for test
specimens with Product 2 with 3% defects built in
November 1992 and rebuilt in January 1993.
Nov '92 3.22 3.23 3.12 Product 2 Jon '93 3.20 3.20 3. 12
B2 W. C. BROWN, M. T. BaMBERG, J. M. ULLETT AND J. RASMUSSEN
Table 7. Thermal resistance measured and calculated for 0% defect test specimens .
Product 1 Product 2 Product 3
T,old Parallel Meas. Ser.-Por. Parallel Meas. Ser.-Par. Parallel Meas. Ser.-Por.
3. 15 3.30 3.15 3.38 3.23 3.39 3.25 3.41 3.29 3.43 3.34 3.52 2.92 3.11 2.95 3. 14 2.98 3.19
they also provided an estimate of the repeatability of test specimen construc-tion, the second component of the measurement precision. It is evident that the effect of installation defects on the thermal resistance of wood frame walls can be measured with an uncertainty of 3% or less.
5.2 Thermal Resistance of 0% Defect Test Specimens
To evaluate the effects of installation defects on the thermal resistance of walls it is ftrst necessary to establish the thermal resistance of a wall with a 'perfect" installation (baseline). This determination can be done in two ways. One, by measuring the thermal resistance of wall test specimens with 0% defects, i.e., the insulation is carefully installed in the cavity; two, by ·: alculating the thermal resistance using the ASHRAE parallel and series-jlarallel models and independently determined thermal resistance of each 111:1terial can be determined as a function of temperature. Table 7 compares rhese two approaches. The agreement between measured and calculated values is excellent for all three products.
5.3 Temperature Gradients
Evidence of convective air flow is provided in Table 4, which shows the 111dexed temperatures measured with a cold side temperature of -35°C at
I /3 and 2/3 of the insulation thickness for the three MFI products. Note that he normalized temperatures measured in the insulation with
oo;.,
defects .vere the same for both - 5°C and - 35°C cold side temperature.One set of temperature distributions, those measured through Product 1 .vith a cold air temperature of -35°C, are plotted in Figure 7. Temperature ,,roftles were identical at the three measured levels (Figure 4) for 0% defects. l"hey become more skewed and dependent on the level in the insulation with I'X, and 6% defects. The pattern shown in Figure 7 is characteristic of that neasured for all three MFI products. The difference in curvature between he top and bottom levels increases with both magnitude of the defect and cmperature difference across the tes t specimen.
in-Location (mm)
j-
Leval1 - Level 2 - Level31FIGURE 7. 1(-mpt·l':lt\lfl' distrihmio us or Produn 1 \ ith ()•y.,, J% セョ 、@ 6% tkl<·cts llll'asurl'd at -35° cold セゥイ@ H'mp cr;li \ITl'.
3.34 W. C. BROWN, M. T. BoMBERG, J. M. Umn AND J. RASMUSSEN
wlation is caused by radiative heat transfer. For an optically thick layer, the semi-empirical model of heat transfer in dry MFI [26] predicts radiation proportional to the third power of the mean temperature. Even though air conduction, another component of heat transfer, is inversely related to the mean temperature and the interaction between conduction and radiation will also counteract and partly reduce the non-linear effect of radiation, the net result is that the effective thermal conductivity varies non-linearly across the MFI batt. Since radiation has a stronger temperature dependence, it pro-duces a non-linear (depressed) temperature profile under steady state condi-tions, as is observed for all three products with 0% defects.
Warm air moving within the insulation will have an effect similar to that of radiative heat transfer, namely it can modify the temperature gradient to a level beyond that justified by the balance of conductive heat transfer [27,28]. Warm air moving in the direction of the thermal gradient will decrease the curvature of the temperature profile, cold air moving in the counteractive flow will increase the curvature. The temperature profiles for Product 1 with 3% defects exposed to a cold temperature of- 35°C show no change in curvature at Level 2 relative to the 0% defect case, a depression at Level 1, and an elevation at Level 3 (Figure 7). This result indicates a flow of cold air towards the hot side at the bottom and a flow of warm air toward the cold side at the top. A similar, but more pronounced, pattern is exhibited with 6% defects at the same conditions. The difference between top and bottom profiles grows with increasing temperature difference and percent-age defect. For specimens with 6'Yu defects and -35°C cold side tempera-ture this effect is so large that the top temperatempera-ture profile becomes convex instead of concave as shown for all other cases.
5.4 Pressure Difference in Stud Cavity
While there is no doubt that 3% and 6°,{, defects produce significant con-vective air flow, we may only speculate on the conditions at the onset of convection. The pressure difference across the insulation was below ± 1.0 Pa, the resolution of the fir t differential pressure transducer. Similarly, the pressure difference from top to bottom of the cavity were below ± 0.5 Pa, the resolution of the econd differential pressure transducer. Such small differences combined with the large reductions of thermal resistance points o ut the significanc · f the continuous vertical air gap created by the defects in each corner. It appears that the convective air flow was initiated in the cross section between the hot/cold pairs of air gaps and then spread through the rest of the insulation. A contributing factor is the fact that the air permeability along the MFI product, the manufacturing plane, is much higher than that across the product.
5.5 Thermal Resistance of Walls with Installation Defects
Table 3 presents the thermal resistance measured for the three MFI prod-ucts with different defects and temperature conditions. The effect of defects is smallest for Product 2, the high density mineral fibre, and largest for Product 3, the low density glass fibre. It is clear that low density MFI, which has a lower resistance to air flow, has a higher propensity for convective air flow.
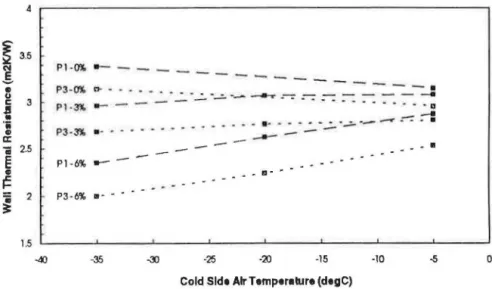
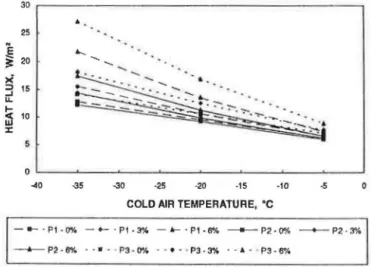
Figure 8 shows the thermal resistance measured for walls with the glass fibre products (Products 1 and 3) with 0%,, J'Yc, and 6'% defects. As expected from the labeled values for the materials, the thermal resistance for the wall with Product 1 with 0% defects is slightly higher. The difference between these products is evident when comparing derating of the thermal resistance caused by 3'Yo defects at the smallest temperature difference (- 5°C cold side). Under these conditions, the derating for Product 3 is twice that of Product 1. Increasing the temperature difference across the test wall from 25 K to 55 K or increasing the percentage of defects from 3';{, to 6'Yo, further decreases the thermal resistance of the walls, although in almost parallel f.1shion. The effect of defects is largest (36% @ 6% defect) for the lower density product. While these numbers on the effect of 」ッョセ・」エゥカ・@ air flow in walls are ofthe same magnitude as previous NRC studies [8,12,14], it must be stressed that in the current study the convective flow was initiated only
4
セ@
3.5!
•
u c 3 セ@·:
a: ii 2.5E
•
セ@ PI -OX. - - - - _ _ _ _-Zセ セ ]@ ZMセMセMセMセMNNZNMM]MMMMMMMM]@
:-:-_
_-_
セMMNMM
:-!
--P3·3% • - "' .... - - . ... -- ,. -- .. ·- :_:_.· ;_·.,:_ .. _:_·_;...·---.- .. •--
• II P16% . -- 1!1- ..-
.
-=
2 P3-6% •- - • セ@ 1.5 L__ _ _ _ . _ _ _ _ . . . _ _ _ _ . _ _ _ _ ..__ _ _ MNセNNN@ _ _ _ ...__ _ _ _ , _ _ _ _ _ , -4) -35 -25 -20 -15 -10 0Cold Sldt Air Ttmptrllurt (degC)
FIGURE 8. Therm al res istan n· measured for walls with Products 1 and 3 (both glass fibre but differen t density).
:'3(J W. C. BROWN, M. T. BaMBE RG , J. M. ULLETT AND J. RASMUSSEN
by corner vertical air gaps, not by an air space on the entire fa ce of the in-sulation as in the previous studies.
Analysis of temperature data measured throughour the test specimens during the tests ( ec Figures 4 and 5) indica ted tha t the changes in thermal performance of the test specimens wa occurrin g entirely due to a change in heat transfer throug h th e in sul ated stud cavity. The heat tran fer throu gh the materi al alone was calculated using an iterative procedure that matched measured wall thermal resistance to that calculated from a 50/50 combina-tion of the parallel and series-parallel ASHRAE models . In this procedure, the "effective" thermal performance of the MFI product was varied to obtain an accurate prediction of thermal resistance.
Figure 9 shows the effect of material structure on derating of thermal per-formance caused by the same percentage of defects. The increase in cavity heat transfer is small for both Product 1 (medium density glass fibre) and Product 2 (high density mineral fibre) at a temperature difference of 25 K. It increases for all three products with both increasing installation defect and decreasing density. The maximum increase in heat transfer exceeds 90% for Product 3 with 6% defect at 55 K temperature difference. In other words, the heat transfer by convective air movement is almost equal to that by con-duction and radiation through the MFI product.
6. CONCLUDING REMARKS
In North America, in contrast to European practice, material thermal re-30 25
e
セ@ 20 >< :::J 15 ..J u. 1-i:5 10 :J: 5 0 40 '35 ·25 ·20 ·15 -10 ·5COLD AIR TEMPERATURE, •c
---4--P2 • 6o/o • • • • • P3 • 0"4 - • • • · P3 - 3% • - A • P3 -6"/o
sistance in the laboratory is assumed to be sufficient for estimating system field performance, and it is not general practice to determine field thermal resistance (i.e., design thermal resistance). In this research project the impor-tance of installation practice was again brought into question by showing how the thermal resistance of frame walls can be reduced when mineral fibre batts or blankets do not fill the stud cavity completely. Three mJterials were included in the study. Product 1 with thermal resistance of 3.5 m'·K/W at 152 mm thickness and an average density of 13.7 kg/m', Product 2 with thermal resistance of3.76 m-K/W at 140 mm thickness and an average den-sity of 35.1 kg/m3
, and Product 3 with thermal resistance of 3.35 m3·K/W
at 159 mm thickness and an average density of 9.0 kg/m3 .
Defective installation of the MFI products was found to reduce frame wall thermal resistance in all cases examined. Temperatures measured throughout the test specimens indicated that the increase in heat transfer occurred en-tirely within the MFI product and not in the framing. The reduction of wall thermal resistance was shown to be inversely related to the density of the MFI product and directly proportional to the temperature difference across the specimen. For example, the thermal resistance of the wall with Product 2 (the highest density product) with 3% defects at a cold air temperature of
- 5°C showed a reduction of 2%. The wall with Product 3 (the lightest product) showed a reduction of 5% under the same conditions. These figures increased to 20% and 36% respectively with 6% defects at a cold air temperature of -35°C.
Since the measured thermal resistance of walls with 0% defects agreed with predicted values, it is evident that the material is performing as ex-pected; consequently, the issue of installation practice needs to be examined. Instead of asking what effect will a change of material characteristics have on the thermal resistance of a wall with installation defects, it is necessary to de-termine material operational characteristics that will minimize installation defects. Ease of handling and an ability to fill the stud cavity, characteristics such as batt tolerances and recovery thickness may become as important a criterion for material selection as its nominal thermal resistance. Issues of-MFI product installation, as well as the thermal performance of low density batts with one-sided defects, should be examined in further research.
REFERENCES
1. Brown, W. C. and G. D. Schuyler. 1982. "/11 situ Measun:ments of Frame Wall Thcnml Resistance," ASHRAE 1hmsartioiiS, 88(1):667-676.
2. lksant, It W. and E. Miller. 1982. "Thermal Resistance of Loose-Fill Fibn:glas Insulation in Spaces Heated from Below," Tha111al PafomJalla' ofthf Exterior E11-iJclop£'s of bオゥャ、ゥL」セウ@ II, ASHRAE, pp. 720-733.
',_lH
·w.
C. BROWN, M. T. BoMBERG, J. M. ULLETT AND J. RASMUSS EN3. Wilkes, K. E. andj. R. Rucker. 1983. "Thermal Performance of Residential Attic Insulation," e QQ・セ [ セケ@ 1111d Buildi11gs, 5:263-277.
4. Canadian Standards Association. 1983. "A 101-Ml983 Thermal Insulation, Mineral Fibre, for Buildings."
5. Wilk es, K. E., R. L. Wendt, A. Delmas and P. W. Childs. 1991. "Thermal Per-form ance of One Loose-Fill Fiberglass Attic Insulation;' A S TM STP 1116, pp. 275-291.
r1. On ys ko. D. M. and S. K. j ones. 1989. "Air T ight11 css o f Wall hcathin g a . . Function of Lumb er Drying," ASHI?.A E 8uildi11g E1111dVpe ii セ@ pp. 458-476.
7. ahlberg. A. and 0 . Hedman. 1967. ' Mineral Fibre [nsul:uion in Walls and Floo rs:' (in Swedish). M .Sc. thesis. Royal Institute ofTcchnology, tockholm .
R. Wo lf, ., K. R. Solvason and A. G. Wilson. 1966. ' onvcccivc Air Flow Effects with Mineral Wo ol Insulation in Wood-Frame Walls, ASHRAfi Tramnciio11s, 72(2):111.3. 1-111.3.8.
9. Ehrman, C. and C. G. Stadler. 1967. "Determination of Mineral Fibre Insulation Ability to Insulate with Typical Faults in Installation," (in Swedish), M.Sc. thesis, Royal Institute of Technology, Stockholm.
0. Linkhorst,
J.
and U. Mejhert. 1972. "Thermal Resistance of Frame Wall with Different Installation Work;' (in Swedish), M .Sc. thesis, Lund Institute of Tech-nology.I. Bankvall, C. G. 1973. "Mechanisms of Heat Transfer in Permeable Insulation and Their Investigation in a Special Guarded Hot Plate;' Heat Transmission
Mea-surements i11 Thermal Insulations, ASTM STP 544, pp. 34-48.
2. Schuyler, G. D. and K. R. Solvason. 1983. "Effectiveness of Wall Insulation,"
ASTM STP 789, pp. 542-550.
J. Natiorwl Building Code of Canada. 1990. Issued by the Associate Committee of the National Building Code, National Research Council of Canada, Ottawa, On-tario.
+.
Brown, W. C. 1986. "Heat-Transmission Tests on Sheet Steel Walls," ASHRAETransactions, 92(2B):554-566.
1 . Bankvall, C. G. 1987. "Air Movement and the Thermal Resistance o f the
Build-ing Envelope;' ASTM STP 922, pp. 124-131.
' · Lecompte,
J.
G. N. 1990. "Influence of Natural Convection in an Insulated Cavity on the Thermal Resistance of a Wall;' ASTM S T P 1030, pp. 397-420. Silberstein, A., C. Langlais and E. Arquis. 1990. "N atural Convection in Light Fibrous Insulating Materials with Penneable Interfaces: Onset Criteria and Its Effect on Thermal Performances of the Products," joumal セヲG@ Ther111al l11Sulatiotl,14:22-42.
' · Threthowen, H. A. 1990. "Sensitivity of Insulated Wall and Ceiling Cavities to Workmanship;' Jounwi LセH@ Tlwmwl lnsrilatio11, 15:172- 179.
'· ASHRAE Hnrulbook of Frllldall!elltals. 1989. American Society for Heating, Re-frigerating and Air-Conditioning Engineers, Atlanta, GA, Chapter 20.
! Brown, W. C. and N. V. Schwartz. 1987. "The Thermal and Air Leakage
Per-formance of Residential Walls," 7th Canadia11 Rigid Polyurethane Foam Conferetrce, Huntsville, Ontario.
is-Th£'n11al R£'sista11r1' o{ Walls with Dcji:rts in the Installation af MFI 339
tancc of Building Assemblies by Means of a Guarded Hot Box," ASTM Book of
Standards.
22. Bowen, R. P. 1985. "DBR's Approach for Determining the Best Transmission Characteristics of Windows," Building Research Note, National Research Coun-cil of Canada, Ottawa, Ontario.
23. Brown, W. C. and J. M. Ullctt. 1992. "Assessment of the Thermal Resistance of NVLAP Round Robin Wall Specimen in !RC's Guarded Hot Box Facilities;' In-ternal Report 660, Institute for Research in Construction, National Research Council Canada, Ottawa, Ontario.
24. Bamberg, M. T. and K. R. Solvason. 1981. "Precision and Accuracy of Guarded Hot Plate Method," Thermal Conductivity 17, Gaithersburg, MD: Plenum Press, pp. 393-410.
25. Bomberg, M. T. and K. R. Solvason. 1985. "Discussion ofHcat Flow Meter Ap-paratus and Transfer Standards Used for Error Analysis;' ASTM STP 879, pp.
140-153.
26. Bamberg, M. and S. Klarsfcld. 1983. "Semi-Empirical Model of Heat Transfer in Dry Mineral Fibre Insulations," journal of Thermal insulation, 6:156-173. 27. Berlad, A. L., N. Tutu, Y-J. Ych, R. Jaung, R. Krajewski, R. Hoppe and F. J.
Salzano. 1980. "Air Intrusion Effects on the Performance of Permeable Insula-tion Systems;' Thermal InsulaInsula-tion Performance, ASTM STP 718, pp. 181-194. 28. Langlais, C. and E. Arquis. 1987. "Thermal Efficiency of Counterflow