Building Condition Monitoring
ByStephen Samouhos B.S. Mechanical Engineering
Massachusetts Institute of Technology, 2004
MASSACHUSETTS INSTl71TE OF TECHNOLOGY
SEP 0
1
2010
LIBRARIES
ARCHMVS
M.S. Mechanical EngineeringMassachusetts Institute of Technology, 2006
SUBMITTED TO THE DEPARTMENT OF MECHANICAL ENGINEERING IN PARTIAL FULFILLMENT OF THE REQUIREMENTS FOR THE DEGREE OF
DOCTOR OF PHILOSOPHY IN MECHANICAL ENGINEERING
AT THE
MASSACHUSETTS INSTITUTE OF TECHNOLOGY JUNE 2010
© 2010 Stephen Samouhos. All Rights Reserved.
The author hereby grants to MIT permission to reproduce and to distribute publicly paper and electronic copies of this thesis document in whole or in part in any medium now known or
hereafter created.
Signature of Author:
Department of Mechanical Engineering June 2010
/7
Certified by: ,~ ' I, - I
-Leon Glicksman Professor of Mechanical Engineering Thesis Supervisor Accepted by:
David E. Hardt Professor of Mechanical Engineering Chairman, Committee for Graduate Students
Building Condition Monitoring
ByStephen Samouhos
Submitted to the Department of Mechanical Engineering on June 1st, 2010, in Partial Fulfillment
of the Requirements for the Degree of Doctor of Philosophy in Mechanical Engineering
Abstract:
The building sector of the United States currently consumes over 40% of the United States primary energy supply. Estimates suggest that between 5 and 30% of any building's
annual energy consumption is unknowingly wasted due to pathologically malfunctioning lighting and comfort conditioning systems. This thesis is focused on developing analytical methods embodied within useful software tools to quickly identify and evaluate those building system faults that cause large building energy inefficiencies.
The technical contributions of this work include expert rules that adapt to HVAC equipment scale and operation, a general framework for applying probabilistic inference to
HVAC fault detection and evaluation, and methods for sorting fault signals according to
user-defined interests such as annual cost of energy inefficiencies. These contributions are particularly unique in their treatment of model and measurement uncertainty within the fault inference, and the careful consideration of user interests in fault evaluation.
As a first step to developing this general framework for fault detection, I targeted first order faults such as simultaneous heating and cooling and imbalanced air flows within several large air-handling units in three buildings on the MIT campus. Experiments included the
purposeful implementation of mechanical and software control programming faults on otherwise fault-free equipment. Between the five pieces of equipment, the software system successfully identified all previously known and experimentally implemented faults, as well as additional faults that had not been previously identified or imposed during the experiment. User testing and experiments show that embracing uncertainty within HVAC fault detection and evaluation is not only paramount to judicious fault inference but it is also central to gaining the trust and buy-in of system users who ultimately can apply fault detection information to actually fix and improve building operations.
Thesis Supervisor: Leon Glicksman
Foreword and Acknowledgements
I have lived the dream that is MIT for almost 10 full years. I came here in September of
2000, not knowing where I would go, what could happen, or much of anything at all. Despite the unknown, and my initial fear of that unknown, I knew that it was the start of the most amazing adventure. Indeed that adventure turned out to be much longer than I could have ever imagined at the time; as a 17 year old, getting into MIT was certainly a dream come true, but thinking that
I would stay here for ten years and earn a doctorate was well beyond a dream; it was reaching for
the stars themselves.
And now, just days before leaving MIT for good, and hours away from completing a document that has taken years to forge, I feel that the real voyage is just about to begin. Like the calm before the storm, today the air is still, and everything moves just a bit slower, allowing me to soak in these final sweet moments of my home for the past decade. I don't know what life will be like in the fall, or next year, or even several years from now, but I stand ready for whatever the seas may bring. I have learned to not fear what I don't know, but instead to seek it out, to understand, to learn, to grow, and to conquer that which I do not yet know.
The experiences that I had here at MIT, especially in the period of history when I was here, are overwhelming and life altering. I am so very proud to say that I have absolutely no regrets; I really did try to do everything, and I couldn't have asked for more. From being a fraternity brother at Delta Tau Delta, to a resident at East Campus on Pi-West, to working with a team to win the IDEAS contest, and the ISN Soldier Design Contest, all the way to "borrowing" MIT's golf carts as a freshman, serenading sororities only to steal their silverware, living in the heart of Kenmore Square when the Red Sox won their first world series in several decades, travelling to the Middle East with my father and missing a month of classes, taking and passing my qualifiers after a weekend ski trip party, earning a Hertz fellowship that supported me for 5 wonderful years, and oh so many more things; the list just keeps going. I cannot be more thankful for the fullest cup of life that I have had at MIT.
I have, over the past 10 years, also had the pleasure and honor of meeting some of the
most amazing friends that a man could ever have. Corey Fucetola was the very first person that I met at MIT, and to this day he has been my best friend, confidant, brother, and favorite critic; bubbles and S'mooch, washing dishes was never more fun. Deanelle Symonds was the big sister that I never had, wished that I did have, but will be lucky enough to always keep in my life; batman and robin will set flight again sometime. Susan Brown, who I've known since year two, was the first person to help me see the big picture at MIT and beyond, and she'll always help me keep that in mind. Bryan Schmid and Greg Mark, both my big brothers from Delts, taught me to look outside MIT for answers; when there is doubt, there is no doubt. Andrew Mcinnes, my friend, teacher, mentor and colleague, without whom I wouldn't have reached this point, and who always told me how it was; go big or go home. John Anastasio, my partner in crime from Northeastern, and colleague in various "adventures". Kaitlin Thaney, who's seen all of this unfold for 8 years from the sidelines and still has the patience to occasionally knock some sense into me. Tim Ferris, who has been my little brother and one of my most trusted friends since Pi-West. Uncle Michael Fishelson and Grant Duers, who were the first to teach me about
"resources" and built my confidence that we could make something great happen. Nicholas Gayeski and Sian Kleindienst, the real dojo-masters of the BT ninjas academy, my best friends,
my inspiration and anchor, my partners in the grand experiment of KGS Buildings, and my "balance point" for ideas on how to fix buildings everywhere. And Danielle Brown, who's love and support got me through in the end; "persistence" never meant so much.
I had always wanted to find my teacher at MIT; someone who could help me see further
into the science and calculus than I could ever on my own; I am very blessed to have had several teachers while at MIT. loannis Yannas, who was my first teacher, gave me the initial confidence to believe in myself, my ideas, and the power of my heritage. John Brisson, from whom every MechE should be lucky enough to learn thermal-fluids engineering, drove me to think deeper about thermodynamics and physics than I had ever before. Markus Zahn taught me the magic of continuum electro-mechanics, and the art of electro-magnetism. Gareth McKinley, my Master's thesis advisor, and the first professor that I ever called by a first name, taught me the rules and art of academic fencing and one of the most important lessons of my education; MIT gives you the tools to solve any problem, but not a detailed list of the problems to solve.
My committee was composed of my last four teachers at MIT. Sanjay Sarma gave me the
confidence to be what I am today, and helped me understand that true knowledge is far more respected and useful than a big equation. Les Norford taught me many things, especially the virtue of patience and humility; we all want to improve the world around us, but change requires patience, and the humility to listen to those who have come before us. Neil Gershenfeld helped me stretch my thinking farther than I ever would have on my own; I'm incredibly grateful to have had someone in my life that challenged me so much to think so differently and in ways that
I would never have considered. Finally, Leon Glicksman, my chair advisor, and the man who
four years ago willingly took a chance to advise an opinionated, difficult, stubborn, mouthy (yet very convincing), self-funded (dangerous), and extremely ambitious graduate student. I'm not sure if an advisor knows how things will turn out when they first accept a new student, but I can't imagine how Leon felt after our first year or so together! I was lucky though; Leon is patient, challenging, honest and devoted to making a difference in people's lives and the world around him. I learned from Leon that simplicity usually leads to success; big problems are only tough while you keep them as big problems. Energy in buildings is a tremendous problem, perhaps one of the biggest possible problems, but that doesn't mean it can't be broken down, made manageable and thereby resolved.
Finally, we reach the end, at 2:41 a.m. on June 1't, the day that I hand in the final piece of
my education at the Massachusetts Institute of Technology. I would not be who I am today, or where I am today without the unceasing love and support of my family. The seeds that
eventually brought forth the ideas in this thesis came from a man who more than 30 years ago arrived in this country from Greece with nothing more than his ambition, strength of heart, and dream of reaching the stars. My father is the greatest man that I will ever know, and I am blessed beyond any measure to have such a man as a teacher, father, and friend; he has reached the stars,
and I hope that I may be sufficiently strong to one day follow him there. Neither of us, however, would be what we are without my mother; she is our rock, our foundation, our un-ending
support. I would never have even applied to MIT 10 years ago without her staunch
encouragement and I wouldn't have made it this far without her strength; like any fantastic mother, she has the magic ability to just always "know" everything. To the Samouhos family, Vinnie, Leah, Christina, Mom, Baba, all I can say is: quantum leap accomplished... found to be improbable, but not impossible.
I know that Fiax-Fica and Tlanoo Xapouo can see us from where they are; I dedicate this
Table of Contents
I Introduction ... 14
1.1 Thesis M otivations and D irection ... 14
1.2 Building Faults and Energy Efficiency ... 14
1.3 Fault D efinition and Identification... 16
1.4 Contem porary "N o-tech" Fault D etection in Buildings... 16
1.5 Thesis goals ... 18
1.6 Thesis Chapter Outline... 19
2 Literature Review ... 20
2.1 Introduction ... 20
2.2 Predicting Building Energy Consum ption ... 21
2.2.1 Introduction... 22
2.2.2 Physical Modeling Techniques for Building Energy Models... 22
2.2.3 Black and Grey Box Modeling Techniques for Building Energy Models... 23
2.2.4 Summary for Predicting Building Energy Consumption... 29
2.3 Fault D etection and Diagnosis of Building System s... 30
2.3.1 Introduction... 30
2.3.2 Overview of Fault Detection and Diagnosis Methods... 30
2.3.3 Quantitative M ethods of FD D ... 32
2.3.4 Qualitative M ethods of FDD ... 40
2.3.5 FD D Based on Process H istory ... 50
2.3.6 Sum m ary of FDD ... 54
3 M odeling of H VA C Equipm ent and Faults ... 55
3.1 Introduction ... 55
3.2.1 M ixing Box Air Flow M odeling ... 62
3.2.2 M ixing Box Recirculation Dam per Fault M odeling... 65
3.3 M ixing Box Sim ulations ... 67
3.3.1 A ssumptions... 67
3.3.2 Results for Boston, M assachusetts... 69
3.4 M easured perform ance of a m ixing box ... 74
3.4.1 Fault-free operation... 74
3.4.2 Fault-laden operation ... 82
3.4.3 Real energy im pact of faults ... 86
3.5 Conclusions ... 95
4 Building Data and Data Uncertainty... 96
4.1 Introduction ... 96
4.1.1 The Role of Data in Buildings Today ... 97
4.1.2 Leveraging the Experience of Building M anagem ent ... 97
4.1.3 M aking decisions with incom plete knowledge... 98
4.2 Collecting data from buildings... 98
4.2.1 Building control system s for data collection ... 99
4.2.2 Cost of Data Collection... 100
4.2.3 W hat to M easure ... 101
4.2.4 Instrum entation Options... 102
4.2.5 Sensor M easurem ent Uncertainty... 103
4.3 Propagation of Uncertainty in HVAC analysis ... 105
4.4 M odes of uncertainty... 105
4.4.1 Random M easurem ent Error... 105
4.4.3 M ethods for accom m odating uncertainty in analysis ... 108
4.5 Probabilistic Inference... 117
4.5.1 Exam ple of cost prioritization... 118
4.6 Taking action under uncertainty ... 118
5 Experim ental w ork on M IT equipm ent... 119
5.1 Introduction ... 119
5.2 AHU s 9 and 10 in M IT Building 46 ... 120
5.2.1 Physical D escription of A HU s 9 and 10 ... 121
5.2.2 Relevant Controls Program m ing ... 124
5.2.3 Instrum entation and D ata A cquisition ... 126
5.2.4 Com m issioning AH U s 9 and 10 ... 130
5.2.5 AH U M odels... 133
5.3 FDD System ... 149
5.3.1 FDD Expert Rules... 149
5.3.2 FDD Financial Estim ates ... 151
5.3.3 Fault Experim ent Program ... 152
5.4 AHUs 2 and 3 in MIT Building 56, and AHU 2 in MIT Building 16... 156
5.4.1 Physical Characteristics ... 156
5.4.2 Relevant Controls Program m ing ... 159
5.4.3 Instrum entation and D ata A cquisition ... 160
5.4.4 Com m issioning ... 160
5.4.5 AH U M odels... 161
5.4.6 FDD System ... 161
5.5 Sum m ary of Experim ental Setup ... 162
6.1 Introduction: ... 163
6.2 FD & E Softw are... 163
6.2.1 Softw are architecture and setup at M IT ... 163
6.2.2 Softw are interface ... 165
6.3 Experim ents in Building 46: A HU s 9 and 10 ... 168
6.3.1 Results from M IT Building 46...:.168
6.3.2 Sum m ary of Results for M IT Building 46... 179
6.4 Analysis of Buildings 16 and 56 ... 180
6.4.1 Findings on 2009 and 2010 perform ance data... 180
6.4.2 Sum m ary of results for M IT buildings 16 and 56... 186
6.5 Results of M onte Carlo Sim ulations ... 186
6.5.1 Introduction... 186
6.5.2 M C Sim ulations ... 186
6.5.3 Sum m ary of results from M C sim ulations... 189
6.6 Feedback from users on system design features ... 190
7 Conclusions... 191
7.1 Lim itations of current approach ... 192
7.2 Further Developm ent... 193
7.3 Final Rem arks ... 199
Table of Figures
Figure 1 Katipamula and Brambley's approach to structuring the field of research in building
fault detection, diagnostics and prognostics ... 31
Figure 2 A plan diagram of the test facility at IEC... 34
Figure 3 A schematic diagram of the AHUs at IEC ... 35
Figure 4 Table of faults tested in ASHRAE 1020, and their method of implementation... 36
Figure 5 Diagram of the "innovations" based fault detection and diagnosis algorithm used in ASHRAE 1020...38
Figure 6 The decision tree used by the passive OAE fault detection module in Katipamula's W B D ... 4 3 Figure 7 From Katipamula et al, 2003, the diagram shows a test sequence for proactive FDD of erroneous tem perature m easurem ent ... 44
Figure 8 From House et al (51), list of expert rules per category of AHU operation. Note that House only relied on temperature and humidity measurements about the system, as well as occupancy schedule and valve control signals... 46
Figure 9 From House et al (50), schematic of a typical economizing AHU for which House et al developed A P A R . ... 47
Figure 10 From House et al (51), diagram of transitions between classifications of AHU operational m odes... 49
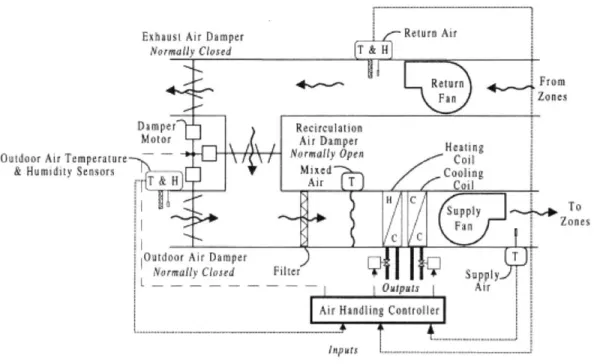
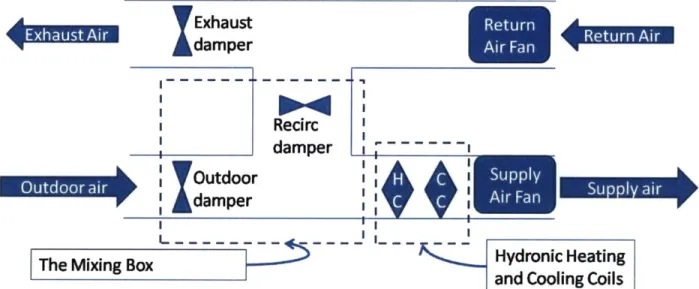
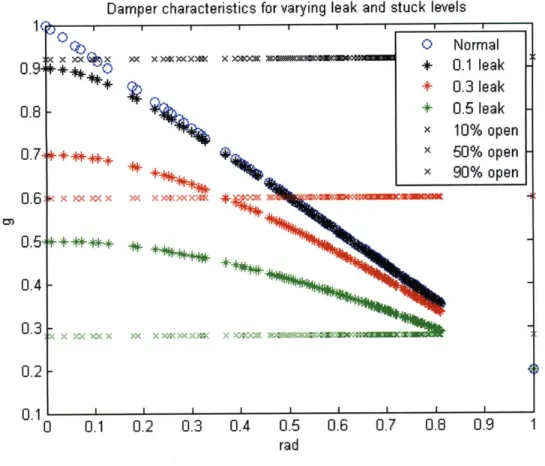
Figure 11 Schematic system model of the variable-air-volume air-handler studied in this project ... 5 7 Figure 12 Families of curves with varying damper authority for percent of maximum recirculated flow through opposed (left image) and parallel (right image) dampers, as a function of percent opening of the damper. ASHRAE Guideline 16-2003 ... 63
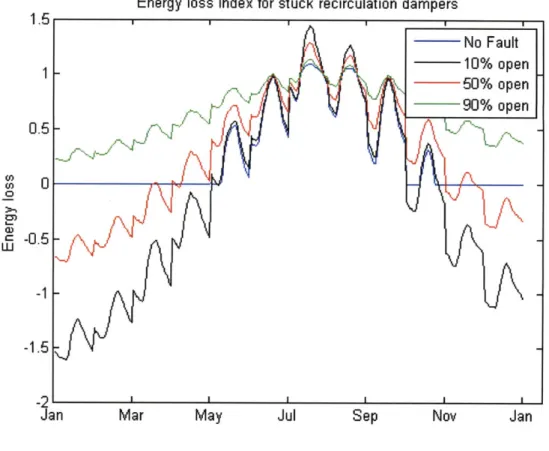
Figure 13 Baseline operation of Air-Handler under fault-free operating conditions for Boston, M assachu setts ... 6 9 Figure 14 Energy loss index simulated for a recirculation damper stuck at various positions... 70
Figure 15 Energy loss index simulated over three damper leakage levels ... 71
Figure 16 Energy impact of various mixing box faults ... 72
Figure 17 Outdoor air fraction versus recirculation damper position for several fault cases, simulated over a year's worth of Boston weather data... 73
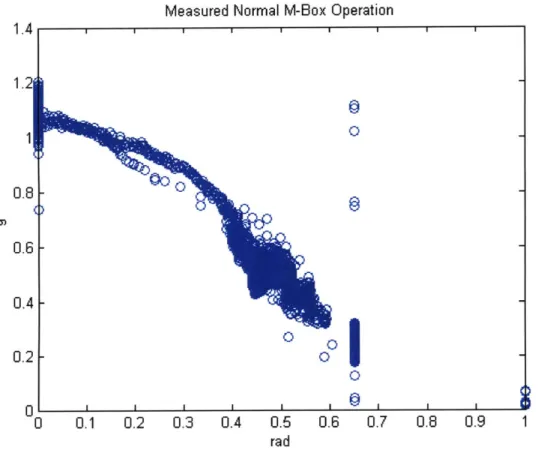
Figure 18 Measured fault-free operation of Air-Handler B at the IEC... 75 Figure 19 Measured fault-free operation of Air-Handler A at the IEC ... 76 Figure 20 Time-series of rad and g measurements on a spring day within ASHRAE 1020-RP for
air-handler B; the tim e series begins at 9 am ... 77 Figure 21 Time series measurements for rad and g, collected from air-handler A over 6 different days spanning summer, winter, and spring seasons... 79 Figure 22 Time-series for rad, g, and supply air flow rate scaled by its maximum possible value (den oted b y ssaf)... 80
Figure 23 Measurements of faults in a real mixing box: stuck and leaking dampers... 83 Figure 24 Data from three different leak levels imposed on air-handler A at IEC during the
w inter testing season of A SHRAE 1020... 85
Figure 25 Distribution of supply air flow rates for AHSRAE 1020 air-handlers; the data is drawn from over 30 days of operating history, measured at 1 minute intervals during the regular
w orking hours of 9 am to 5 pm ... 88
Figure 26 Distribution of humidity for return and supply air, across 30 days from the ASHAE 10 2 0 d ata set ... 89 Figure 27 Simulation results for Des Moines, Iowa: annual outdoor air temperature and damper positions per m onth ... 92 Figure 28 Simulation results for Des Moines, Iowa: scatter of outside air fraction versus return air dam per position ... 93
Figure 29 Simulation results for Des Moines, Iowa: monthly energy consumption per fault status
... 9 4
Figure 30 Modes of uncertainty for measuring a variable, X: a) two discrete readings b) infinite number of readings (adapted from Coleman and Steele, 1995). In both cases, the bias error, Bk represents a systematic difference between the averaged measured value of X and its true value. The precisions error, ek is a measure of the data scatter between the mean measurement of X, an d its sam p le... 110
Figure 31 Propagation of measurement bias and precision errors into experimental results ... 111 Figure 32 Screenshot from the building control system for MIT building 46, detailing a
reminiscent of the schematic VAV AHU design that was included as figure 1 in chapter 3 of this th esis ... 12 2 Figure 33 Picture of the mixing box interior showing the use of turbulators to improve mixing of return and outdoor air; the averaging mixed air temperature string is also shown traversing the turbulator surface. As a length scale, the length of a horizontal turbulator fin is 4 feet... 124 Figure 34 Picture of the i2-920 system controller for AHU 9 in MIT building 46 ... 128 Figure 35 Screenshot of the setup screen for implementing extended logging on an Infinity point; the data logging feature is supported on MIT's building control system for all types of control p o in ts... 12 9
Figure 36 Control volume analysis of C02 species balance around air-handler... 141 Figure 37 control volume analysis of C02 species balance around set of conference rooms.... 141 Figure 38 control volume analysis of C02 species balance around atrium... 142 Figure 39 control volume around mixing box plenum for atrium and conference room returns 143 Figure 40 (upper graph) CO2 concentration contours per supply air flow and outdoor air fraction, and (lower graph) critical curve between supply and outdoor air flow rate for a CO2
concentration of 800 PPM. In both graphs a red-line has been included to show the minimum outdoor air flow that is possible for the AHU ... 145 Figure 41 Picture of an AHU mixing box that is suffering from broken damper linkages, rusted open dampers, and disconnected pneumatic actuators. The picture was taken during a tour of 14 AHUs across the MIT campus; we observed similar pathologies in a number of AHUs across the cam p u s. ... 15 2
Figure 42 Interior picture of the mixing box for AHU 9, showing the outdoor and recirculation air dampers, and their corresponding actuators, and actuator linkages. ... 153
Figure 43 Cascade of mixing box images and close-up pictures of fault implementations; the lower left picture shows the disconection and capping of the pneumatic supply to the outdoor and recirculation dampers at the pneumatic supply manifold for the AHU. The lower right picture shows the removal of a linkage between the outdoor air damper and its actuator. ... 154 Figure 44 Schematic diagram of AHU 2 in MIT building 16; the image is a screenshot from the building control system interface to the AHU ... 157
Figure 45 Schematic diagram of AHU 2 in MIT building 56; the image is a screenshot from the building control system interface to the AHU ... 159
Figure 46 Schematic of the software architecture that underpins the FD&E system developed in th is th esis... 16 4 Figure 47 Screenshot of the software interface, showing features that link the underlying analysis
to user defined settings... 166
Figure 48 Close up view of the software pop-up screen that facilitates closer inspection of analyzed equipment performance; this particular view is for AHU 9 in MIT building 46, for a period when the damper pneumatic pressure supply was removed and the damper control program m ing w as altered... 169
Figure 49 Results screenshot for analysis on air-flows across AHU 9 in MIT Building 46 ... 172
Figure 50 Pictures of faults diagnosed due to inspection of results from software analysis; the right hand image verifies suspicions of flow reversal in the mixing box, while the left hand image shows evidence of a broken pressure transducer for the outdoor air dampers... 174
Figure 51 Results of experimentation on AHU 9 for January 29th, 2010 through February 5th, 2 0 10...-- .. .. 17 7 Figure 52 Condition monitoring on AHU 10 in building 46, from January 22nd, 2010 through Janu ary 29th, 20 10 ... 179
Figure 53 Analysis results on AHU 2 in MIT building 16 ... 181
Figure 54 Results of FD&E analysis on AHU 2 in Building 56... 184
Figure 55 Results of FD&E analysis for AHU 2 in building 16, with current 2010 data... 185 Figure 56
Q-Q
plot of empirical CDF on MC simulation results; a Lilliefors test for normality was applied to the distribution of energy consumption and found the null hypothesis valid at the5 % lev el ... 18 8
Figure 57 Two-sample Kolmogorov-Smirnov test of homogeneity between MC and single sample distributions; the KS test rejeceted the null hypothesis at the 5% level for almost all test sam p les... 18 9
1 Introduction
1.1 Thesis Motivations and Direction
Buildings use 40% of the primary energy supplied in the United States (US), and over
70% of all generated electricity (1), primarily for heating, cooling and lighting. In commercial
buildings, about 20% of their energy consumption can potentially be saved by correcting faults, including malfunctions and unnecessary operation of equipment (2). And research and initial deployments of advanced control systems suggest that they can save an additional 10-20% (3). The energy efficiency resource recoverable through such improved building controls and fault detection correspond to the output from hundreds of power plants, equivalent to more than a third of the coal-fired power production in the United States (4). Realizing these substantial savings will require introducing intelligence into the infrastructure of buildings (4).
This thesis is intended to contribute to the foundation of intelligent building infrastructure
by providing a framework and methods for the automated detection of building energy
in-efficiency faults. The anticipated extensions of this research include application of the fault detection framework towards the construction of next generation phenomenological building control systems, and enhanced intelligent infrastructure for energy efficiency.
1.2 Building Faults and Energy Efficiency
According to a recent report from TIAX (2), commercial buildings can typically reduce their energy consumption by 20-30% through continuous commissioning practices I and the
implementation of a handful of energy efficiency strategies. These statistics are especially pertinent to large commercial buildings whose conditioned surface area exceeds 50,000 square
Commissioning is the practice of reviewing and testing the operation of installed equipment in buildings to ensure their proper installation, controls programming and maintenance; continuous commissioning typically uses real time data feeds to automate and continuously carry out this process.
feet. Of the 5 million commercial buildings in the United States, less than 20% of them can be considered as large, however that sub-set of the stock represents over 80% of the energy used in the commercial building sector, or equivalently 25% of the energy consumed by all buildings (1), commercial and residential. Furthermore, over 80% of the energy inefficiency, or energy wasted
by those large commercial buildings can be attributed to five common pathologies: simultaneous
heating and cooling, extraneous lighting, extraneous heating, cooling or ventilation, imbalanced ventilation systems, and leaky ventilation ductwork (2).
A small sampling of energy audits and inspections for a variety of buildings on the
eastern seaboard of the US, between New Jersey and Massachusetts, further supports the hypothesis that there is no shortage of efficiency opportunities within the US building stock. Amongst a dozen residential and commercial buildings that were inspected as part of this thesis, all of them were found to have efficiency opportunities whose value matched or exceeded 15% of their annual utility bills. Even with a small sample of buildings, I discovered systemic in-efficiencies ranging from thermostat programming errors that caused equipment short cycling, to hot and cold water loops whose connections had been reversed and incurred year-round
simultaneous heating and cooling. Less conspicuous efficiency opportunities were revealed through sub-metering programs in large, mixed-use buildings; for example a 60 story mixed-use tower in New York City, NY, experienced a decrease in common-area-maintenance (CAM) charges by 8% following a re-allocation of utility bills according to tenant actual consumption rather than the more commonly used allocation metric, tenant occupancy square footage.
Still, other buildings were found with oversized heating, ventilation and air-conditioning
(HVAC) equipment that would short cycle and waste energy simply because their control
programming was intended for equipment of a smaller size. While there is no publication or report that has explicitly evaluated or even estimated the total energy efficiency opportunity within the entire US building stock, historical precedence and practical experience suggests that most buildings possess an efficiency opportunity equivalent to or exceeding 15% of their annual utility costs.
1.3 Fault Definition and Identification
Interviews with a variety of building stakeholders in conjunction with results found in the literature and through practical experience suggest that a building pathology, or fault, that wastes money or causes discomfort can be due to a very wide range of issues: erroneous controls
programming, inherent design flaws, mechanical degradation, occupant disposition and many others. Likewise, for each fault that exists, different stakeholders may interpret those faults to have different values or priorities for remediation; financial officers may prioritize energy waste whereas facility managers may prioritize occupant discomfort. As a consequence of this rich fault environment, the definition and implications of a building fault can vary widely depending on the perspective of a stakeholder. The design of a useful fault detection system must therefore consider the technical aspects of faults that the system will identify, as well as the information content that is desired by the intended audience of the fault detection system. The focus of my research is to identify HVAC equipment that consumes more energy than expected, and to communicate those results to an audience comprised of building management, operators, and engineers who control the funds needed to resolve building energy in-efficiencies.
1.4 Contemporary "No-tech" Fault Detection in Buildings
Despite the apparent opportunity for fixing building faults and recovering energy efficiency resources, very few of today's buildings contain a dedicated system for the detection of energy in-efficiency faults. The past twenty years of research and development into
sophisticated and practical building fault detection has yielded numerous potential solutions, as will be discussed later in this thesis, however market proliferation of fault detection products remains very small (2).
One large hurdle for 3rd party or dedicated building fault detection systems is the belief amongst building managers that their traditional means of fault detection are already sufficient; the traditional approach to building fault detection by building managers is through alarms on the building's HVAC control system, occupant feedback and complaints, and routine or
un-scheduled maintenance. Most of the facility and technical stakeholders interviewed in this research stated that they often find equipment inefficiencies while tracking down the causes for occupant discomfort; inefficiencies are often "discovered" by accident during these un-scheduled
equipment inspections. While occupant complaints are certain to raise the fastest response amongst maintenance personnel, it is not a guaranteed solution to finding the most wasteful of in-efficiencies. For example, simultaneous heating and cooling within an HVAC system is an extremely wasteful and prevalent fault, however it typically does not yield uncomfortable space conditions. Consequently, simultaneous heating and cooling often persists for long periods of time without any conspicuous indications of the fault's existence.
Routine preventative maintenance of equipment is another form of building equipment fault detection and remediation. Because the method involves a periodic physical inspection of equipment by an experienced technician, it may appear to be the most reliable amongst fault detection schemes. The technical skill of preventative maintenance personnel, however, is not guaranteed to be sufficient for identifying or fixing all buildings faults. At the same time, preventative maintenance itself is a process that focuses on specific equipment components; if the preventative maintenance schedule does not actually cover the section of the equipment that is defective, then the preventative maintenance technician will not observe the defect. Moreover, many equipment in-efficiencies are artifacts of control system programming errors or operator overrides; these types of software-derived faults are difficult to identify during a routine or un-scheduled equipment inspection.
The contemporary standard for software-based building fault detection is single-variable alarms from the building's HVAC control system. All building control systems support alarm functionality whereby control system installers and designers can implement conventional threshold and duration alarms on measured or computed variables. Such alarms are standard features for making building operators aware of equipment operation that may be un-safe or uncomfortable for building occupants, or deleterious to the useful life of the equipment. While control system software alarms seem like the most obvious solution for continuous detection of
HVAC energy in-efficiencies, they have not yet found extensive use in that capacity. Interviews
energy in-efficiencies is partially due to the miss-match between the intended audience of control system alarms and the audience that wants to identify wasteful equipment operation. Likewise, the technical personnel who are responsible for programming building control systems typically do not have specific training on how to write building control alarms that explicitly identify energy inefficiency opportunities. While building control systems seem to be the most obvious platform for supporting software-based HVAC fault detection, control system companies have not yet delivered explicit software solutions to do so.
As buildings have become more complex and managers find the classical fault detection, paradigm to be insufficient, other 3d party solutions for identifying energy in-efficiency faults have begun to emerge. The most noticeable amongst new solutions in the market are explicit monitoring services where control system alarms are used to filter and condition building operation data for expert fault-detection analysts. Those expert analysts consume the data that is filtered by the building control alarms to create monthly reports that inform building
management stakeholders about efficiency opportunities that exist in their buildings. While successful at identifying and communicating efficiency opportunities, interviews with building stakeholders suggest that such analyst services are still far too expensive for wide-scale or even continuous use over a building's entire lifetime. The high cost of analyst services may be an artifact of the immature market for 3rd party building fault detection; as time goes on, better
technology and extension of the market beyond early-adopters will ultimately drive down the cost for 3 party fault detection.
1.5 Thesis goals
This thesis is motivated by the goal of providing a 3 d party software system that can use building control data to automatically identify, communicate and track building energy
efficiency opportunities for building management. The software automation of what is currently an expert-analyst service could potentially yield a continuous commissioning program that is
sufficiently low-cost for building stakeholders to use it across their entire building stock and for the full lifetime of their buildings. Especially within the context of a growing building stock,
rising energy costs, and deeper political and environmental implications of energy waste, low-cost systems for identifying building energy in-efficiencies may be critical to our energy future.
This thesis has three primary technical goals that should culminate in a prototype automated
HVAC fault detection system
i. Create a fault detection system architecture that could potentially scale to include any type of equipment, in any building, for any fault analysis
ii. Create a fault detection framework that supports probabilistic inference, and expresses results where possible in financial terms that characterize some of the risk as well as the reward of diagnosing or resolving a potential fault
iii. Create fault classifiers that adapt to the equipment or systems that they analyze
The ensuing chapters of this thesis will explore the origins of these goals, their development, and their demonstration within a proto-type automated fault detection system. Additional thesis chapters will discuss the initial performance of that prototype fault detection system and detail the future research needed to further cultivate the underlying ideas.
1.6 Thesis Chapter Outline
The following chapter, chapter 2, will enumerate some of the standard prior art for
HVAC fault detection systems, as well as the apparent research gaps in that literature and how
this thesis intends to fill some of those gaps. Chapter 3 will focus on energy-modeling of Air-Handling Units (AHUs), and the simulation of several equipment and control faults that are typically found in that type of equipment. I will continue to use AHUs throughout the thesis as a test subject for exploring novel fault detection ideas, and chapter 3 provides the physical basis for measuring and predicting AHU energy consumption under fault-free and fault-laden
operating conditions. In addition to defining equipment energy and fault models, chapter 3 also explores the magnitude of impact that various faults can have on AHU energy consumption, as well as the effects of seasonal weather on discriminating between fault-free and fault-laden equipment operation. Chapter 4 of the thesis concerns the more practical aspects of data and uncertainty within the built environment, and how data and uncertainty could be used to detect faults in HVAC equipment. Chapter 4 will explore how model and measurement uncertainty can propagate through the fault detection analysis in order to yield probabilistic inference. In that same chapter I will discuss the methods by which data is typically extracted from a building, and how that process might be improved to further reduce the cost of implementing automated building fault detection systems. Chapter 5 details the application of the core thesis ideas into a tangible prototype system for detecting HVAC faults on the campus of the Massachusetts Institute of Technology (MIT). Chapter 6 includes and discusses the results of applying that prototype HVAC fault detection system to several AHUs across MIT's campus. Finally chapter 7 includes concluding remarks about the ideas and experiments that were developed and explored in this thesis, as well as a roadmap for continued cultivation of these ideas towards the next generation of building control and fault detection systems.
2 Literature Review
2.1 Introduction
Building modeling, simulation and fault detection research has a rich, interwoven history that spans over five decades. Research into software-based methods for detecting faulty building operation extends back to the early 1980's when direct digital control equipment was first deployed in buildings. The government sponsorship for developing building energy modeling tools began in the 1960's with programs for the DOE-2 and BLAST software packages. Today, building modeling for energy prediction or fault detection has evolved into numerous software tools and its own distinct profession; numerous engineering firms exist whose sole service is building energy modeling. Furthermore, the earlier distinctions between fault detection and
energy modeling have begun to fade; building modeling today is used to identify when buildings are not working as we might want them too as well as to quantify the value of correcting that divergent behavior.
There exist three primary approaches to the modeling of buildings:
" Physical Modeling: thermodynamics, mass transport and heat transfer are used to derive
equations of state that describe the performance of the building
" Black Box Modeling: purely empirical state machines, trained by historical building
data, that generate an output for a given set of data inputs
e Grey Box Modeling: empirical models that are enhanced by physical models, or
vice-versa. This approach typically combines physics with building data in order to provide a more accurate, semi-empirical perspective on performance.
Most contemporary design-build construction projects now require a physical energy model of the building in order to achieve certain construction certifications and help the design team make educated choices between various building design options (5). Black box models have been extensively developed for applications in both the detection and diagnosis of building system faults (6) (7) and the prediction of building energy consumption (8). Likewise, physical and grey box models have also been developed to diagnose buildings faults (9) and predict building energy consumption (10). While this thesis is focused on fault detection and diagnostics of building systems, the interaction between fault detection and energy modeling warrants the inclusion of a literature review on both subjects. The following sections will briefly review some of the more recent developments in building energy modeling, and then focus more deeply on the prior art of fault detection.
2.2.1 Introduction
Holistic building energy modeling techniques were originally motivated by the commercial need for tools that could predict and verify the energy-cost implications building design and renovation options. To that end, modeling techniques can now utilize historical building utility records, building design documents or both to create a baseline and forecast for the energy consumption of a building. Several energy models can be generated and compared for
a building, each one representing a different design or renovation case, and thereby provide the basis for judicious selection of design and renovation options. On the other hand, baseline building energy models can also be applied retro-actively after a renovation or design change in order to verify the impact of pursuing those options; this is a technique often used in the
measurement and verification of energy savings after a renovation.
2.2.2 Physical Modeling Techniques for Building Energy Models
Numerous software tools have been commercialized and developed for the physical modeling of building energy consumption (11). Consequently, physical modeling techniques for buildings are very mature and the majority of contemporary work on such techniques has
focused on streamlining user interfaces, improving model accuracy, and expanding model libraries (12) (13). Using today's tools, however, the cost and labor associated with forming an accurate physics-based building energy model is still prohibitively high for all but large and luxury type buildings to have an energy model. The primary cause of that high hurdle is the effort associated with collecting and entering all of the relevant building information into the modeling software. In some cases the high level of effort is unavoidable simply because many buildings do not have as-built drawings or equipment schedules to instruct the modeling agent on how the building is put together or what is in it. In all cases, however, the modeling agent must requisition building information from the building management or designer, and take some action to verify that their building information is accurate.
In order to get around the physical limitations of physical models, industry and academia have focused on the development of empirical modeling techniques that can learn from utility records and other data how a building consumes energy and reacts to its environment. By
eliminating the need for physical information about the building, a black or grey box model may be easier, faster, and less expensive to develop for a building than a physical model.
2.2.3 Black and Grey Box Modeling Techniques for Building Energy Models
ASHRAE's "Great Building Energy Shoot-Out" I and II in the mid-i 990's were high-profile events in the history of the major international efforts devoted to developing black box techniques for predicting building energy consumption. The contests were intended to encourage the development of models that could be used to estimate building energy savings due to HVAC and lighting equipment retrofits; this goal was motivated by the commercial need for tools that could help companies sell and execute building retrofits on the basis of improved energy efficiency. The second contest was particularly successful and focused on predicting the hourly building energy data for the fourth week of every month within a year's worth of building energy data from two buildings at Texas A&M university (10).
Twelve whole months of building energy data were used in the second shoot out contest. The first three weeks of each month were provided as model training data in the contest. The 44 international contestants were judged based on the coefficient of variation (CV) and the mean bias error (MBE) between their predictions and the actual values for the energy data of the missing fourth week of each month. These performance metrics were chosen by the contest organizers and had been used in the first shoot-out as well (14).
t=1(Ypred,i Ydata,i)
N
CV = 100 X
Ydata
X=1(Ypred,i - Ydata,i)
MBE = 100 x N
Ydata
Equation 2-2
The training data set was composed of local weather data and five thermal and electrical energy measurements for each building. In both shoot-outs, the best results were produced by an artificial neural network (ANN) model that also included statistical tests for relevance of input data and refinement of the ANN structure. The winners of the second contest, Dodier and Henze from the University of Colorado and Nebraska, respectively, created an ANN that was perfected through the Wald test, and resulted in an average root mean square error (RMSE) of 17% (15).
Shootout contestants utilized a wide variety of input relevance tests, such as Bayesian relevance estimation (16), statistical tests for nonlinear correlation (17), autocovariance and the Wald test (15), and principal component analysis (18). Contestants consistently identified input selection and model structural design as the principal challenges in model synthesis. Initial input variable selection was made by the organizers based on their broad knowledge of building parameters and weather characteristics that are known to influence building energy usage. These initial variables included outdoor air temperature and humidity, wind speed, insolation, and the energy variables themselves. Contestants independently created additional time variables to capture the influence of annual period, day-type, and other temporal features that are known in the field to impact energy consumption.
In Dodier and Henze's winning entry, a separate ANN was developed for each of the five energy variables in each test building. The model inputs were chosen from a consistent set of inputs, but their network weights were pruned according to the Wald test, which was applied to each separate model. The architecture of the ANN (feed-forward, single hidden layer with 25 nodes) was chosen for ease of implementation and balance between modeling accuracy and ability to generalize. The Wald statistic was computed for each input in each model by training the model with and without the input variable; if the Wald statistic was found to be larger than a given threshold, then the input was deemed relevant.
Dodier and Henze report that the selection of this threshold is another critical parameter that must be empirically determined during model synthesis. A full discussion of the Wald
statistic can be found in Dodier and Henze (15), but in general they report that basic engineering knowledge of input relevance was reflected in the results of the Wald statistical analysis.
Moreover, Dodier and Henze found that their temporal input variables generated greater values of the Wald statistic than did their environmental input variables; they interpreted this result as a reflection of the overwhelming influence of human occupancy on building energy consumption. On the other hand, outdoor air temperature and insolation also follow strict time variations thus further strengthen the role of time in predicting building energy consumption. Finally, Dodier and Henze also suggested that model performance may be improved by taking a Bayesian estimation approach, or constructing multiple models for each prediction, and taking an average output from all plausible models as the final prediction.
In addition to reporting the statistical results of their models, the energy shoot-out
contestants were also asked to predict the dollar savings from retrofits made at each test building. Contestants applied their pre-retrofit models to post-retrofit weather data in order to simulate the building energy consumption that might have occurred in the absence of any retrofits. The simulated energy data was compared to actual post-retrofit energy costs in order to create a margin of savings incurred by the retrofits. Energy savings predictions made by the top five contestants for the larger test building spanned from $83,399 to $189,655, with an average savings of $163,058.
On the other hand, predictions made by those contestants for the smaller test building spanned from -$23,333 to $22,822 with an average savings of $4,761. The reduced accuracy for predictions made on the smaller building were suspected to be due to un-accountable occupancy schedules of the building (10). Overall, however, this wide range of predictions on the economic performance of retrofits is partially responsible for the limited proliferation of forecasting techniques into the mainstream business of selling energy efficiency retrofits.
Continuing from the ASHRAE energy shoot-out, Karatsou et al (19) reduced the problem of ANN driven building energy prediction to three main challenges:
e Input selection
" Gross model structure selection " Model refinement
Various statistical tests have also been developed to help design the architecture of ANN models. Anders and Korn (20) highlight tools such as hypothesis testing, information criteria and cross-validation. Rivals and Personnaz (21) examine methods based on least squares estimation and statistical tests applied to a two step process of building up a preliminary model followed by refinement through subtracting away irrelevant input and middle layer nodes. Karatsou applied the principles found in Rivals and Personnaz to build ANNs that predicted annual building energy data for buildings in Athens, Greece, and Austin, Texas. The latter building data set was the same data set used in ASHRAE's great building energy shoot-out I. In their experiments as well those performed by most other researchers in the field, Karatsou et al used a conventional single hidden-layer, feed-forward ANN model, with hyperbolic tangent hidden layer nodes.
With a constant set of inputs, Karatsou et al incrementally increased the number of hidden layer nodes according to the growth conditions set in Rival and Personnaz (21). Once a satisfactory ANN was built, the network was subjected to a pruning process that removed
irrelevant inputs and nodes. Once again, time of day and an occupancy indicator appeared as the most influential input variables, followed closely by environmental variables such as temperature and insolation, and additional lag variables for temperature and insolation. Synthetic, time-shifted environmental input variables have been used across the literature to account for the thermal inertia of buildings. In general, the two-step statistical approach used by Karatsou et al resulted in ANN models that outperformed the contestants of ASHRAE's building energy shoot-out II, with CVs ranging between 8 and 13%.
Seem (22) in 2006 presented an alternative approach to identifying anomalous energy consumption in commercial buildings via outlier detection algorithms. The novel method employed outlier detection to identify occasions when building electricity consumption was significantly different from it's historical performance. Seem's method evolved from the conventional human-operator approach to anomaly detection, where building operators had to manually pick out anomalous consumption from graphical presentations of utility data. The
intelligent data analysis approach presented by Seem is intended to eliminate the tedious practice of hunting for anomalies, and provide the building operator with data sets populated only by likely anomalous performance data.
Seem's method begins by grouping utility data into day-type categories, with historically similar consumption profiles, and then organizes statistically significant outliers in each category according to their modified z-scores. An outlier in this case is judged to be statistically
significant if the associated studentized deviation of the outlier exceeds a critical value. The severity of the outlier is then ranked according to its modified z-score, which is equal to the number of robust standard deviations between the outlier value and the robust mean (robust statistics are computed from the data set that excludes all outliers). The method was applied to 97 buildings, and over the course of several months the method successfully identified three
buildings with anomalous periods of energy consumption. The causes of those anomalies were investigated and attributed to chiller failures, poor ventilation design and poor controls operation. Seem reports that those errors were corrected soon after their identification, yielding significant energy and operational cost savings for the buildings. A year earlier, Seem had also published a similar pattern recognition algorithm for determining days of the week with similar daily energy consumption profiles (23).
Another more recent addition to the spectrum of building energy intelligence is the application of support vector machines (SVMs) to energy forecasting and fault detection (24),
(25), (26). A popular rival to ANNs, SVMs are typically regarded as having a more rigorous
mathematical foundation than ANNs, and over the past decade SVMs have in fact displaced ANNs in most machine-learning applications (27), (28), (29). SVMs have been particularly
successful in learning problems composed of sparse, yet high-dimensionality training sets, such as those data sets found in DNA micro-array analysis (30). Success in that application suggests that SVMs might also be well suited to similar energy learning problems composed of monthly or daily energy and environmental data. While the building energy literature is well stocked with publications concerning ANNs and other popular intelligence technologies, there is a noticeable dearth of attention paid to SVMs applied to building energy problems. It appears that SVMs are
not even mentioned in the building energy literature until 2005, despite their origins three decades prior.
Recently in 2008, Lai et al reported their results of training SVMs to forecast the building energy consumption of a 2,000 sq.ft. residential building in Tohoku, Japan. Using 15 months of hourly electrical energy consumption and indoor environmental conditions, and daily climate data recordings, Lai et al explored daily and monthly building energy forecasting. In addition, they also tested the ability of their model to identify artificially induced anomalous building energy consumption. The performance of their models was measured by the Pearson and robustness coefficients
P (Xi - 2)O(yi - y-)
(n - 1)SxS,
Equation 2-3
(xi - )
Equation 2-4
where x and y denote the measured and predicted data sets, respectively, S is the standard deviation with subscripts denoting the data sets described by the parameter, and n is the size of the measured data set. The Pearson coefficient, P given by Equation 2-3, is used to measure the correlation between the measured and predicted data, and the robustness coefficient, R defined
by Equation 2-4, is the ratio of the variances for the measured and predicted data sets. Lai's
month-ahead and day-ahead forecasting was found to produce Pearson and robustness
coefficients roughly equal to 0.9. Although it is not clear how the conclusion was reached, Lai et al report that outdoor air temperature was the most significant contributing factor to their
forecasts. By identifying significant differences between predicted and actual energy
consumption, their SVM model was also capable of identifying an artificially induced period of anomalous energy consumption. In their conclusion, Lai et al suggest that since SVMs are sufficiently fast and easy to train on building data, they should be applied as modelfactories to
continuously learn from daily building operations and produce accurate daily or monthly energy forecasts.
In an earlier paper, Dong et al (25) explore SVMs to create forecasting models for the purpose of whole building energy baselining. Their model was applied to four commercial office buildings in Singapore, to predict whole building energy consumption based on monthly
averaged outdoor air temperature, humidity, and solar insolation. Three years of monthly electric utility bills and weather data were used for the training and testing of their SVM models. Dong et
al used a Gaussian radial-basis function kernel for their SVM, as well as a step-wise search algorithm to estimate the best model parameters for the learning problem. Consequently, Dong's models for each building produced CV values, defined by Equation 2-1, under 3% using a single year o'f whole building energy (WBE) training data. The performance of Dong's model exceeded the performance of all other WBE ANN models produced through ASHRAE's great energy shoot-out, which achieved a minimum WBE modeling CV of 10.36%. In their conclusions, Dong et al also claim that their publication was the first to ever explore the application of SVMs to the prediction of whole building energy consumption.
2.2.4 Summary for Predicting Building Energy Consumption
While physical methods for building energy modeling are mature and manifest in
commercial products, black and grey box approaches to building energy modeling represent an active area of academic and industrial research. The literature suggests that the algorithms used for black and grey model input selection and model structure definition in building energy forecasting are of greater importance than the algorithms that are used to train the models
themselves. Cross-over between energy modeling and fault detection is apparent in the literature, and indeed other reviews of the literature typically treat both in the same context of modeling techniques (8).
2.3 Fault Detection and Diagnosis of Building Systems
2.3.1 Introduction
The following examination of prior art for building fault detection and diagnostics explores those applications at all levels of the building (31), ranging from a high-level whole-building
perspective (32), (33), (34) down through specific components and systems within the building
(35), (36), (37), (38), (39), (40). Like building energy modeling, the research in fault detection
and diagnostics can be segmented according to physical, black, and grey box modeling techniques.
2.3.2 Overview of Fault Detection and Diagnosis Methods
Fault detection and diagnostics (FDD) is implicitly based on forming and evaluating comparisons between measured and predicted building performance. Consequently, FDD is a multi-part system comprised of data collection, analysis and inference engines. Because of that multi-part nature, FDD systems can have multiple points of failure; data collection can suffer from broken sensors, analysis can suffer from inaccurate models, and inference can suffer from poor tuning. The complexity in FDD systems has given rise to a rich field of academic and industrial research and development, which will be partially examined in the following sections. Despite the volume of research, however, there does not exist today any set of FDD products that have found as wide application or use in practice as have building energy modeling tools.
The most recent authoritative review of the state of the art of building FDD was prepared
by Katipamula and Brambley in 2005 (6), (7) and we will adopt and expand their organization of
O~aI~lI~ar~e
I
LProcess
[N&oxe-Based
j
odil-Based mi-stDwy Basedetailed Simplified umabe
hysical Physicail Rue*ased PIysics-Based
'iodels Model
First-Princple Lirrwls and ati Artf ial Neural
Sys1ems Based Alarms Networks Terhniqu
Figure 1 Katipamula and Brambley's approach to structuring the field of research in building fault detection, diagnostics and prognostics
Katipamula and Brambley organized the field of FDD research according to their interpretation of the modeling and inference techniques that are being used by FDD researchers. In what they termed quantitative models, Katipamula and Brambley included research where system models were formulated from physical orfirst principle engineering models, and faults were detected by analysis of residuals between model predictions and measurements. On the opposite end of their research classification scheme, Katipamula and Brambley included FDD methods that were primarily based on learning faults from historical process data. The approach in that category of research could otherwise be categorized as purely black box, or even semi-empirical, where the fundamental process of FDD is based on pattern recognition analysis of current data against a historical database. In between these extremes are what Katipamula and Brambley have termed qualitative methods; research in that category includes FDD systems comprised of expert inference rules that are derived from engineering first principles or practical experience.
Overall, the categories introduced by Katipamula and Brambley reflect the manner in which system knowledge is stored in a computer, and how that system knowledge is used to infer the existence of a fault. The three primary method of storing system knowledge include first-principle or physical model derivation, practical engineering models, or historical records of
performance. Likewise, the three corresponding methods of fault inference include residual comparison between models and measurements, violation of expert rules, and detection of statistical anomalies. FDD researchers are not restricted to operate in any one of these research categories, and in fact much of the recent research activity has focused on blending the best attributes of each category.
2.3.3 Quantitative Methods of FDD
2.3.3.1 Overview of Quantitative FDD Methods
Quantitative model-based approaches to FDD rely on detailed physical modeling of system thermodynamics, heat transfer and mass transfer. While the fundamental equations and concepts of physics are universal, the algorithms for using such models to discern and diagnose a specific fault have remained a very active area of research. The quantitative modeling approach to fault detection and diagnosis typically employs the continuous computation of residuals between predicted and measured system performance. Typically, thresholds and simple
discrimination functions are used to convert those residuals into fault signals of varying intensity.
A statistical test may also be applied to these residuals in order to compute the likelihood of a
particular fault (39), (41). In general, quantitative, first-principle models are prone to difficulties incurred by un-modeled behaviors, complex models of transient interactions, loss of generality
by over-development towards a specific system, and requirements for additional system sensors.
Although many physical HVAC&R system models have been developed (42), these limitations have resulted in very few quantitative models that have actually been reduced to practice and tested in realistic situations (9), (43), (44), (45).