HAL Id: inserm-01188071
https://www.hal.inserm.fr/inserm-01188071
Submitted on 28 Aug 2015
HAL is a multi-disciplinary open access
archive for the deposit and dissemination of
sci-entific research documents, whether they are
pub-lished or not. The documents may come from
teaching and research institutions in France or
abroad, or from public or private research centers.
L’archive ouverte pluridisciplinaire HAL, est
destinée au dépôt et à la diffusion de documents
scientifiques de niveau recherche, publiés ou non,
émanant des établissements d’enseignement et de
recherche français ou étrangers, des laboratoires
publics ou privés.
patients.
Loay Kassem, Mathieu Deygas, Laurent Fattet, Jonathan Lopez, Thibaut
Goulvent, Emilie Lavergne, Sylvie Chabaud, Nicolas Carrabin, Nicolas
Chopin, Thomas Bachelot, et al.
To cite this version:
Loay Kassem, Mathieu Deygas, Laurent Fattet, Jonathan Lopez, Thibaut Goulvent, et al.. TIF1γ
interferes with TGFβ1/SMAD4 signaling to promote poor outcome in operable breast cancer patients..
BMC Cancer, BioMed Central, 2015, 15, pp.453. �10.1186/s12885-015-1471-y�. �inserm-01188071�
R E S E A R C H A R T I C L E
Open Access
TIF1
γ interferes with TGFβ1/SMAD4
signaling to promote poor outcome in
operable breast cancer patients
Loay Kassem
1*, Mathieu Deygas
2, Laurent Fattet
2, Jonathan Lopez
2, Thibaut Goulvent
2, Emilie Lavergne
3,
Sylvie Chabaud
3, Nicolas Carrabin
4, Nicolas Chopin
4, Thomas Bachelot
5, Germain Gillet
2, Isabelle Treilleux
6and Ruth Rimokh
2*Abstract
Background: The Transforming growth factorβ (TGFβ) signaling has a paradoxical role in cancer development
and outcome. Besides, the prognostic significance of the TGFβ1, SMAD4 in breast cancer patients is an area of
many contradictions. The transcriptional intermediary factor 1γ (TIF1γ) is thought to interact with the TGFβ/SMAD
signaling through different mechanisms. Our study aims to define the prognostic significance of TGFβ1, SMAD4
and TIF1γ expression in breast cancer patients and to detect possible interactions among those markers that
might affect the outcome.
Methods: Immunohistochemistry was performed on tissue microarray (TMA) blocks prepared from samples of 248 operable breast cancer patients who presented at Centre Léon Bérard (CLB) between 1998 and 2001. The
intensity and the percentage of stained tumor cells were integrated into a single score (0–6) and a cutoff was
defined for high or low expression for each marker. Correlation was done between TGFβ1, SMAD4 and TIF1γ
expression with the clinico-pathologic parameters using Pearson’s chi-square test. Kaplan-Meier method was used
to estimate distant metastasis free survival (DMFS), disease free survival (DFS) and overall survival (OS) and the difference between the groups was evaluated with log-rank test.
Results: 223 cases were assessable for TIF1γ, 204 for TGFβ1 and 173 for SMAD4. Median age at diagnosis was
55.8 years (range: 27 to 89 years). Tumors were larger than 20 mm in 49.2 % and 45.2 % had axillary lymph node (LN) metastasis (N1a to N3). 19.4 % of the patients had SBR grade I tumors, 46.8 % grade II tumors and 33.9 % grade III tumors. ER was positive in 85.4 %, PR in 75.5 % and Her2-neu was over-expressed in 10 % of the cases.
Nuclear TIF1γ, cytoplasmic TGFβ1, nuclear and cytoplasmic SMAD4 stainings were high in 35.9 %, 30.4 %, 27.7 %
and 52.6 % respectively. TIF1γ expression was associated with younger age (p = 0.006), higher SBR grade
(p < 0.001), more ER negativity (p = 0.035), and tumors larger than 2 cm (p = 0.081), while TGFβ1 was not
associated with any of the traditional prognostic factors.
TGFβ1 expression in tumor cells was a marker of poor prognosis regarding DMFS (HR = 2.28; 95 % CI: 1.4 to 3.8;
p = 0.002), DFS (HR = 2.00; 95 % CI: 1.25 to 3.5; p = 0.005) and OS (HR = 1.89; 95 % CI: 1.04 to 3.43; p = 0.037).
TIF1γ expression carried a tendency towards poorer DMFS (p = 0.091), DFS (p = 0.143) and OS (p = 0.091).
(Continued on next page)
* Correspondence:loay.kassem@cairocure.com;ruth.rimokh@lyon.unicancer.fr 1
Clinical Oncology Department, Faculty of medicine, Cairo University, Cairo, Egypt
2
U1052 Inserm, UMR CNRS 5286. Université de Lyon, Centre de Recherche en Cancérologie de Lyon, Centre Léon Bérard, Lyon, France
Full list of author information is available at the end of the article
© 2015 Kassem et al. This is an Open Access article distributed under the terms of the Creative Commons Attribution License (http://creativecommons.org/licenses/by/4.0), which permits unrestricted use, distribution, and reproduction in any medium, provided the original work is properly credited. The Creative Commons Public Domain Dedication waiver (http:// creativecommons.org/publicdomain/zero/1.0/) applies to the data made available in this article, unless otherwise stated.
(Continued from previous page)
In the multivariate analysis TGFβ1 remained an independent predictor of shorter DMFS, DFS and OS.
Moreover, the prognostic significance of TGFβ1 was more obvious in the TIF1γ high patient subgroup than in the
patients with TIF1γ low expression. The subgroup expressing both markers had the worst DMFS (HR = 3.2; 95 %
CI: 1.7 to 5.9; p < 0.0001), DFS (HR = 3.02; 95 % CI: 1.6 to 5.6; p < 0.0001) and OS (HR = 2.7; 95 % CI: 1.4 to 5.4; p = 0.005).
Conclusion: There is a crosstalk between the TIF1γ and the TGFβ1/SMAD4 signaling that deteriorates the outcome of
operable breast cancer patients and when combined together they can serve as an effective prognostic tool for those patients.
Background
Transforming growth factor-beta (TGFβ) belongs to a superfamily of polypeptides that controls cell proliferation, differentiation, motility and apoptosis in different cell types [1]. TGFβ1, one of the 3 isoforms of TGFβ, is a potent negative regulator of mammary gland epithelial cell proliferation [2, 3]. Several studies have demonstrated that TGFβ1 regulates many steps of normal mammary gland development and plays an important role in breast carcinogenesis [1, 4].
TGFβ signaling was proven to have dual role in cancer development as it displays both tumorigenic and tumor-suppressive effects. In early stages of tumor development TGFβ signaling suppresses tumor formation by its anti-proliferative and anti-apoptotic effects and the loss of TGFβ signaling was found to be one of the drivers of breast malignancy initiation. On the other hand, in later stages of carcinogenesis TGFβ1 signaling promotes metastasis by promoting epithelial-to-mesenchymal transition (EMT), angiogenesis and immunosuppression [4–6].
TGFβ signaling is triggered by binding of TGFβ to its receptor with the dimerization of TGFβ type I and II recep-tors (TβRIIs) leading to phosphorylation of the receptor regulated (R-) SMAD2 and SMAD3. Phosphorylated SMADs combine with common mediator (co-) SMAD4 that migrates to the nucleus. The SMAD complexes inter-act with different transcription finter-actors regulating several target genes that control proliferation, metabolism and migration of malignant cells [7] . Besides this classical TGFβ/SMAD signaling, other SMAD independent sig-naling pathways also exist such as activation of mitogen activated protein kinases (MAPK) [8].
The transcriptional intermediary factor 1γ (TIF1γ), is a ubiquitous nuclear protein that has been implicated in TGFβ signaling through its binding to phosphorylated Smad2/3 [9]. TIF1γ could also antagonize Smad4 through its ubiquitin ligase activity [10]. We have recently demon-strated that TIF1γ regulates the TGFβ-induced EMT in mammary epithelial cells and during terminal differenti-ation of mammary alveolar epithelial cells and lactdifferenti-ation through repression of Smad4 activity [11–13]. Most of data from mouse models suggest a tumor suppressor role for TIF1γ [14–16]. However, a recent study has demonstrated
that overexpression of TIF1γ occurs during the early stages of colorectal carcinogenesis, suggesting a role in promoting colorectal cancer [17].
Expression of the TGFβ pathway markers in breast cancer revealed highly contradictory results. On one hand several studies observed that higher TGFβ1 levels in tumors or in the blood of breast cancer patients could predict a better outcome and less distant metastases [18–20]. On the other hand, several other studies reported that TGFβ1 expression carries a poor prognosis in those patients [21, 22].
In this retrospective study we analyzed the pattern of expression of TGFβ1, SMAD4 and TIF1γ in breast cancer tumors. We further analyzed the prognostic significance of each marker and the effect of the interactions between those 3 key players of the TGFβ signaling pathway on the outcome of breast cancer patients that might explain the contradictory results from the literature.
Methods
Patient population
We screened 353 consecutive female patients with operable primary breast cancer who underwent radical surgery and received adjuvant/neoadjuvant therapy at Centre Léon Bérard (CLB) between January 1998 and December 2001. Paraffin blocks of tumor tissue were available for 320 patients. Among these, we failed to assess any of the biomarker staining in 61 tumor specimens as a result of insufficient tumor or tissue loss during tissue microarray (TMA) preparation. Therefore, specimens from 259 patients with operable primary breast cancer were ana-lyzed in this study. 11 patients were not included in the analysis as they were discovered to have metastatic disease at the initial diagnosis. In the remaining 248 samples (due to further tissue loss during slide preparation), 223 cases were assessable for TIF1γ, 204 cases for TGFβ1 and 173 cases for SMAD4 expression. A flowchart of the whole population and subsets tested for different biomarkers is shown in Additional file 1: Figure S1.
Patients underwent either modified radical mastectomy, or breast-conserving surgery. Lymph node invasion was assessed by axillary sentinel node and/or level I and II lymph node dissection and the number of lymph nodes (LNs) harboring metastasis was determined based on
histologic examination. Tumor size was defined as the maximum tumor diameter measured on the tumor speci-mens at the time of surgery. Estrogen receptors (ER) and progesterone receptors (PgR) were detected by immuno-histochemistry and tumors were considered positive if they had a nuclear staining in 10 % or more of the tumor cells. Human epidermal growth factor receptor 2 (HER2) expres-sion was determined using immunohistochemistry and tumors were considered positive if they had 3+ staining by immunohistochemistry or 2+ staining with Her-2 amplification detected by FISH.
The data exported from the patients’ files for analysis included: age, histologic subtype, maximum tumor size, number of LNs involved, SBR grade, ER, PgR expression, HER2 overexpression, date of diagnosis, date of relapse, date of death and date of last news. This study is reported according to the REMARK criteria [23] and was done ac-cording to French regulations and approved by the ethics committee of the Centre Léon Bérard.
Immunohistochemical analysis
Breast tumour samples were inserted as triplicates using a 600 μm needle in 8 Tissue Micro Array (TMA) blocks. The blocks containing invasive carcinoma were sectioned at a thickness of 4μm. After deparaffinization and rehydra-tion, endogenous peroxidases were blocked by incubating the slides in 5 % hydrogen peroxide in sterile water. For heat induced antigen retrieval, tissue sections were boiled in 10 mM Citrate Buffer pH6 (Dako, Trappes, France) using a water bath at 98 °C for 50 minutes.
The slides were then incubated at room temperature for 60 minutes with the antibodies against TGFβ1 (mouse monoclonal antibody MCA797 clone TB21 from AbD Serotec, Munich, Germany), TIF1γ (mouse monoclonal antibody TIF3E9 clone from Euromedex), SMAD4 (mouse monoclonal antibody SC-7966 clone B-8 from Santa Cruz, TX, USA).
These antibodies were diluted using an antibody diluent solution (Chemmate, Dako, Trappes, France) at 1/100 (for anti-TGFβ1), 1/500 (for anti-TIF1γ), 1/250 (for anti-SMAD4). After rinsing in Phosphate Buffer Saline, the slides were incubated either with a biotinylated secondary antibody bound to a streptavidin peroxidase conjugate (LSAB+ Kit, Dako, Trappes, France) for anti-TGFβ1 and SMAD4 or with the Flex kit (Ref K800021-2, Dako, Trappes, France) for anti- TIF1γ antibody. Bound antibody was revealed by adding the substrate 3, 3-diamino-benzidine. Sections were counterstained with hematoxylin.
Blinded to the clinical data, the biomarkers expression was evaluated by 2 observers who assessed both the per-centage and the intensity of cytoplasmic staining for TGFβ1 and SMAD4 and of nuclear staining for TIF1γ and SMAD4 in the infiltrative carcinomatous cells only. For scoring pur-poses, the highest intensity of staining in malignant cells
was classified into 4 levels (0: no staining, 1: weak staining, 2: moderate staining, 3: strong staining) and the percentage of the stained cells was also classified into 4 levels (0: no stained cells, 1: staining in less than one third of the malig-nant cells, 2: staining in one to two thirds of the maligmalig-nant cells, 3: staining in more than two thirds of the malignant cells). Then both the intensity and the percentage scores were added to conclude a single score (from 0 to 6) in a manner similar to the Allred score for ER and PR staining [24].
For the purpose of correlations and survival analyses, tumours were considered to have low expression of cytoplasmic TGFβ1, and nuclear or cytoplasmic SMAD4 if they had a score of 0–2 and were considered to have high expression if they had a score of more than 2, while tumours were considered as nuclear TIF1γ low if they had a score of 0–3 and were considered as TIF1γ high if they had a score more than 3. Choice of the cut-off for high or low biomarker expression was based on the most discriminative cut-off in terms of survival analysis. Finally, patients were considered to have total SMAD4 low (SMAD4 loss) if they had low or no expression of both nuclear and cytoplasmic SMAD4.
Statistical analysis
The correlation between TIF1γ, TGFβ1, SMAD4 expres-sion and clinico-pathologic characteristics, was determined using Pearson’s chi square test (or Fisher’s exact test) for categorical variables and Student’s T test for numerical vari-ables. Disease-free survival (DFS) was defined as the time from the date of diagnosis of breast cancer to the date of any cancer recurrence (local or distant or contralateral), or death. Distant metastasis free survival (DMFS) was defined as the time from the date of diagnosis of breast cancer to the date of distant metastasis or death. Overall survival (OS) was defined as the time from the date of diagnosis of breast cancer to the date of death.
To account for the heterogeneous follow up period resulting from different dates of diagnoses and last follow up visits, we locked the database at a maximum of 12 years of follow up and patients without events at 12 years were censored.
Survival curves, median DMFS, DFS and OS (if reached) in addition to 8 year DMFS, DFS and OS rate (with 95 % CIs) were derived from Kaplan-Meier estimates and the curves were compared using log-rank test [25]. Hazard ratios and 95 % CIs were calculated using cox regression model [26]. Cox multivariate analysis was performed using cox regression model to determine whether a factor is an independent predictor of DMFS, DFS or OS after adjusting for other significant factors at the univariate level. All statistical tests were two-sided, and the p value was considered statistically significant if less than 5 %. The statistical analyses were performed using SPSS 17.0 statistics package (SPSS Inc, Chicago, IL).
Results
Clinico-pathological characteristics
For the 248 assessable patients the median follow up interval was 9.7 years (range: 2 m to 12y). Median age at diagnosis was 55.8 years (range: 27 to 89 years). 49.2 % had tumors larger than 20 mm, 45.2 % had LN metastasis. 19.4 % of the patients had SBR grade I tumors, 46.8 % grade II tumors and 33.9 % grade III tumors. ER was positive in 85.4 %, PR in 75.5 % and Her2-neu was over-expressed in 10 % of the cases. 56.5 % of the patients received adjuvant chemotherapy while 77.4 % received adjuvant hor-monal therapy. Additional file 1: Table S1 shows the clinico-pathological characteristics of the tested patients' cohort.
Expression profile of TIF1γ, TGFβ1 and SMAD4
Representative images of immunohistochemical stainings showing tumor cells with high and low expression of dif-ferent markers are shown in Fig. 1. TIF1γ was high in 80 cases (35.9 %) (Fig. 1a) while 143 cases (64.1 %) showed low expression (Fig. 1b). TGFβ1 showed high expression in 62 (30.4 %) (Fig. 1c) while 142 cases (69.6 %) showed low expression (Fig. 1d).
Nuclear SMAD4 was high in 48 cases (27.7 %) (Fig. 1e) and low in 125 cases (72.3 %) while cytoplasmic SMAD4 was high in 91 cases (52.6 %) (Fig. 1g) and low in 82 cases (47.4 %). Low expression of both nuclear and cytoplasmic SMAD4 (SMAD4 loss) was detected in 70 patients (40.5 %) of the 173 patients (Fig. 1f ). No correlation could be detected between the expression
A
C
B
D
F
E
G
Fig. 1 Representative images of immunohistochemical stainings showing tumor cells with high a and low b expression of TIF1γ, Tumor cells with
high c and low d expression of TGFβ1, Tumor cells with high expression e of nuclear SMAD4, low expression of nuclear and cytoplasmic SMAD4
of TGFβ1, TIF1γ, and cytoplasmic or nuclear expres-sion of SMAD4 (Additional file 1: Table S2).
High TIF1γ expression and loss of SMAD4 are associated with poor prognostic factors
The correlations between clinical parameters and different predictive and prognostic factors with TGFβ1, TIF1γ and SMAD4 expression are shown in Table 1.
TGFβ1 expression was not correlated to any of the traditional prognostic markers such as age, tumor size, SBR grade, axillary lymph node metastasis, ER, PR, and HER2 status. Interestingly, high TIF1γ expression was associated with younger age (p = 0.006), higher SBR grade (p < 0.001), ER negativity (p = 0.035), and a tendency towards larger tumors (p = 0.08).
Loss of SMAD4 expression (cytoplasmic or nuclear) was associated with higher tumor SBR grade (p = 0.004) and more ER negativity (p = 0.02), while the nuclear localization of SMAD4 was not associated with any of the clinico-pathological parameters.
High expression of TGFβ1 and TIF1γ are associated with poor clinical outcome
TGFβ1 expression was associated with more deaths (30.4 % of patients with high expression died versus 17.6 % in patients with low expression, p = 0.04), more disease recurrences (35.5 % of patients with high expression versus 17.6 % in patients with low expression, p = 0.005), and more metastatic relapses (33.9 % of patients with high expression versus 14.1 % in patients with low expression, p = 0.001).
TIF1γ expression (as a single marker) also showed similar trends towards increased number of deaths and distant metastases however, not reaching statistical significance. The loss of SMAD4 expression did not cor-relate with more deaths or relapses. Death and relapse events in correlation with the biomarkers expression are shown in Table 2.
Of interest, the pattern of distant metastases was corre-lated with the 3 biomarkers expression. For example among the 10 patients having bone only metastases, 9 of them expressed SMAD4 (in the nucleus or cytoplasm) while only one patient had no SMAD4 expression (p = 0.050). On the other hand, patients co-expressing TGFβ1 and TIF1γ had more chance of visceral metastases than the rest of the patients population (24.2 % versus 7.3 %, p = 0.002), while such tendency did not appear for bone metastases (p = 0.74).
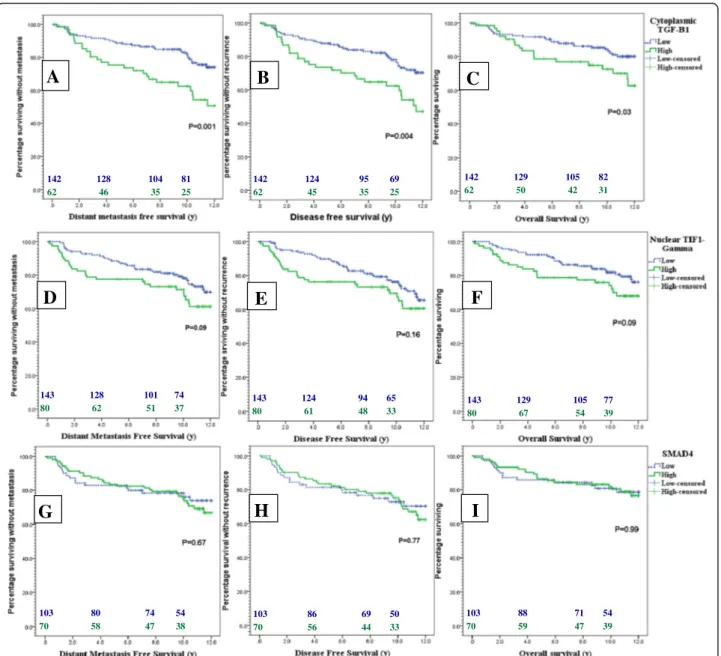
Regarding the patients’ survival, DMFS was shorter in patients highly expressing TGFβ1 than those with low expression with an 8y DMFS rate of 62.5 % (95 % CI: 46.5-78.5 %) compared to 83.2 % (95 % CI: 76–90.4 %) respectively (p = 0.001). DFS was also shortened in high TGFβ1 patients with an 8y DFS rate of 63.5 %
(95 % CI: 46.5-78.5 %) versus 82.1 % (95 % CI: 74.7-89.4 %) in the low expression group (p = 0.004). OS was worse in cases with high TGFβ1 expression with an 8y OS rate of 75 % (95 % CI: 61.9-88.1 %) versus 84.7 % (95 % CI: 77.8-91.6 %) in the TGFβ1 low group (p = 0.03). Fig. 2 shows the Kaplan Meier’s curves for DMFS, DFS and OS according to different biomarker expression.
According to the Cox proportional hazard model high TGFβ1 expression almost doubled the risk of developing distant metastases (HR = 2.28, 95 % CI: 1.4 to 3.8, p = 0.002), and death by 80 % (HR = 1.89, 95 % CI: 1.04 to 3.43, p = 0.037).
Regarding the effect of the classical prognostic factors, DMFS was shorter with tumors larger than 2 cm (HR = 2.61, 95 % CI: 1.59 to 4.30, p = 0.0002), axillary LN involvement (HR = 2.02, 95 % CI: 1.26 to 3.26, p = 0.004), High SBR grade (HR = 2.61, 95 % CI: 1.64 to 4.16, p = 0.00006), ER negative (HR = 2.36, 95 % CI: 1.35 to 4.12, p = 0.003), and PR negative tumors (HR = 1.72, 95 % CI: 1.042 to 2.85, p = 0.03).
Importantly, in the multivariate analysis, when adjusted to tumor size, lymph node positivity, SBR grade, ER and PR status, TGFβ1 expression was still an independent predictor for distant metastasis (HR = 2.56, 95 % CI: 1.5 to 4.3, p < 0.0001) and death (HR = 2.06; 95 % CI: 1.13 to 3.75, p = 0.018). In addition to TGFβ1, large tumor size (HR = 2.10, 95 % CI: 1.25 to 3.49, p = 0.005) and high SBR grade (HR = 1.97, 95 % CI: 1.16 to 3.36, p = 0.013) were the only factors that independently predicted shorter DMFS in the multivariate model.
For TIF1γ expression there was a tendency towards increased risk of metastasis (HR = 1.54; 95 % CI: 0.93 to 2.54, p = 0.09), and death (HR = 1.6; 95 % CI: 0.9 to 2.8, p = 0.09) in cases of high TIF1γ expression compared to cases with low expression.
SMAD4 expression (including nuclear localization) showed no prognostic significance for DMFS, DFS or OS.
Prognostic significance of TGFβ1 is limited to more advanced tumor stages
Interestingly, the effect of TGFβ1 expression on the out-come of breast cancer was observed to be limited to tumors with higher T and N stages. For example, in tumors smaller than 20 mm in the maximal dimension, the 8 years DFS rate was 86.7 % (95 % CI: 76.7-96.7 %) in patients with low TGFβ1 expression versus 86.3 % (95 % CI: 73.2-99.3 %) in patients with high TGFβ1 (p = 0.91). In larger tumors how-ever, the 8 years DFS rate was 79.2 % (95 % CI: 64.1-91.3 %) versus 43.7 % (95 % CI: 16.7-70.7 %) in patients with low versus high TGFβ1 expression respectively (p = 0.0003).
Similarly, in patients with no axillary LN metastasis the 8 years DFS rate was 84.9 % (95 % CI: 74.9-94.9 %) versus 75.5 % (95 % CI: 57.6-93.4 %) in patients with low versus high TGFβ1 expression respectively (p = 0.31). On the other hand, in patients with axillary LN metastasis,
the 8 years DFS rate was 80.9 % (95 % CI: 68.8-93.0 %) versus 50.0 % (95 % CI: 20.8 %-79.2 %) in patients with low versus high TGFβ1 expression respectively (p = 0.001). Kaplan Meier curves for DFS in TGFβ1 high versus low expression in early (T size≤ 20 mm and LN negative) and advanced (T size > 20 mm and LN positive) stages are presented in Fig. 3.
TIF1γ restricts the prognostic significance of TGFβ1
Strikingly, the ability of TGFβ1 expression to predict the poor outcome in breast cancer patients was restricted
to TIF1γ expressing tumors. For example, in the patient population with TIF1γ high expression the 8y DMFS rate was 49.2 % (95 % CI: 16.3-80.8 %) in patients with high TGFβ1 expression versus 82.7 % (95 % CI: 79.2-94.2 %) in patients with TGFβ1 low expression (p = 0.009). On the other hand, in the patient population with TIF1γ low expression the 8y DMFS rate was 78.1 % (95 % CI: 65.9-90.2 %) versus 85.9 % (95 % CI: 75.5-96.3 %) in high versus low TGFβ1 respectively (p = 0.2). The same pattern of difference was also observed in DFS and OS as shown in Kaplan Meier curves in Fig. 4.
Table 1 Correlation between nuclear TIF1γ, cytoplasmic TGFβ1and SMAD4 expression with the clinico-pathologic parameters of breast cancer
Variable TIF1γ low TIF1γ high Pa TGF
β1 low TGFβ1 high Pa SMAD4 low SMAD4 high Pa
No. (%) No. (%) No. (%) No. (%) No. (%) No. (%)
143 (64.1) 80 (35.9) 142 (69.6) 62 (30.4) 70 (40.5) 103 (59.5)
Age (Yr) -Mean (± SD) 59.4(±12) 55.9(±13) 0.048b 57.6(±12) 59.3(±14) 0.37b 56.5(±12) 57.1 (±12) 0.74b
Age groups -≤50y 37 (26) 35 (44) 0.006 44 (31) 21 (34) 0.68 22 (31) 38 (37) 0.46
- >50y 106 (74) 45 (56) 98 (69) 41 (66) 48 (69) 65 (63) Side -Right 68 (48) 37 (46) 0.85 62 (44) 28 (45) 0.84 30 (43) 51 (49) 0.39 -Left 75 (52) 43 (54) 80 (56) 34 (55) 40 (57) 52 (51) T. size -≤2 cm 80 (56) 35 (44) 0.08 73 (51) 30 (48) 0.69 31 (44) 51 (49) 0.49 - >2 cm 63 (44) 45 (56) 69 (49) 32 (52) 39 (56) 52 (51) LN met -Negative 85 (59) 41 (51) 0.24 79 (56) 35 (57) 0.91 36 (51) 55 (53) 0.79 -Positive 58 (41) 39 (49) 63 (44) 27 (44) 34 (49) 48 (47) SBR grade -Gr 1 39 (27) 6 (7) <0.001 30 (21) 11 (18) 0.82 5 (7) 26 (25) 0.004 -Gr 2 72 (50) 30 (38) 63 (44) 30 (48) 35 (50) 50 (49) -Gr 3 32 (23) 44 (55) 49 (35) 21 (34) 30 (43) 27 (26) ER status -Negative 13 (9) 15 (19) 0.035 24 (17) 6 (10) 0.17 13 (19) 7 (7) 0.02 -Positive 129 (91) 64 (81) 116 (83) 56 (90) 56 (81) 95 (93) PR status -Negative 28 (20) 22 (28) 0.18 38 (27) 11 (18) 0.14 18 (26) 21 (21) 0.40 -Positive 113 (80) 57 (72) 101 (73) 51 (82) 51 (74) 81 (79)
Her 2 status -Negative 126 (91) 69 (87) 0.35 125 (91) 54 (89) 0.66 60 (90) 90 (89) 0.93
-Over-expressed 12 (9) 10 (13) 13 (9) 7 (11) 7 (10) 11 (11)
Breast cancer subtype -Luminal 127 (91) 64 (81) 0.12c 114 (83) 55 (90) 0.31c 54 (81) 94 (93) 0.05c
-Her2 rich 2 (1) 3 (4) 4 (3) 2 (3) 2 (3) 1 (1)
-Basal 11 (8) 12 (15) 20 (14) 4 (7) 11 (16) 6 (6)
(Neo)/ Adjuv. Hormonal ttt -Tamoxifen 101 (89) 54 (87) 0.89c 95 (92) 44 (83) 0.20c 48 (89) 75 (94) 0.48c
-AI 4 (4) 3 (5) 3 (3) 2 (4) 1 (2) 1 (1)
-Tamoxifen + AI 8 (7) 5 (8) 5 (5) 7 (13) 5 (9) 4 (5)
(Neo)/ Adjuv. chemotherapy -Anthra. 52 (85) 40 (82) 0.61 58 (76) 25 (83) 0.59 34 (74) 44 (80) 0.48c
only 9 (15) 9 (18) 16 (21) 5 (17) c 11 (24) 11 (20)
-Anthra. + 1 (2) 0 (0)
Taxane 0 (0) 0 (0) 2 (3) 0 (0)
-Others
aCorrelations tested by Pearson’s Chi square test (2sided) unless otherwise specified b
Difference between means by Student’s T test
142 124 95 69 62 45 35 25 142 128 104 81 62 46 35 25 142 129 105 82 62 50 42 31 143 128 101 74 80 62 51 37 143 124 94 65 80 61 48 33 143 129 105 77 80 67 54 39 103 80 74 54 70 58 47 38 103 86 69 50 70 56 44 33 103 88 71 54 70 59 47 39
A
B
C
D
E
F
G
H
I
Fig. 2 Kaplan Meier plots for the impact of low (Dotted blue) versus high (green) expression of TGFβ1 a, b, c, TIF1γ d, e, f and SMAD4 g, h, i on
DMFS a, d, g, DFS b, e, h and OS c, f, i in breast cancer patients
Table 2 Death, relapse, and metastatic events in correlation with TIF1γ and TGFβ1 expression
Events TIF1γ low TIF1γ high P* TGFβ1 low TGFβ1 high P* SMAD4 low SMAD4 high P*
No. (%) No. (%) No. (%) No. (%) No. (%) No. (%)
143 (64.1) 80 (35.9) 142 (69.6) 62 (30.4) 70 (40.5) 103 (59.5) Death -Alive 115 (80) 57 (71) 0.11 117 (82) 43 (69) 0.04 56 (80) 82 (80) 0.95 -Dead 28 (20) 23 (29) 25 (18) 19 (31) 14 (20) 21 (20) Recurrence -No 113 (79) 59 (74) 0.37 117 (82) 40 (65) 0.005 56 (80) 78 (76) 0.51 -Yes 30 (21) 21 (26) 25 (18) 22 (35) 14 (20) 25 (24) DistantMetast. -No 118 (83) 60 (75) 0.18 122 (86) 41 (66) 0.001 58 (83) 81 (79) 0.49 -Yes 25 (17) 20 (25) 20 (14) 21 (34) 12 (17) 22 (21)
Moreover, the subgroup of patients expressing both TGFβ1 and TIF1γ had the poorest prognosis when compared to the rest of the patients' population. The 8 years DMFS, DFS and OS rates were 49.2 % (95 % CI: 16.3-80.8 %), 48.3 % (95 % CI: 15.2-75.3 %) and 59.1 % (95 % CI: 29.8-88.4 %) in the TGFβ1-high/TIF1γ-high subgroup versus 82.4 % (95 % CI: 75.2-89.8 %), 81.8 % (95 % CI: 74.4-89.2 %) and 85.3 % (95 % CI: 91.2-79.4 %) in the rest of the population (P < 0.001, <0.001 and =0.003 respectively). Kaplan Meier curves of DMFS, DFS and OS of this subgroup are shown in Fig. 5.
According to Cox regression model the co-expression of TGFβ1 and TIF1γ increased the risk of metastases
(HR = 3.2; 95 % CI: 1.7 to 5.9, p < 0.0001), any recurrence (HR = 3.02; 95 % CI: 1.6 to 5.6, p < 0.0001) and death from any cause (HR = 2.7; 95 % CI: 1.4 to 5.4, p = 0.005). In the multivariate analysis, and when adjusted to age, SBR grade, tumor size, and lymph node invasion the co-expression of TGFβ1 and TIF1γ remained an independent poor prognostic factor that predicted metas-tasis, any recurrence and death from any cause.
TIF1γ strongly predicts relapse and death in patients with SMAD4 loss
Low expression of SMAD4 appeared to manipulate the outcome of patients with TIF1γ high versus low expression.
73 68 50 36 30 26 23 17 69 56 45 33 32 19 12 8 79 72 54 39 35 30 23 17 63 52 41 30 27 15 12 8
A
D
C
B
Fig. 3 Kaplan Meier curves for DFS of TGFβ1 low (Dotted blue) versus high (green) expression in patients with tumors ≤ 20 mm a, > 20 mm b,
81 74 53 43 34 27 22 16 47 39 33 24 22 14 9 6 81 74 53 43 34 27 22 16 47 39 34 24 22 15 9 6 81 76 59 48 34 29 25 17 47 40 35 24 22 16 11 10
B
A
D
C
F
E
Fig. 4 Kaplan Meier plots for DMFS a, b, DFS c,d and OS e, f of TGFβ1 high (green) versus low expression (Dotted blue) in TIF1γ low patients a, c, e and TIF1γ high patients b, d, f
In patients with SMAD4-low tumors, TIF1γ expression strongly predicted metastasis, any cancer recurrence and death, while in patients with SMAD4 high expression, the TIF1γ expression did not show any prognostic value. In pa-tients with SMAD4 loss, the 8 years DMFS rate was 66.2 % (95 % CI: 41.2-91.2 %) in patients with high TIF1γ versus 93.9 % (95 % CI: 82.9-100 %) in patients with low TIF1γ (p = 0.001), while it was 77.2 % (95 % CI: 60.0-94.4 %) versus 81.0 % (95 % CI: 70.5-91.5 %) respectively (p = 0.96) in the SMAD4 expressing group. Similarly, DFS and OS showed the same difference only in patients with low SMAD4 ex-pression (p = 0.006 and 0.004 respectively) while such dif-ferences were absent with high SMAD expression (p = 0.39 and 0.40 respectively). Figure 6 shows Kaplan Meier curves for DMFS, DFS and OS in patients with TIF1γ high versus low expression according to SMAD4 status of the tumors.
Discussion
In our present work we found a definitive poor outcome in patients whose primary breast tumors showed higher expression of cytoplasmic TGFβ1. Those patients had an increased risk of metastasis and death and this risk was independent from the other major prognostic factors such as tumor size, LN involvement, SBR grade and hormone receptor status. The poor outcome in those patients was restricted to patients with larger tumors (more than 2 cm) and axillary lymph node metastasis (N1a-N3), an observation that might be explained by the dual role of TGFβ signaling in different stages of carcinogenesis.
Our results are in agreement with the work of Des-ruisseau et al. who reported that a high TGFβ1 protein level measured by enzyme-immunoassay in breast cancer tissue was an independent poor prognostic marker for disease free survival [21]. Richardsen et al. also reported that high stromal expression of TGFβ in breast cancer areas was associated with increased mortality. [22]. However, other studies showed opposing results with
better DFS and OS in patients with high TGFβ1 and TGFβ receptor type II expression [18] and lower recurrence rates with patients expressing TGFβ1 and pSMAD2/3 [20].
Our data may help to provide explanations for some of the discrepancies in the results of previous studies testing TGFβ1/SMAD4 pathway biomarkers expression. Such discrepancies might be explained by the different effect of TGFβ1 expression in early versus advanced tumor stages, the heterogeneous population included in such retrospective trials and the crosstalk between TGFβ signaling and other pathways. Indeed in our study, we also observed a significant interaction between TGFβ1, TIF1γ expression and the prognosis of breast cancer patients, an interaction that was not investigated in previous studies. The subgroup of patients expressing both TGFβ1 and TIF1γ showed the poorest outcome compared to the rest of the patient population. Finally, the different scoring systems for biomarker staining in those studies may account for this diversity, putting into account what was suggested by Bierie et al. that gain or complete loss of TGFβ signaling may result in gene expression signatures correlated with poor prognosis in breast cancer [27].
On the other hand, TIF1γ expression showed tendency towards poor outcome in breast cancer patients. That ten-dency became significant when combined with TGFβ1 expression and SMAD4 loss. To our knowledge this is the first study to report such interactions which might be unexpected in view of the available data suggesting a role for TIF1γ in inhibiting epithelial to mesenchymal transi-tion (EMT) through repression of SMAD4 activity and hence interfering with tumor progression and metastasis [11]. This tumor inhibitory role was also observed against murine and human tumors including pancreatic, hepato-cellular carcinomas and leukemia [14–16]. However, our findings are in agreement with the observation by Jain et al. that overexpression of TIF1γ was associated with colorectal cancer incidence and poor prognosis [17].
204 181 151 110 22 14 9 8 204 180 148 108 22 13 9 8 204 182 151 111 22 16 11 10 A B C 204 181 151 110 22 14 9 8 204 180 148 108 22 13 9 8 204 182 151 111 22 16 11 10 A B C
Fig. 5 Kaplan Meier curves showing the DMFS a, DFS b and OS c of the TGFβ1-high/TIF1γ-high patients (green) versus the rest of patient
59 52 44 30 36 29 24 19 33 32 26 23 26 19 15 9 59 51 46 31 36 28 24 18 33 32 25 21 26 19 14 8 59 52 46 33 36 34 26 20 33 32 27 23 26 20 17 10
F
E
D
C
B
A
Fig. 6 Kaplan Meier curves of DMFS a, b, DFS c, d and OS e, f curves for TIF1γ high (green) versus low expression (Dotted blue) in cases of
Regarding the value of SMAD4 expression, we did not find any correlation between SMAD4 expression and any of the clinico-pathological parameters of breast cancer. We did not find also any prognostic significance of either nuclear localization or total loss of SMAD4 expression. This may be concordant with some studies that tested the effect of SMAD4 expression in operable breast cancer [28].
On the other hand 2 important observations were found regarding SMAD4 expression. The first is the presence of a significant interaction between TIF1γ and SMAD4 that alters the patients’ outcome regarding distant metastases and overall survival. We have shown that TIF1γ predicts poor outcome of breast cancer patients only in cases with SMAD4 loss, while in breast cancer patients whose tumors expressed SMAD4 no difference in survival was detected. The idea of combining SMAD4 loss with other biomarkers expression was tack-led in a study by De Kruijf et al. combining SMAD4 loss with the expression of TGFβ type I & II receptors that could identify a subgroup of stage I to III breast cancer carrying the poorest outcome [29].
The second observation was the strong association between SMAD4 expression and the pattern of relapse of breast cancer. Almost all patients with only bone metastasis expressed SMAD4 either in the cytoplasm or the nucleus. Such observation are in accordance with previous studies, in xenograft models and cell lines, showing that SMAD4 signaling is needed for the formation of osteolytic bone metastases, an observation that was confirmed by the knockdown of SMAD4 in breast cancer cells which could protect against bone metastasis in nude mice with significantly increasing metastasis free survival [30, 31].
Surprisingly, we found a poor outcome in patients with co-expression of TIF1γ with either TGFβ1 high or SMAD4 low. A possible hypothesis is that TIF1γ competes with SMAD4 turning off the SMAD4 dependent TGFβ signaling. Such dual effect of the TGF-β signaling might be influenced by the varying TIF1γ/Smad4 ratios resulting in the modulation of the transcriptional signal induced by TGFβ as suggested by Andrieux et al. [32]. We cannot also exclude that tumor-cell-derived TGFβ acts on the surrounding tissue in a paracrine manner instead of an autocrine signaling in the tumor cells themselves. Interactions between tumor cells and cancer-associated fibroblasts (CAFs) in the tumor microenvironment significantly influence cancer growth and metastasis, and TGFβ is known to be crit-ical for CAF activation and elaboration of a pro-tumorigenic microenvironment [6].
Our work, however is limited by its retrospective nature, the use of TMA sections that bear only cores of the whole tumor, the absence of a validation of our results in an
independent cohort (preferably in multiple centers) in addition to the heterogeneity of the patient cohort regarding the adjuvant treatment received which may bias the results. Larger prospective biomarker-oriented studies are needed to further clarify the missing pieces of the TGF pathway story.
Conclusion
Our present work clearly concludes that there is a cross-talk between the TIF1γ and the TGFβ1/SMAD4 pathway that can predict poorer outcome in operable breast cancer patients. Such prediction of poor outcome was more evi-dent in tumors with higher stages. We could also conclude that the value of TGFβ1, SMAD4 and TIF1γ expression in breast cancer should not be considered individually but in-stead combined to serve as an effective prognostic tool for breast cancer. The value of such information is of utmost importance with the introduction of new targeted agents against the TGFβ axis [33–35]. The upcoming trials test-ing those agents in breast cancer represent a golden op-portunity for clearly understanding the impact of this pathway on the disease outcome in addition to finding biomarkers that could predict benefit of such drugs.
Additional file
Additional file 1: Table S1. Clinicopathological characteristics and biomarker expression in the tested patients’ population (248 patients). Table S2: Absence of correlations between expression of TGFβ1, TIF1Ɣ, cytoplasmic and nuclear SMAD4. *Correlations tested by Pearson’s Chi square test. Figure S1: A flowchart of the whole population and subsets tested for different biomarkers.
Competing interests
TB is in the advisory board for Novartis and Roche. He also received research grants from Novartis and Roche and speaker fees from Novartis.
Authors’ contributions
LK, IT and RR conceived the study. LK, EL, SC performed the statistical analysis. LK and RR wrote the manuscript with the help of JL, GG and IT. MD, LF, JL and TG carried out IHC analysis. IT reviewed the diagnosis of all tumor samples. NCa, NCh, TB and GG participated in the design of the study and helped to draft the manuscript. All authors read and approved the final manuscript. Acknowledgments
This work was supported by grants from INSERM; CNRS; the Ligue Nationale contre le Cancer (Savoie; grant to RR) and Fondation ARC (Association pour la Recherche sur le Cancer; grant to RR). LK received a research grant from Novartis oncology. LF was supported by fellowships from MESR (Ministere de
l’Enseignement Superieur et de la Recherche) and next from Fondation ARC.
MD is supported by fellowships from the Ligue Nationale contre le Cancer. Author details
1
Clinical Oncology Department, Faculty of medicine, Cairo University, Cairo, Egypt.2U1052 Inserm, UMR CNRS 5286. Université de Lyon, Centre de
Recherche en Cancérologie de Lyon, Centre Léon Bérard, Lyon, France.
3Biostatistics Unit, Centre Léon Bérard, Lyon, France.4Department of surgery,
Centre Léon Bérard, Lyon, France.5Department of medical oncology, Centre Léon Bérard, Lyon, France.6Department of pathology, Centre Léon Bérard,
Lyon, France.
References
1. Wakefield LM, Piek E, Bottinger EP. TGF-beta signaling in mammary gland development and tumorigenesis. J Mammary Gland Biol Neoplasia. 2001;6(1):67–82.
2. Bierie B, Gorska AE, Stover DG, Moses HL. TGF-beta promotes cell death and suppresses lactation during the second stage of mammary involution. J Cell Physiol. 2009;219(1):57–68.
3. Forrester E, Chytil A, Bierie B, Aakre M, Gorska AE, Sharif-Afshar AR, et al. Effect of conditional knockout of the type II TGF-beta receptor gene in mammary epithelia on mammary gland development and polyomavirus middle T antigen induced tumor formation and metastasis. Cancer Res. 2005;65(6):2296–302.
4. Massague J. TGFbeta in cancer. Cell. 2008;134(2):215–30.
5. Wakefield LM, Roberts AB. TGF-beta signaling: positive and negative effects on tumorigenesis. Curr Opin Gene Dev. 2002;12(1):22–9.
6. Bierie B, Moses HL. Tumour microenvironment: TGFbeta: the molecular
Jekyll and Hyde of cancer. Nat Rev Cancer. 2006;6(7):506–20.
7. Heldin CH, Moustakas A. Role of Smads in TGFbeta signaling. Cell Tissue Res. 2012;347(1):21–36.
8. Moustakas A, Heldin CH. Non-Smad TGF-beta signals. J Cell Sci. 2005;118(Pt 16):3573–84.
9. Massague J, Xi Q. TGF-beta control of stem cell differentiation genes. FEBS Lett. 2012;586(14):1953–8.
10. Dupont S, Inui M, Newfeld SJ. Regulation of TGF-beta signal transduction by mono- and deubiquitylation of Smads. FEBS Lett. 2012;586(14):1913–20. 11. Hesling C, Fattet L, Teyre G, Jury D, Gonzalo P, Lopez J, et al. Antagonistic
regulation of EMT by TIF1gamma and Smad4 in mammary epithelial cells. EMBO Rep. 2011;12(7):665–72.
12. Fattet L, Ay AS, Bonneau B, Jallades L, Mikaelian I, Treilleux I, et al. TIF1gamma requires sumoylation to exert its repressive activity on TGFbeta signaling. J Cell Sci. 2013;126(Pt 16):3713–23.
13. Hesling C, Lopez J, Fattet L, Gonzalo P, Treilleux I, Blanchard D, et al. Tif1gamma is essential for the terminal differentiation of mammary alveolar epithelial cells and for lactation through SMAD4 inhibition. Dev
(Cambridge England). 2013;140(1):167–75.
14. Vincent DF, Yan KP, Treilleux I, Gay F, Arfi V, Kaniewski B, et al. Inactivation of TIF1gamma cooperates with Kras to induce cystic tumors of the pancreas. PLoS Genet. 2009;5(7):e1000575.
15. Aucagne R, Droin N, Paggetti J, Lagrange B, Largeot A, Hammann A, et al. Transcription intermediary factor 1gamma is a tumor suppressor in mouse and human chronic myelomonocytic leukemia. J Clin Invest.
2011;121(6):2361–70.
16. Herquel B, Ouararhni K, Khetchoumian K, Ignat M, Teletin M, Mark M, et al. Transcription cofactors TRIM24, TRIM28, and TRIM33 associate to form regulatory complexes that suppress murine hepatocellular carcinoma. Proc Natl Acad Sci U S A. 2011;108(20):8212–7.
17. Jain S, Singhal S, Francis F, Hajdu C, Wang JH, Suriawinata A, et al. Association of overexpression of TIF1gamma with colorectal carcinogenesis and advanced colorectal adenocarcinoma. World J Gastroenterol WJG. 2011;17(35):3994–4000.
18. Paiva CE, Drigo SA, Rosa FE, Moraes Neto FA, Caldeira JR, Soares FA, et al. Absence of transforming growth factor-beta type II receptor is associated with poorer prognosis in HER2-negative breast tumours. Ann Oncol Off J Eur Soc Med Oncol / ESMO. 2010;21(4):734–40.
19. Panis C, Herrera AC, Victorino VJ, Aranome AM, Cecchini R. Screening of circulating TGF-beta levels and its clinicopathological significance in human breast cancer. Anticancer Res. 2013;33(2):737–42.
20. Koumoundourou D, Kassimatis T, Zolota V, Tzorakoeleftherakis E, Ravazoula P, Vassiliou V, et al. Prognostic significance of TGFbeta-1 and pSmad2/3 in breast cancer patients with T1–2, N0 tumours. Anticancer Res. 2007;27(4c):2613–20.
21. Desruisseau S, Palmari J, Giusti C, Romain S, Martin PM, Berthois Y. Determination of TGFbeta1 protein level in human primary breast cancers and its relationship with survival. Br J Cancer. 2006;94(2):239–46.
22. Richardsen E, Uglehus RD, Johnsen SH, Busund LT. Immunohistochemical
expression of epithelial and stromal immunomodulatory signalling molecules is a prognostic indicator in breast cancer. BMC Res Notes. 2012;5:110.
23. McShane LM, Altman DG, Sauerbrei W, Taube SE, Gion M, Clark GM. REporting recommendations for tumor MARKer prognostic studies (REMARK). Breast Cancer Res Treat. 2006;100(2):229–35.
24. Allred DC, Bustamante MA, Daniel CO, Gaskill HV, Cruz Jr AB. Immunocytochemical analysis of estrogen receptors in human breast carcinomas. Evaluation of 130 cases and review of the literature regarding concordance with biochemical assay and clinical relevance. Arch Surgery (Chicago, Ill: 1960). 1990;125(1):107–13.
25. Kaplan EM P. Nonparametric estimation from incomplete observations. J Am Stat Assoc. 1958;53(282):457–81.
26. Cox DR. Regression models and life-tables. J R Stat Soc B. 1972;34(2):187–220. 27. Bierie B, Moses HL. Gain or loss of TGFbeta signaling in mammary
carcinoma cells can promote metastasis. Cell Cycle (Georgetown Tex). 2009;8(20):3319–27.
28. Xie W, Mertens JC, Reiss DJ, Rimm DL, Camp RL, Haffty BG, et al. Alterations of Smad signaling in human breast carcinoma are associated with poor outcome: a tissue microarray study. Cancer Res. 2002;62(2):497–505. 29. de Kruijf EM, Dekker TJ, Hawinkels LJ, Putter H, Smit VT, Kroep JR, et al. The
prognostic role of TGF-beta signaling pathway in breast cancer patients. Ann Oncol Off J Eur Soc Med Oncol / ESMO. 2013;24(2):384–90.
30. Kang Y, He W, Tulley S, Gupta GP, Serganova I, Chen CR, et al. Breast cancer bone metastasis mediated by the Smad tumor suppressor pathway. Proc Natl Acad Sci U S A. 2005;102(39):13909–14.
31. Deckers M, van Dinther M, Buijs J, Que I, Lowik C, van der Pluijm G, et al. The tumor suppressor Smad4 is required for transforming growth factor beta-induced epithelial to mesenchymal transition and bone metastasis of breast cancer cells. Cancer Res. 2006;66(4):2202–9.
32. Andrieux G, Fattet L, Le Borgne M, Rimokh R, Théret N. Dynamic regulation of Tgf-B signaling by Tif1γ: a computational approach. PLoS One. 2012;7(3):e33761.
33. Hawinkels LJ, Ten Dijke P. Exploring anti-TGF-beta therapies in cancer and fibrosis. Growth Factors (Chur, Switzerland). 2011;29(4):140–52.
34. Connolly EC, Saunier EF, Quigley D, Luu MT, De Sapio A, Hann B, et al. Outgrowth of drug-resistant carcinomas expressing markers of tumor aggression after long-term TbetaRI/II kinase inhibition with LY2109761. Cancer Res. 2011;71(6):2339–49.
35. Heldin CH, Vanlandewijck M, Moustakas A. Regulation of EMT by TGFbeta in cancer. FEBS Lett. 2012;586(14):1959–70.
Submit your next manuscript to BioMed Central and take full advantage of:
• Convenient online submission
• Thorough peer review
• No space constraints or color figure charges
• Immediate publication on acceptance
• Inclusion in PubMed, CAS, Scopus and Google Scholar
• Research which is freely available for redistribution
Submit your manuscript at www.biomedcentral.com/submit