HAL Id: hal-03000701
https://hal.archives-ouvertes.fr/hal-03000701
Submitted on 16 Nov 2020
HAL is a multi-disciplinary open access archive for the deposit and dissemination of sci-entific research documents, whether they are pub-lished or not. The documents may come from teaching and research institutions in France or abroad, or from public or private research centers.
L’archive ouverte pluridisciplinaire HAL, est destinée au dépôt et à la diffusion de documents scientifiques de niveau recherche, publiés ou non, émanant des établissements d’enseignement et de recherche français ou étrangers, des laboratoires publics ou privés.
Distributed under a Creative Commons Attribution - NonCommercial| 4.0 International License
Colon-specific immune microenvironment regulates
cancer progression versus rejection
Giulia Trimaglio, Anne-Françoise Tilkin-Mariamé, Virginie Feliu, Françoise
Lauzéral-Vizcaino, Marie Tosolini, Carine Valle, Maha Ayyoub, Olivier
Neyrolles, Nathalie Vergnolle, Yoann Rombouts, et al.
To cite this version:
Giulia Trimaglio, Anne-Françoise Tilkin-Mariamé, Virginie Feliu, Françoise Lauzéral-Vizcaino, Marie Tosolini, et al.. Colon-specific immune microenvironment regulates cancer progression versus rejection. OncoImmunology, Taylor & Francis, 2020, 9 (1), pp.1-12. �10.1080/2162402X.2020.1790125�. �hal-03000701�
Full Terms & Conditions of access and use can be found at
https://www.tandfonline.com/action/journalInformation?journalCode=koni20
OncoImmunology
ISSN: (Print) (Online) Journal homepage: https://www.tandfonline.com/loi/koni20
Colon-specific immune microenvironment
regulates cancer progression versus rejection
Giulia Trimaglio , Anne-Françoise Tilkin-Mariamé , Virginie Feliu , Françoise
Lauzéral-Vizcaino , Marie Tosolini , Carine Valle , Maha Ayyoub , Olivier
Neyrolles , Nathalie Vergnolle , Yoann Rombouts & Christel Devaud
To cite this article: Giulia Trimaglio , Anne-Françoise Tilkin-Mariamé , Virginie Feliu , Françoise Lauzéral-Vizcaino , Marie Tosolini , Carine Valle , Maha Ayyoub , Olivier Neyrolles , Nathalie Vergnolle , Yoann Rombouts & Christel Devaud (2020) Colon-specific immune microenvironment regulates cancer progression versus rejection, OncoImmunology, 9:1, 1790125, DOI:
10.1080/2162402X.2020.1790125
To link to this article: https://doi.org/10.1080/2162402X.2020.1790125
© 2020 The Author(s). Published with
license by Taylor & Francis Group, LLC. View supplementary material Published online: 12 Jul 2020. Submit your article to this journal
Article views: 421 View related articles
ORIGINAL RESEARCH
Colon-specific immune microenvironment regulates cancer progression versus
rejection
Giulia Trimaglioa*, Anne-Françoise Tilkin-Mariaméb*, Virginie Feliuc,d, Françoise Lauzéral-Vizcainod,e, Marie Tosolini c,
Carine Vallec, Maha Ayyoubc,d,e, Olivier Neyrollesa, Nathalie Vergnolleb, Yoann Romboutsa, and Christel Devaud b
aInstitut De Pharmacologie Et De Biologie Structurale (IPBS), Université De Toulouse, CNRS, UPS, Toulouse, France; bINSERM (U1220), INRA, ENVT, UPS,
Institut De Recherche En Santé Digestive (IRSD), Toulouse, France; cCentre De Recherches En Cancérologie De Toulouse (CRCT), INSERM U1037,
Toulouse, France; dImmune Monitoring Core Facility, Institut Universitaire Du Cancer (IUCT)- Oncopôle, Toulouse, France; eUniversité Toulouse III Paul
Sabatier, Toulouse, France ABSTRACT
Immunotherapies have achieved clinical benefit in many types of cancer but remain limited to a subset of patients in colorectal cancer (CRC). Resistance to immunotherapy can be attributed in part to tissue- specific factors constraining antitumor immunity. Thus, a better understanding of how the colon micro-environment shapes the immune response to CRC is needed to identify mechanisms of resistance to immunotherapies and guide the development of novel therapeutics.
In an orthotopic mouse model of MC38-CRC, tumor progression was monitored by bioluminescence imaging and the immune signatures were assessed at a transcriptional level using NanoString and at a cellular level by flow cytometry. Despite initial tumor growth in all mice, only 25% to 35% of mice developed a progressive lethal CRC while the remaining animals spontaneously rejected their solid tumor. No tumor rejection was observed in the absence of adaptive immunity, nor when MC38 cells were injected in non-orthotopic locations, subcutaneously or into the liver. We observed that progressive CRC tumors exhibited a protumor immune response, characterized by a regulatory T-lymphocyte pattern, discernible shortly post-tumor implantation, as well as suppressive myeloid cells. In contrast, tumor-rejecting mice presented an early inflammatory response and an antitumor microenvironment enriched in CD8+ T cells.
Taken together, our data demonstrate the role of the colon microenvironment in regulating the balance between anti or protumor immune responses. While emphasizing the relevance of the CRC orthotopic model, they set the basis for exploring the impact of the identified signatures in colon cancer response to immunotherapy. ARTICLE HISTORY Received 31 January 2020 Revised 7 June 2020 Accepted 25 June 2020 KEYWORDS
Colorectal cancer; immune response polarization; orthotopic model
Introduction
Tumor-infiltrating innate and adaptive immune cells play a dual role in cancer development1. In a first phase called “elimination,” immune cells can recognize and kill recently transformed malig-nant cells. During a second “equilibrium” phase, the rare tumor variants that have survived the elimination can enter a non- growing dormant state that can last for long periods of time.2 Finally, in a third “escape” phase, tumor cells exit dormancy and proliferate again with the help of the immunosuppressive microenvironment.2 The antitumor immune response predomi-nantly relies on tumor antigen-specific effector CD8+ T lymphocytes and other lymphoid cell subsets, while the pro-tumor axis mainly involves immunosuppressive regulatory T cells (Treg), myeloid-derived suppressor cells (MDSC) and anti-inflammatory type 2 macrophages (M2)1. In this context, therapies that harness and enhance antitumor effector cells, such as immune checkpoint blockade therapies, have led to clinical benefit in several malignancies including melanoma, non-small cell lung cancer, and renal cell carcinoma.3
While CRC remains the third most prevalent cause of can-cer-related deaths worldwide,4 the current success of immu-notherapy is limited to ~5% of all CRC patients.3,5 Patients responding to immunotherapy exhibit a defective DNA mis-match repair system (MMR)/microsatellite Instability-High (MSI) CRC phenotype that may have higher immunological potential.6,7 More recently, it has been demonstrated that the type, location, and density of adaptive immune cells present in the tumor microenvironment, called Immunoscore, represent an independent prognostic factor for CRC patients, regardless of MSI phenotype.7–9 While it is well established that tumor- intrinsic features control the immune response to cancer, we and others have demonstrated the contribution that host tis-sue-specific factors make to modulating tumor growth and immunity, as well as to response to immunotherapy.10,11 For instance, using orthotopic mouse models, we have previously shown that kidney and CRC tumors respond poorly to immu-notherapy compared to subcutaneous tumors due to organ- specific differences in tumor immune microenvironments.10 Therefore, a better characterization of the tumor-related
CONTACT Christel Devaud christel.devaud@inserm.fr Institut De Recherche En Santé Digestive (IRSD), CHU Purpan BP3028, INSERM U1220 , Toulouse 31024, France
*These authors are contributed equally to this work
Supplemental data for this article can be accessed on the publisher’s website. ONCOIMMUNOLOGY
2020, VOL. 9, NO. 1, 1–13
https://doi.org/10.1080/2162402X.2020.1790125
© 2020 The Author(s). Published with license by Taylor & Francis Group, LLC.
This is an Open Access article distributed under the terms of the Creative Commons Attribution-NonCommercial License (http://creativecommons.org/licenses/by-nc/4.0/), which permits unrestricted non-commercial use, distribution, and reproduction in any medium, provided the original work is properly cited.
immune response in an organ-specific manner could be instru-mental for guiding the development of future therapeutics.
Orthotopic xenograft models of CRC established in highly immunocompromised mice recapitulate many features of human pathology and have helped to elucidate several molecular mechanisms involved in CRC progression.12–14 Nonetheless, human CRC cells xenografted in immunodeficient mice are not exposed to an immune response, which limits their relevance in terms of clinical translation.15 Therefore, in vivo syngeneic orthotopic models are needed to understand the impact of the local immune response during CRC development. Orthotopic implantation refers to the grafting of cells in their original loca-tion, thus favoring the generation of an appropriate tumor microenvironment. Transplantation models also allow synchro-nous growth of implanted tumors in all mice, among other advantages.
In order to study the impact of colon location and the involve-ment of the immune microenvironinvolve-ment in tumor developinvolve-ment, we relied on a pre-clinical immunocompetent orthotopic CRC mouse model. In this model, we used the C57BL/6 (B6)- background MC38 murine CRC cell line,16 recently characterized as a model for hypermutated/MSI CRC,17 that has been genetically engineered to express firefly Luciferase (MC38-fLuc). MC38-fLuc cells were implanted into the cecum (IC) of immunocompetent B6 mice, which allowed us to follow tumor development over time using a bioluminescence camera as well as the dynamic of tumor- infiltrating immune cells by flow cytometry and transcriptomic analyses. Within 2 days, the MC38-fLuc cells developed a growing tumor mass in the colon of all mice, thereby confirming their tumor-forming capacity. Nonetheless, from day 10 onward, we observed two patterns of CRC development in mice with either large lethal colonic tumors and associated metastases (progressive CRC), or spontaneous rejection of tumors (rejecting CRC). This dichotomy in cancer development is colon-specific and associated with a protumor polarization of the immune response in progres-sive CRC mice and with an antitumor immune microenvironment in rejecting CRC mice. In addition, transcriptomic analysis of CRC tumors at day 3 post-implantation revealed that the two develop-mental profiles of CRC might be dictated by early immune events.
Results
Colon orthotopic implantation leads to two cancer development profiles
To study the impact of the immune microenvironment on the development of colorectal tumors, we used an orthotopic CRC syngeneic mouse model. Using a microsurgery approach (Supplementary Fig. S1a), syngeneic colon tumor cells were implanted into the colon (IC) of BALB/c and B6 mice. Following IC injection of CT26 tumor cells, all BALB/c mice developed lethal CRC (Supplementary Fig. S1b), in accordance with our previous study.10 In contrast, following IC implanta-tion of MC38-fLuc tumor cells, two out of five B6 mice sur-vived (Supplementary Fig. S1b). Since all B6 mice had a CRC tumor at day 6 (Supplementary Fig. S1c), we hypothesized that the higher survival rate of B6 mice was due to spontaneous rejection of the tumor. To test this hypothesis, we monitored
in vivo growth of CRC tumors in B6 mice (Table 1, n = 110) by
measuring the bioluminescence emitted by MC38-fLuc cells over time. We previously demonstrated in several orthotopic tumor models that tumor size positively correlates with the bioluminescence of luciferase-transduced tumor cells.10,12 On days 3 to 6 following IC injection of MC38-fLuc cells, we again found that 100% of B6 mice exhibited solid tumors of compar-able size (Figure 1), thereby confirming efficient orthotopic tumor implantation and initial tumor growth in all mice. However, starting from day 10 after tumor implantation, ~29% of mice developed progressive invasive lethal CRC (pro-gressive group), while ~71% of mice spontaneously rejected the CRC tumors and survived more than 100 days (rejecting group) (Figure 1, Table 1). Accordingly, macroscopic tumors observed in mice with progressive CRC were no longer visible on the cecum of rejecting CRC mice (Figure 1(c)). We also noticed the presence of mesenteric lymph node tumor disse-mination (Supplementary Fig. S1d) in mice with progressive CRC. Altogether, our results showed that despite the initial growth of MC38-fLuc tumors in the cecum of all B6 mice, nearly three quarters of them spontaneously rejected the tumor and one quarter of the animals developed progressive, invasive, and lethal CRC.
In rejecting mice tumor cells do not survive in a dormant state but are rather eliminated
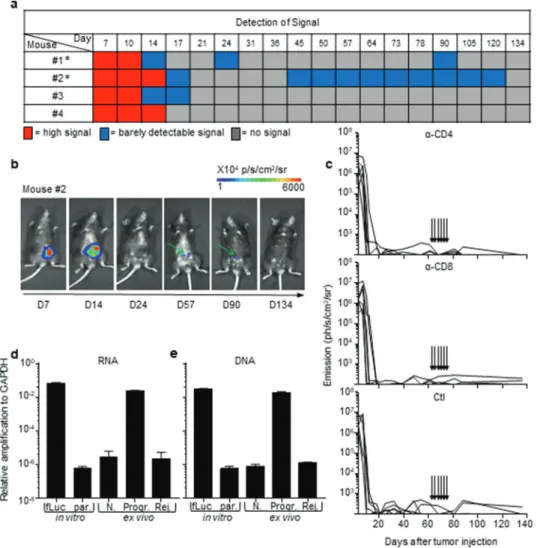
All B6 mice that rejected the CRC tumors exhibited an extinc-tion of the bioluminescent signal within 30 days, a delay after which macroscopic tumors were no longer visible. Nonetheless, during the long-term monitoring of CRC progression over a 100-day period, we sometimes detected a weak cecum- localized bioluminescent signal in ~42% (±12% in three inde-pendent experiments) of these mice (Figure 2(a,b)). As biolumi-nescence detection generally has a negligible background,18,19 we hypothesized that luciferase-expressing tumor-cell variants may have survived in a dormant state in the cecum of tumor-rejecting
Table 1. Proportion of MC38 IC-implanted mice. Experiment Total number of mice Number of progressing CRC mice Number of rejecting CRC mice #1 44 15 (34%) 29 (66%) #2 36 9 (25%) 27 (75%) #3 30 8 (27%) 22 (73%) Total 110 32 (29%) 78 (71%) Table 1: Numbers and percentages of mice exhibiting a progression or rejection
of their MC38-fLuc tumors in three independent experiments (total n = 110).
Figure 1. Two profiles of CRC development in immunocompetent B6 mice. a, b. Bioluminescence emission monitoring (a) and image of one representative mouse per group (b) from progressive (Progr.) and rejecting (Rej.) CRC groups following IC-injection with 1 × 10⁶ MC38-fLuc cells. (Average ±SEM, n = 36 mice,
represen-tative experiment of 3). c: Ex vivo photograph (upper panel) and corresponding bioluminescent image (bottom panel) of representative caecums from day D8 and D32 MC38-fLuc IC-implanted mice. Arrows indicate tumors on the cecum. *P < 0.05, ****P < 0'.0001
mice.20 Adaptive immune cells, in particular CD4+ and CD8+ T-lymphocytes, are essential for the establishment and mainte-nance of tumor dormancy.21 Depletion of T lymphocytes during tumor dormancy has been shown to promote tumor regrowth.21 Thus, in order to evaluate whether tumor cells in tumor- rejecting mice were dormant, we depleted CD8+ and CD4+ T-lymphocytes by repeated intraperitoneal injections of anti- CD8 and anti-CD4 antibodies. Despite an effective depletion of CD8+ (13% to 3.4% following depletion, P < .05) and CD4+ (18% to 4.7% following depletion, P < .005) T cells (Supplementary Fig. S2a and S2b), we did not observe any tumor relapse in these mice (Figure 2(c)), suggesting that tumor elimination had occurred. To confirm the elimination of CRC tumors, we mea-sured the presence of luciferase transcripts in colon fragments using qPCR (Supplementary Fig. S2 c). We could detect lucifer-ase-expressing tumor cells in the colons of progressive tumor- bearing mice but not in those of CRC-rejecting mice (Figure 2 (d)). In addition, luciferase-genomic qPCR (Supplementary Fig.
S2d) confirmed the absence of residual MC38-fLuc cells that may have switched off luciferase gene expression during dor-mancy (Figure 2(e)). Together, these data demonstrate that following initial CRC tumor growth, the group of tumor- rejecting mice spontaneously eliminated MC38-fLuc cancer cells.
CRC fates are specific to the colon immune microenvironment
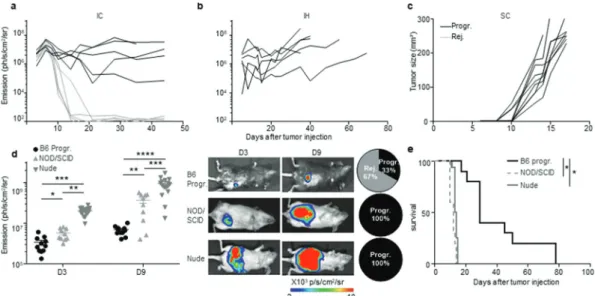
In order to increase the frequency of progressive CRC-mice, we increased by three folds the number of injected MC38-fLuc cells. Following injection, 50% of the mice still rejected their CRC, demonstrating that the dose of injected cells does not fully explain the two distinct CRC development profiles (Figure 3(a)). Besides, both CRC developmental profiles were observed after IC implan-tation of parental MC38 cells (Supplementary Fig. S2e), indicating
Figure 2. Rejection of MC38-fLuc tumors leads to elimination. (a) Bioluminescent signals of 4 representative mice from the rejecting CRC group following IC- implantation of 1 × 10⁶ MC38-fLuc cells. Mice with * exhibit possible dormancy (n = 42% of rejecting CRC group, of the three independent experiments displayed in
Table 1, n = 32 mice). (b) Bioluminescent images of a representative mouse (#2 from a) possibly exhibiting dormant tumor cells at various time points. Green arrows indicate the weak signal detected at day (D) 57 and 90. (c) Bioluminescence emission monitoring in mice from the CRC-rejecting group (following D0 IC injection of 1 × 10⁶ MC38-fLuc), depleted through injection (indicated by arrows) of anti(α)-CD4 antibody (Ab) (upper panel, n = 6 mice), α-CD8 Ab (middle panel, n = 6 mice) or control (Ctl, bottom panel, n = 5 mice). (d, e) Relative expression of RNA following RTPCR and qPCR (RNA, d) and amplification of genomic DNA following qPCR (DNA, e) in colons dissected from rejecting-CRC mice (Rej.) ex vivo n = 13 mice with n = 6 mice at D84 and n = 7 mice at D194 post-IC MC38-fLuc tumor implantation. Controls (ctl) are represented by in vitro tissue-culture MC38-fLuc (fLuc, positive ctl) and parental (par., negative ctl) cells, ex vivo naïve cecum (N., negative ctl) and D61 IC-tumor bearing mice from progressive-CRC group (Progr., positive ctl) (n = 2 to 4 mice). According to negative controls, values below 10–6 are considered background. The relative amplification was normalized to the amplification level of GAPDH.
that spontaneous CRC rejection is not related to the potential immunogenicity of luciferase in MC38-fLuc cells. In addition, no tumor rejection was observed after injection of MC38-fLuc cells in another anatomical (non-orthotopic) location in the mice, such as in the liver (IH, Figure 3(b)) or subcutaneously (SC, Figure 3(c)). We then evaluated the contribution of the immune response to CRC tumors rejection by injecting MC38-fLuc cells into the cecum of fully immunodeficient NOD/SCID mice. We observed that all mice developed lethal CRC, characterized by larger tumors than those observed in immunocompetent B6 mice (average emission 6,9x10⁷ (NOD/SCID) versus (vs) 2,9x10⁶ (B6) ph/s/cm2/sr at day 9, P < .0001, Figure 3(d, e)). Accordingly, NOD/SCID mice died more rapidly following tumor implantation (before day 15) than B6 animals, and never rejected CRC tumors (Figure 3(e)), under-lining the importance of the immune response in CRC outcome. We performed a similar experiment in nude mice, which only lack adaptive immunity. After tumor implantation, nude mice devel-oped lethal CRC and died within 15 days (Figure 3(d, e)), con-firming the key contribution of the adaptive immune response to tumor rejection. Nude mice developed larger tumors than pro-gressive-B6 and NOD/SCID mice (nude average emission 4,7 x10⁸ ph/s/cm2/sr at day 9, Figure 3(d)), suggesting that the innate immune response may facilitate CRC tumor progression. Taken together, these data demonstrated that the colon-specific immune microenvironment is responsible for tumor rejection in the major-ity of B6 mice. We next asked whether this immune microenvir-onment may have led to an in vivo selection of “immune-resistant progressive” tumor cell clones able to resist to antitumor immune response in the CRC-progressive mice vs. immune-sensitive tumor cell clones in the CRC-rejecting mice. To address this question, we harvested and cultured MC38-fLuc tumor cells from both groups of mice (progressive and rejecting groups of MC38-fLuc IC-injected B6 donor-mice) at day 14 after the initial tumor implantation and re-implanted them IC in recipient naïve
B6 mice (Supplementary Fig. S3a). Importantly, we previously demonstrated that in vitro tissue culture, even for a three-week period, poorly alters the phenotype of harvested-tumor cells.10 Re- implantation of MC38-fLuc derived from both CRC-progressive and CRC-rejecting donor-mice led each to the development of two CRC profiles in naïve recipient mice (progressive (Progr.) and rejecting (Rej.) CRC recipient mice, Supplementary Fig. S3b), indicating that in vivo clonal selection is not the main determinant regulating progression or rejection of tumor cells in our model.
Tumor fates correlate with suppressor/effector immune microenvironments
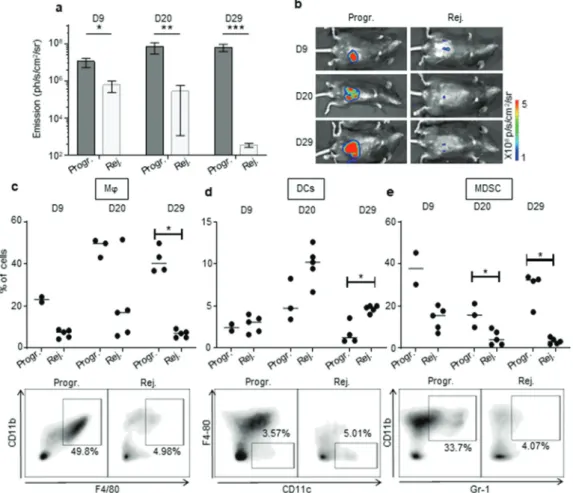
In order to investigate the immune microenvironment of tumors from the two CRC profile groups, we used flow cytometry to examine the phenotype and frequency of infiltrating leukocytes in primary colon tumors of CRC-rejecting vs. CRC-progressive mice at 9, 20 and 29 days post-tumor implantation (Figure 4(a,b)). As the “group separation” is not fully resolved at day 9 (Figure 1(a)), we measured decrease or increase in colon tumor size compared to day 6 (using bioluminescence) to differentiate the mice belong-ing to CRC-rejectbelong-ing or CRC-progressive groups.
Within the myeloid cell compartment, we observed increased infiltration of F4/80+/CD11b+ macrophages in tumors of CRC- progressive mice compared to CRC-rejecting animals (Figure 4(c), Supplementary Fig. S4a). Macrophages infiltrating advanced tumors are known to exert mainly immunosuppressive functions, in particular when polarized toward an anti-inflammatory type-2 macrophage (M2) phenotype.22 While tumor-infiltrating macro-phages from progressive CRC mice expressed low levels of the M2- related marker CD20622 on day 9 post-tumor implantation, these levels were significantly higher than in rejecting mice CRC tumors. CD206 expression increased substantially by days 20 and 29 although there was no longer a significant difference between the
Figure 3. An immune-colon dependent effect generates the two CRC development profiles. a to c. Mice were injected with MC38-fLuc cells in various location: intra- colon (IC) (a), intra-hepatic (IH) (b) and subcutaneously (SC) (c). Tumor growth monitoring through bioluminescence emission imaging (a, b) and caliper measurement (c) of 3 × 10⁶ IC-injected MC38-fLuc cells (n = 10 mice) (a) 2,5x10⁵ IH-injected MC38-fLuc cells (n = 6 mice) (b) and 3 × 10⁶ SC-injected MC38-fLuc cells (n = 9 mice). d, e:
Bioluminescence emission imaging (Average±SEM) (d) and survival (e) of 1 × 10⁶ MC38-fLuc IC-injected in B6 mice (depicted only from progressive (B6 Progr.) CRC
group, n = 10 mice), NOD/SCID mice (n = 10 mice) and nude mice (n = 16 mice). (d) Graph of bioluminescent emission (left panel, B6 only from Progr. group), representative photos of one mouse per group (middle panels, from B6 Progr. group, NOD/SCID, and nude) at day (D)3 and D9 and proportion of progressive (Progr.) and rejecting (Rej.) CRC B6, NOD/SCID or nude mice (right panels). *P < 0.05, **P < 0.005; ***P < 0.0005, ****P < 0.0001.
two CRC profiles (Supplementary Fig. S5a). In addition, high levels of the type-1 (pro-inflammatory) macrophage (M1) related marker CD8022 were detected on macrophages from progressive CRC tumors (Supplementary Fig. S5 c), implying that the CD206 and CD80 markers may not be sufficient or appropriate markers to discriminate M2 and M1 polarization status in murine colon tumors. Tumor-infiltrating macrophages from progressive CRC mice strongly expressed MHCII, CX3CR1, and to a lesser extent CD11 c, while they were negative for Ly6 C and CD103 (Supplementary Fig. S5 c). Regarding other myeloid cells, we observed a higher infiltration of total CD11 c+ dendritic cells (DC) in the rejecting group on day 29 after tumor injection but not at previous time points (Figure 4(d), Supplementary Fig. S4b). No significant difference in CD206 expression in DC between the two groups of mice (Supplementary Fig. S5b). Finally, we observed that during CRC progression, progressive tumors contained a higher infiltrate of myeloid-derived suppressor cells (MDSC), a major immunosuppressive cell subset in tumors,23 compared to rejecting tumors (Figure 4(e), Supplementary Fig. S4 c).
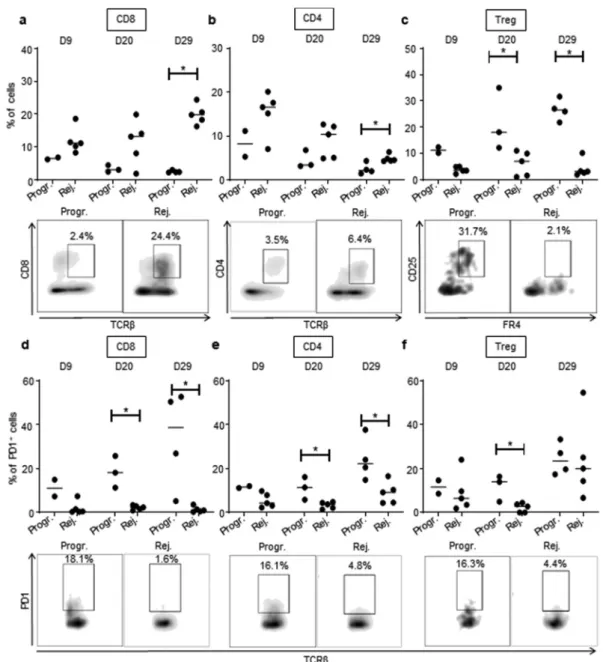
CD8+ T cells, which are involved in adaptive immune responses, highly infiltrated rejecting tumors. This was particu-larly noticeable at day 29 (Figure 5(a), Supplementary Fig. S4d). CD8+ T cells infiltrating progressive tumors expressed signifi-cantly higher levels of the immunosuppressive checkpoint PD-1
(Figure 5(d), Supplementary Fig. S4 g). PD-1 expression was also increased on the surface of CD4+ T cells that infiltrated progres-sive tumors (Figure 5(e), Supplementary Fig. S4 h), suggesting a stronger exhaustion status of both CD4 and CD8 T-cell popula-tions in progressive compared to rejecting CRCs. Although the total CD4 T-cell infiltrate was globally comparable in the two tumor profiles (Figure 5(b), Supplementary Fig. S4e), we found a significant increase in the percentage of regulatory CD4+ T cells (Treg) during tumor development in progressive compared to rejecting colon tumors (Figure 5(c), Supplementary Fig. S4 f). We also observed that at day 20, Treg cells from progressive tumors expressed high levels of PD-1 (Figure 5(f), Supplementary Fig. S4i). Taken together, these results demonstrate that our orthotro-pic CRC tumor model exhibits two of CRC-targeted immune responses, cancer repressing, and cancer promoting. The immune microenvironment of the tumors appears to be biased toward the antitumor axis of the immune response in the rejecting CRC mice,
vs. the protumor axis in the progressive CRC mice.
Early polarization of the colon immune microenvironment determines tumor fate
We hypothesized that early events may be responsible for the dual immune microenvironments characterizing the two opposite
Figure 4. The immunosuppressive myeloid cell-related microenvironment is characterized in progressive CRC mice. a, b. Bioluminescent emission measurement (a) and representative photo of one mouse per group used for FACS analyses (b) at day (D) 9, 20, and 29 following IC-implantation of 1 × 10⁶ MC38-fLuc cells at D0. (Average ±SEM, n = 6–7 mice, 2 pooled experiments). c to e: Quantitative data (upper panels) and D29 representative FACS dot plot analyses (lower panels) of progressive or rejecting tumors-infiltrating macrophages (Mϕ, gated as Gr1−, F4/80+, CD11b+) (c), dendritic cells (DCs, gated as Gr1−, CD11 c+, F4/80−) (d) myeloid-derived suppressor cells (MDSC, gated as Gr-1+, CD11b+) (e) at D9, 20, and 29. Each dot corresponds to a single mouse with a median from one representative experiment (Exp#1; n = 2–5
mice). Percentages are expressed on CD45.2+ live cells. *P < 0,05. Progr. = progressive CRC, Rej. = Rejecting CRC.
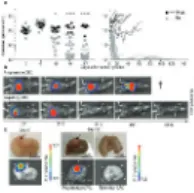
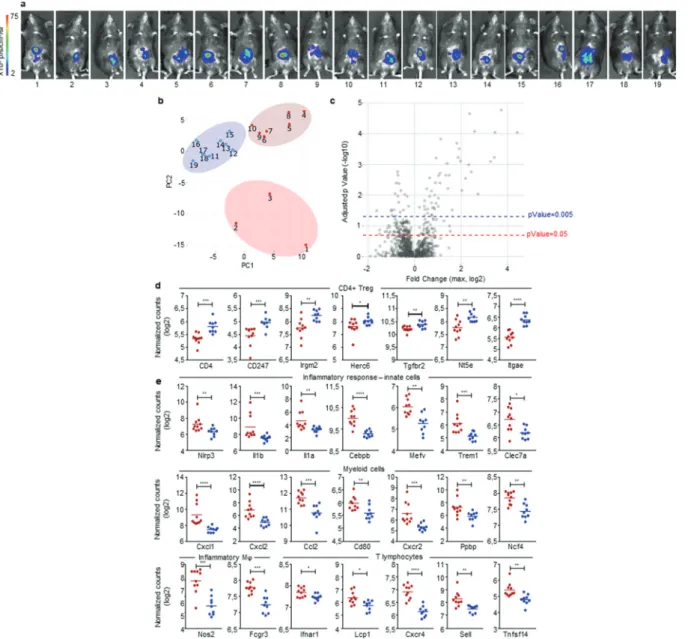
profiles of cancer development in our mouse model. To test this assumption, we implanted MC38-fLuc IC in B6 mice (n = 19), harvested solid tumors on day 3 post-implantation (Figure 6a) and measured the expression of 770 cancer-immune-related- genes, in the whole tumors, using a quantitative and multiplex method referred to as Nanostring nCounter Gene Expression Assay. Three groups of mouse tumor samples appeared on the principal component analysis (PCA) (samples 1 to 3; 4 to 10 and 11 to 19, Figure 6b). We applied a threshold based on adjusted
p-Value and the level of expression of genes included in the
Nanostring array (expressed in log2 fold change) (Figure 6c). Based on either the most significantly expressed genes (P < .005, 67 genes, Supplementary Fig. S6a) or on the significantly expressed genes (P < .05, 187 genes, Supplementary Fig. S6b and
Supplementary Table 1), we observed, on heat maps depicted on Supplementary Fig. S6, that mouse tumor samples finally clus-tered only into two distinct groups (52% dark-red group and 48% blue group represented on the heat maps). The first cluster of mouse tumors (blue group) exhibit a high expression of genes (10 out of 19 highest up-regulated genes) previously associated with Treg cells including CD4, CD247, Irgm2, Herc6, Tgfbr2, Nt5e, (Figure 6d and Supplementary Fig. S6a), Ccl17, St6gal1, Rora (Supplementary Fig. S6a), as well as Foxp3, Maf, Ccl19, Ccl21 (Supplementary Fig. S6b and Supplementary Table 1).24–27 We also found a high expression of CD103 (Itgae), a marker of gut resident T cells including Treg (Figure 6d and Supplementary Fig. S6a).26 While the Treg signature seems dominant (10 Treg-related genes out of 19 highest upregulated genes), the blue group of
Figure 5. High CD8 T cells and low Treg infiltration in rejecting CRC tumors. Quantitative data (upper panels) and D29 (a, b, c) or D20 (d, e, f) representative FACS dot plot analyses (lower panels) of tumor-infiltrating CD8+ T lymphocytes (CD8, gated as TCRβ+, CD8+) (a), CD4+ T lymphocytes (CD4, gated as TCRβ+, CD4+) (b), regulatory
T lymphocytes (Treg, gated as TCRβ+, CD4+,CD25+, folate receptor (FR)4+) (c) as well as PD1 expression on CD8+ T lymphocytes (d), CD4+ T lymphocytes (e) and
regulatory T lymphocytes (f) at 9, 20 and 29 days, as depicted, following IC-injection of 1 × 10⁶ MC38-fLuc cells. Each dot corresponds to a single mouse with a median
from one representative experiment (Exp#1; n = 2–5 mice). Percentages of CD8+ and CD4+ T cells are expressed on CD45.2+ live cells and percentage of Treg are
mouse tumors also exhibit higher expression of genes potentially related to immunosuppressive polarization and functions of mye-loid cells, such as immunosuppressive M2 and MDSC, including
Ccl17 (Supplementary Fig. S6a) Cd163, Arg2, Tgfb2, Cd36 and
Cx3cr1 (Supplementary Fig. S6b and Supplementary
Table 1).22 These signatures, together with the high expression of Lag3 suggested that tumors from the blue group are skewed toward a tolerogenic, likely protumor microenvironment (Supplementary Fig. S6b and Supplementary Table 1). In contrast, tumors belonging to the dark-red group displayed a robust pro- inflammatory signature as demonstrated by the strong expression of genes related to the inflammasome (Nlrp3, Il1b, IL1a in Figure 6e and Supplementary Fig. S6a), to inflammatory cytokines sig-naling (Il1rl1, Il1r2 in Supplementary Fig. S6a; Tnf, Il6, Il23 r in
Supplementary Fig. S6b and Supplementary Table 1) as well as to inflammation signaling (Cebpb, Mefv in Figure 6e and Supplementary Fig. S6a; Sbno2, Lyn, Ptgs2 in Supplementary Fig. S6b and Supplementary Table 1).28,29 Accordingly, we observed a high gene expression of markers related to pro-inflammatory innate immune cells including Trem1, Clec7a, Nos2, Fcgr3, Csf2rb,
CD86 (Figure 6e and Supplementary Fig. S6a) and Csf3 r, CD47,
Fcgr2b, CD87 (Supplementary Fig. S6b and Supplementary
Table 1) as well as a high expression of genes related to myeloid cells recruitment such as Cxcl1, Cxcl2, Ccl2, Selplg, Cxcl5, Ccl7,
Ccl3, Ccr1 (Figure 6e and Supplementary Fig. S6a). Most of the myeloid compartment up-regulated genes were related to mono-cyte/macrophage populations with high expression of Cd80,
VegfA (Figure 6e and Supplementary Fig. S6a), and CD14, CD68
Figure 6. Early detection of opposing immune microenvironments in CRC tumors. Nanostring analysis of CRC tumors harvested at day 3 after IC implantation of 1.106
MC38-fLuc cells in B6 mice (n = 19 mice). (a) Bioluminescent representative images at 2 days post-tumor implantation. (b) Principal component analysis (PCA) based on the Nanostring analysis results revealing three groups of mouse tumor samples. (c) The three group of mice (from PCA) were compared using ANOVA corrected multiple testing correction by the Benjamin-Hochberg (BH) methods and all fold change (FC) were calculated. Volcano plot showing the max FC computed for each gene and the corresponding adjusted p-Value. Blue-dotted line indicate threshold for adjusted p-Value = 0.2 (p-Value = 0.05) and red-dotted line indicates adjusted p-Value = 0.05 (p-Value = 0.005). (d, e) Dot plots representing the average and individual tumor expression of selected genes (normalized counts in log 2) analyzed by Nanostring technology. Dark-red and blue dots correspond to tumors belonging to the dark-red or blue groups, respectively, represented on heat maps from Supplementary Fig. S6. Selected genes highly expressed in (d) blue group (CD4+ Treg pattern) and (e) dark-red group of tumors (Inflammatory response-innate cells, myeloid cells, inflammatory macrophages (Mϕ) and T lymphocytes are depicted. *P < 0.05, **P < .005, ***P < .0005, ****P < 0.0001.
(Supplementary Fig. S6b and Supplementary Table 1) but we also detected an increased expression of neutrophil markers (Cxcr2,
Ppbp, Ncf4, Figure 6e and Supplementary Fig. S6a).30–33 In addi-tion, the increased expression of genes such as Il1b, Il1a, Nos2 (Figure 6e and Supplementary Fig. S6a) as well as Il6 and Tnf (Supplementary Fig. S6b and Supplementary Table 1), suggests an induction of antitumor M1 polarization and functions, in the dark-red group of tumors.22 Finally, in the dark-red group of tumors, we observed the upregulation of Ifnar1 gene reflecting the initiation of a cytotoxic immune response34 related to T lymphocytes and NK cells recruitment and activation (lcp1,
Cxcr4, Sell, Tnfsf14, Fcgr3 in Figure 6e and Supplementary Fig. S6a; Tnf, Itgb2, CD244, Klra17, Klra2, Il21, CD53 in Supplementary Fig. S6b and Supplementary Table 1) and suggest-ing an antitumor polarization of the immune microenvironment.33,35 To summarize, at day 3 post-tumor- implantation, half the mice (blue group) present an IC-tumor immune microenvironment biased toward an immunosuppres-sive, protumor profile while the other half (dark-red group) have an IC-tumor microenvironment indicating the initiation of a proinflammatory, hence antitumor, response.
Discussion
Most preclinical mouse models investigating the immune com-position of CRC tumors are based on the implantation of colon tumor cell lines under the skin.36,37 Nevertheless, our past work has revealed that the skin microenvironment does not accurately reproduce the microenvironment of organs from which tumor cells originate.10 The colon tumor model described here relies on transplanting tumor cells in their tissue of origin, i.e. sub serosa the colon, in order to reconstitute an appropriate immune microenvironment. Importantly, we and others previously demonstrated that the subserosa implantation of syngeneic colon tumor lead to invasive colon tumors, eventually infiltrated by immune cells.10,38 Using this methodology, we previously observed that the orthotopic injection of the syngeneic CT26 colon tumor cells into BALB/c mice led to the systematic devel-opment of lethal CRC disease. This phenotype was systemati-cally associated with a Th2-M2 immunosuppressive, protumor biased immune microenvironment,10 highlighting that, in addi-tion to tumor cells themselves, the surrounding tissue-specific microenvironment is crucial in shaping the immune response. Here, we found that orthotopic injection of MC38 colon tumor cells into the cecum of B6 mice gave rise to two spontaneous and opposing immune microenvironments in the colon, ultimately leading to either the elimination of tumors or the promotion of cancer development. While immune basal polarization differs between BALB/c and B6 strains,39 thus possibly influencing CT26 and MC38 tumor-immune microenvironments develop-ment, our study further supports the importance of colon-tissue specific immune polarization.
Using MC38-fLuc cells and an in vivo bioluminescence monitoring approach, we demonstrated that tumor implanta-tion and growth were identical in all mice at the early stage of disease development (before day 10). Nonetheless, from day 10, tumor persisted and progressed to lethal CRC in only 25–35% of mice, whereas the remaining 65–75% of animals spontaneously rejected CRC tumors. Other research groups
have previously performed similar orthotopic-implantation of parental MC38 cells or MC38-fLuc in the colon of B6 mice however the two profiles of CRC development seen here have not been previously described.40–42 These studies have reported a rather low tumor incidence (25% to 40%) between 4 and 6 weeks post-implantation, which was explained by a poor tumor intake. However, in the absence of longitudinal monitoring of tumor growth by bioluminescence detection, these authors were unable to observe that tumor-cell implanta-tion was similar in all mice and most probably missed the rejection phase that we detected, in 70% of mice, during the second-week post-implantation (see Figure 1). Thus, we conclude that longitudinal monitoring of tumor progression in MC38-orthotopic model is crucial for the characterization of a spontaneous CRC rejection. In addition, we initially opti-mized CRC development by injecting 1 × 10⁶ MC38 cells, which represents a lower tumor-cell dose than used in the above-cited studies (i.e. 2 × 10⁶ MC38 cells).40–42 Injecting three times more cells (3x10⁶), to optimize the chances of tumor implantation, did not dramatically increase the percen-tage of mice developing a progressive CRC profile, thus imply-ing that the number of injected cancer cells has a negligible impact on the two CRC developmental profiles. Although rarely observed in B6 mice,43 increased immunogenicity linked to the expression of luciferase in tumor cells was previously described in other tumor mouse models.44 However, since the outcome of orthotopic parental MC38 tumors was the same as that of MC38-fLuc IC-tumors, we concluded that luciferase immunogenicity could not explain the CRC rejection profile.
The immune response plays a decisive role in determining the outcome of CRC in our mouse model. Indeed, we never observed tumor rejection in the absence of functional innate and/or adaptive immune components. In line with our pre-vious study highlighting the decisive role of anatomical loca-tion in shaping tumor immunity,10 the rejection of MC38 tumors has not been observed when MC38 cells were implanted in other locations than the colon (i.e. under the skin or in the liver).45 Altogether, our data underline a critical role for colon-specific determinants in regulating the polarization of the tumor immune response, leading either to the rejection or the progression of CRC. Among these determinants, the microbiota was recently shown to be a key component involved in the polarization of the colon-specific immune response during CRC and its composition may vary between mice from various providers.46 Nonetheless, differ-ences in microbiota may not explain the different CRC devel-opment profiles in our mouse model as all animals used in our experiments come from the same provider and were litter-mates. One could propose that the overall microbiota compo-sition may vary in some naïve B6 mice after the arrival in our animal facility, ultimately leading to differences, in the immune status of the colon at steady state. Yet, we never observed any “box-effect” that would lend support to such a hypothesis and it seems unlikely that these microbiota-induced immune dif-ferences would appear in the same proportion in each experi-ment performed (consistently and reproducibly 30% progressive and 70% rejected CRC). In addition, microbiota- induced immune differences should also emerged in BALB/c mice at steady state and yet, after CT26 tumors IC
implantations, all BALB/c mice developed lethal CRC (supple-mentary Figure S1 and10). Besides, given the key contribution of immunity to CRC tumor rejection in B6 mice, we hypothe-sized that an in vivo clonal selection may occur in the colon of mice leading to the enrichment of “immune-resistant” tumor cell clones, able to escape immunity, in the CRC-progressive group vs. “immune-sensitive” tumor cell clones in the CRC- rejecting group.17 However, we found that regardless of their origin, tumor cells behaved similarly and generated both the progressive and rejecting CRC development profiles after re- implantation in naïve B6 mice. These data suggest that clonal selection may not have occurred or does not fully explain the capacity of tumors to grow in CRC-progressive mice.
We distinguished two opposing immune microenviron-ments with either a predominant protumor polarization in a progressive CRC tumor microenvironment or an antitumor polarization in a rejecting CRC tumor microenvironment. In line with other studies on colonic macrophages,47–49 we iden-tified F4/80+/CD11b+/MHCII+/CX3CR1+/CD103−/Ly6c− colon tumor-associated macrophages (TAM) as the most abundant immune subset. They have previously been charac-terized as high IL-10 producers,47 indicating their immuno-suppressive potential, and they mainly infiltrated progressive tumors. A previous study, using a MC38 orthotopic model, has demonstrated the critical role of TAM in CRC development through the remodeling of the extracellular matrix (ECM) composition and structure.49 The high infiltration of CD11c−/ Gr1+/CD11b+ cells observed in tumor-progressive mice, which likely correspond to the typical immunosuppressive MDSC found in the tumor microenvironment,23 supports an immu-nosuppressive tumor network. As shown by others, we believe that a significant proportion of monocyte-derived MDSC, skewed by the surrounding microenvironment, will rapidly differentiate into potentially immunosuppressive TAM.23 The boosted CRC tumor growth observed in nude mice highlighted the importance of innate cells (including TAM and MDSC) in sustaining tumor development. Indeed, in addition to suppres-sing the antitumor immune response, myeloid cells can pro-duce angiogenic factors and cytokines that can remodel ECM, facilitate tumor angiogenesis and growth.49,50 Finally, the high tumor-infiltration by Treg in CRC tumor-progressive mice is consistent with the immunosuppressive immune signature of the microenvironment. Additional phenotypic and functional experiments will help further characterization of the complex-ity of the immune regulatory components and confirm the immunosuppressive functions of MDSC and Treg in the tumors of progressive mice. In contrast, tumors spontaneously rejected from B6 mice exhibited very little infiltration with immunosuppressive Treg, TAM, and MDSC but were highly infiltrated with CD8+ T cells, key antitumor effectors in CRC.8 These CD8+ T cells express low levels of the immune check-point PD-1 suggesting that their antitumor functions are less inhibited compared to progressive tumors-infiltrating CD8+ T cells.51
While two opposing immune response profiles, which we characterized from day 9 tumors, possibly explain the eventual rejection vs. progression of CRC tumors in B6 mice, we also questioned the origin of these divergent immune microenviron-ments. We performed transcriptomic analysis of CRC tumors
at day 3, representing an early time-point after tumor implanta-tion. We found that two opposing immune microenvironments can already be distinguished with half the mice exhibiting a dominant Treg signature and the other half presenting an inflammatory innate, likely antitumor, immune response signa-ture. In the colon, Treg represents a high proportion of CD4+ T lymphocytes (up to 30%) and play a central role in regulating immune responses against commensal microorganisms and diet-ary antigens.52,53 Thus, the Treg signature observed in half the mice, at day 3 post-tumor implantation, possibly reflects a preexisting immunosuppressive microenvironment, further sup-ported by the M2-signature detected in this group of mice, that favors tumor growth. In the other half of mice, a dominant inflam-matory immune response was initiated likely by tumor cells. The local disruption of the initially tolerogenic colon microenviron-ment is outlined by the production of chemoattractant factors and the recruitment of inflammatory innate components and cell populations (inflammatory monocytes, macrophages, NK cells), required for the initiation of an effector antitumor immune response and ultimately the rejection of IC tumors. In these mice, the induction of a cytotoxic immune response against MC38 tumors, is potentially reflected by M1 and cytotoxic CD8+ T cells genes expression patterns. It remains uncertain why such inflammation potentially leads to rejection in the colon but not in other organs (i.e. skin and liver) in which similar tumor implanta-tions were carried out. The 30/70% proporimplanta-tions described from day 9 do not yet seem to be fully established at day 3. We postulate that mice 11 to 15 (Supplementary Fig. S6, blue group) may represent intermediate individuals with an intermediate expression of some Treg-related genes (e.g. Irgm2) and high expression of some inflammation-related genes (e.g. Mefv, Ncf4). Eventually, most likely before day 9, the inflammatory/cytotoxic antitumor microenvironment may become dominant in 78% of mice (mice number 1 to 14) while 22% of the remaining mice may maintain a protumor, Treg, and suppressive myeloid cells asso-ciated microenvironment (see Figure 6 and Supplementary Fig. S6),
in line with our flow cytometry analyses from day 9 (see Figure 4c,
4e; Figure 5c and Supplementary Fig. S4a, 4 c, and 4 f).
The MC38-CRC mouse model is representative of some CRC subtypes, in particular, hypermutated/MSI CRC, as it exhibits major CRC-associated mutations such as in the
BRAF gene.17 Intrinsic tumor cells properties may influence CRC outcome. For instance, mutated-BRAF gene is associated with poor prognosis.54 Nonetheless, the present study demon-strates that spontaneous and early occurrence of opposing immune polarization may occur in pre-clinical CRC tumors and lead to opposite CRC outcomes, most likely independently of the mutation status of MC38 tumor cells, which was iden-tical in all mice. Our work emphasizes the concept that tumor- surrounding tissue-specific microenvironment crucially impacts the cancer outcome10 and supports the notion that the immune response may be superior to MSI status in pre-dicting patients’ disease specific-recurrence and survival.7 During CRC progression, we evidenced a protumor immuno-suppressive immune microenvironment in 25% of the animals and an antitumor immune microenvironment in 65% of the animals. Based on recent work,8 an international consortium of 14 centers in 13 countries validated that high immunoscore patients (who showed a high density of cytotoxic tumor-
infiltrating CD8+ T cells) had the lowest risk of CRC recurrence at 5 years.9 These analyzes revealed that 22% of the patients had a low immunoscore while 78% had an intermediate-to-high immunoscore,9 similar to the 30% protumor vs 70% antitumor signature and CRC development profile proportions seen in our MC38-CRC orthotopic C57BL/6 mouse model. Our model reveals the intrinsic potential of the colon microenvironment to become polarized toward the non-immunosuppressive anti-tumor axis of the immune response, characterized by highly CD8+ T-cell infiltrated tumors, and may, therefore, facilitate the study of the mechanisms underlying the CRC immune response, as well assessment of potential immunotherapeutic interventions.
Materials and methods
Mice and cell lines
Female B6 and BALB/c mice were purchased from Janvier Laboratory (Le Genest-Saint- Isle, France). All experimental protocols were approved by the regional Ethic Committee of Toulouse Biological research Federation (C2EA – 01, FRBT) and by the French minister for Higher Education and Research. For the guidelines on animal welfare, we followed the European directive 2010/63/EU.
MC38 parental and firefly-luciferase+ (fLuc) cells (B6 back-ground, RRID:CVCL_0A67) and CT26 (BALB/c backback-ground, ATCC Cat# CRL-2638, RRID:CVCL_7256) cells were kindly provided by Dr Myriam Capone and Sonia Netzer (ImmunoConcept, CNRS UMR5164, University of Bordeaux, France) and generated as previously described.12 Cells were cultured at 37°C and 5% CO2 in Dulbecco’s Modified Eagle’s Medium (DMEM) (Sigma, Cat#6429) supplemented with 10% fetal bovine serum (FBS) (Gibco, Cat#10270106). Cells were cultured for 2 to 6 passages and tested negative for mycoplasma.
Tumor implantation
Mice were implanted intra-colon (IC), into the cecum, as previously described.12,13 1 × 10⁶ or 3 × 10⁶ viable tumor cells were injected IC sub-serosa. To ensure optimal reproducibility, injections were always performed in the same site of the cecum (Supplementary Fig. S1a). Subcutaneous (SC) solid tumors were generated by injecting 3 × 10⁶ viable tumor cells in the right flank of the mouse. Tumor progression was measured using a caliper and mice were euthanized when tumor size reached the ethically defined limit of 250 mm2. Intra-hepatic (IH) solid tumors were established by injecting 2.5 × 10⁵ viable tumor cells in anaesthetized-mice as previously described.10
Bioluminescence imaging
In vivo MC38-fLuc tumor growth and invasion were monitored,
twice a week, using the cooled charge-coupled device camera IVIS Spectrum in vivo Imaging System (PerkinElmer), following intra-peritoneal (IP) injection of 150 mg/kg of D-Luciferin (Oz Bioscience, Cat#LN10000). Quantitative analyses were performed using IVIS Living Image 4.5.2 software (PerkinElmer; RRID: SCR_014247). Bioluminescent signal intensity was presented as
average radiance (photons/sec/cm2/sr). For ex vivo imaging, mice were administered D-Luciferin, sacrificed, and organs of interest were rapidly excised and immersed in 12-well plate with 4.5 mg/ mL D-luciferin.
Antibody administration for in vivo depletion
Anti (α)-mouse CD4 and α-mouse CD8 monoclonal antibodies, kindly provided by Rémi Gence (INSERM UMR1037, UPS, Toulouse, France) were purified from rat hybridoma supernatants of GK1.5 (ATCC Cat#TIB-207, RRID: CVCL_4523) and 53–6.72 (ATCC Cat#TIB-105, RRID:CVCL_9162) cell lines, respectively. 200 µg of α-CD4 mAb or α-CD8 mAb IP administrated by 6 injections in mice (at day 61, 62, 63, 66, 68, and 73 post-tumor implantation).
RNA extraction
Disruption of frozen tissue samples and cells was performed using a Precellys homogenizer (Bertin Instruments, Bretonneux, France). Genomic DNA or total RNA were extracted using the QIAamp DNA Mini Kit or the RNeasy Plus Mini Kit, respectively (Qiagen, Cat#51304 and 74134), according to the manufacturer’s instructions.
Luciferase qPCR
For Reverse Transcription reaction (RT-PCR), the first cDNA strand was synthetized from 1 µg of total RNA primed with an oligo (dT)15 Primer and reverse-transcribed with AMV Reverse Transcriptase (Reverse Transcription System – Promega, Cat# A3500). For quantitative (q)PCR, 100ng of DNA or the first cDNA strand were mixed with TaqMan Fast Advanced Master Mix (2X) and specific TaqMan qene expres-sion assay (20X) (Mr03987587_mr, Applied Biosystems). The reactions were performed on a StepOnePlus System (Applied Biosystems) (holding stage at 50°C for 2 min and 95°C for 20 sec, followed by 45 cycles at 95°C for 1 sec, and 60°C for 20 sec). The relative expression/amplification of the gene of interest was calculated using the formula 2CtGAPDH-CtLuc55 and normalized to the expression/amplification level of the housekeeping gene glyceraldehyde 3-phosphate deshydrogen-ase (GAPDH).
Tumor processing and flow cytometry
IC tumors were digested for 30 min in DMEM with 1 mg/ml Collagenase Type IV, 50 U/ml DNase I Type IV and 100 µg/ml Hyaluronidase type 4 (all from Sigma, Cat#C5138, D5025, H6254) at 37°C with agitation followed by filtration through a 70 µM cell strainer. For spleen single-cell suspension pre-paration, spleens were dissociated by filtration through a 70 µM cell strainer. An Ammonium-Chloride-Potassium (ACK) buffer erythrocyte lysis step was then performed. Cells were resuspended in PBS with 2% FBS containing anti-mouse CD16/CD32 antibody (Table 1) and 1:1000 Fixable Viability Dye eFluor™ 506 (eBioscience, Cat#65-0866) or Zombie UV™ Fixable Viability Kit (BioLegend, Cat#423108). Staining with primary fluorophore-conjugated antibodies directed against
cell surface markers (Supplementary Table 2) was performed. Flow cytometric analyses were performed on a LSR II flow cytometer (BD Biosciences) and analyzed using FlowJo soft-ware (Treestar, RRID:SCR_008520).
Nanostring and computational analysis
Total RNA was isolated from day 3 fresh mouse tumors after we implanted MC38-fLuc IC in B6 mice (n = 19), harvested solid tumors on day 3 post-implantation. For gene expression analysis, 100 ng total RNA per reaction was used for hybridization using the nCounter PanCancer Mouse Immune Profiling panel, according to the manufacturer’s nCounter XT protocol (NanoString Technologies, Panel XT_PGX_MmV1_CancerImm_CSO XT- CSO-MIP1-12 ref 115000142). The panel include 770 cancer- related mouse genes and 20 internal reference controls. Samples were processed on nCounter Sample Prep Station and nCounter Digital Analyzer (NanoString Technologies). Raw data were extracted using nSolver 2.6 software (NanoString Technologies). Gene expression values were calculated by quantile normalization of log2-transformed data. Groups of mouse tumors were defined using the first principal components analysis (PCA). Differential genes expressions were tested using ANOVA corrected to multiple testing correction by the Benjamin-Hochberg (BH) methods and genes with p-Value <0.05 (Fold Change threshold >1,10; heat map Supplementary Fig. S6a) or <0.005 (Fold Change threshold >1,16; heat map Supplementary Fig. S6b) were selected. Z-score normal-ized expression of selected genes were illustrated using heat map with unsupervised hierarchical clustering based on euclidean distance.
Statistical analysis
Results are expressed as the mean or median ± standard error of the mean (SEM). All statistical analysis was performed with Prism software (GraphPad Prism, RRID:SCR_002798). The variation in survivals between different groups was analyzed using Log-rank (Mantel-Cox) test. Experiments were analyzed
using Mann-Whitney test and P < 0.05 is considered significant.
Abbreviations Acknowledgments
We thank Romain Ecalard, Lise Molimard, Myriam Sicard, Judith Hilaire and Claire Descloux for technical assistance with the animal experiments.
Funding
This study was financially supported by funding from the association Entente Cordiale Gaillacoise. GT has been supported by H2020 Marie Skłodowska-Curie Actions (European Training Network, “GlyCoCan” project, grant number 676421) and by the Fondation ARC pour la recherche sur le cancer. CD has been supported Region Occitanie Pyrénées-Méditerranée.
ORCID
Marie Tosolini http://orcid.org/0000-0001-5278-5952 Christel Devaud http://orcid.org/0000-0003-3511-3219
Competing interests
The authors declare that they have no competing interests.
Ethic approval
All experimental protocols were approved by the regional Ethic Committee of Toulouse Biological Research Federation (C2EA - 01, FRBT) and by the French minister for Higher Education and Research.
References
1. de Visser KE, Eichten A, Coussens LM. Paradoxical roles of the immune system during cancer development. Nat Rev Cancer. 2006;6(1):24–37. doi:10.1038/nrc1782.
2. O’Donnell JS, Teng MWL, Smyth MJ. Cancer immunoediting and resistance to T cell-based immunotherapy. Nat Rev Clin Oncol. Dec 6 2018. doi: 10.1038/s41571-018-0142-8
3. Topalian SL, Hodi FS, Brahmer JR, Gettinger SN, Smith DC, McDermott DF, Powderly JD, Carvajal RD, Sosman JA, Atkins MB, et al. Safety, activity, and immune correlates of anti-PD-1 antibody in cancer. N Engl J Med. 2012;366 (26):2443–2454. doi:10.1056/NEJMoa1200690.
4. Pilleron S, Sarfati D, Janssen-Heijnen M, Vignat J, Ferlay J, Bray F, Soerjomataram I. Global cancer incidence in older adults, 2012 and 2035: A population-based study. Int J Cancer. 2019;144(1):49–58. doi:10.1002/ijc.31664.
5. Le DT, Uram JN, Wang H, Bartlett BR, Kemberling H, Eyring AD, Skora AD, Luber BS, Azad NS, Laheru D, et al. PD-1 blockade in tumors with mismatch-repair deficiency. N Engl J Med. 2015;372 (26):2509–2520. doi:10.1056/NEJMoa1500596.
6. Cancer Genome Atlas Research Network. Comprehensive molecu-lar characterization of gastric adenocarcinoma. Nature. 2014;513 (7517):202–209. doi:10.1038/nature13480.
7. Mlecnik B, Bindea G, Angell HK, Maby P, Angelova M, Tougeron D, Church SE, Lafontaine L, Fischer M, Fredriksen T, et al. Integrative analyses of colorectal cancer show immunoscore is
α anti
ACK ammonium-chloride-potassium B6 C57BL/6
CRC colorectal cancer DC dendritic cell
DMEM dulbecco’s modified eagle’s medium ECM extracellular matrix
FBS fetal bovine serum IC intra-colon fLuc firefly luciferase IH intra-hepatic IP intra-peritoneal M1 type 1 macrophages M2 type 2 macrophages
MDSC myeloid-derived suppressor cells MMR DNA mismatch repair system MSI microsatellite instability high NK natural killer
q quantitative
Treg regulatory CD4+ T cells SC subcutaneous
SEM standard error of the mean TAM tumor associated macrophages.
a stronger predictor of patient survival than microsatellite instability. Immunity. 2016;44(3):698–711. doi:10.1016/j. immuni.2016.02.025.
8. Galon J, Costes A, Sanchez-Cabo F, Kirilovsky A, Mlecnik B, Lagorce-Pagès C, Tosolini M, Camus M, Berger A, Wind P, et al. Type, density, and location of immune cells within human color-ectal tumors predict clinical outcome. Science. 2006;313 (5795):1960–1964. doi:10.1126/science.1129139.
9. Pagès F, Mlecnik B, Marliot F, Bindea G, Ou F-S, Bifulco C, Lugli A, Zlobec I, Rau TT, Berger MD, et al. International valida-tion of the consensus Immunoscore for the classificavalida-tion of colon cancer: a prognostic and accuracy study. Lancet. 2018;391 (10135):2128–2139. doi:10.1016/S0140-6736(18)30789-X. 10. Devaud C, Westwood JA, John LB, Flynn JK, Paquet-Fifield S,
Duong CPM, Yong CSM, Pegram HJ, Stacker SA, Achen MG, et al. Tissues in different anatomical sites can sculpt and vary the tumor microenvironment to affect responses to therapy. Mol Ther. 2014;22(1):18–27. doi:10.1038/mt.2013.219.
11. Lehmann B, Biburger M, Brückner C, Ipsen-Escobedo A, Gordan S, Lehmann C, Voehringer D, Winkler T, Schaft N, Dudziak D, et al. Tumor location determines tissue-specific recruitment of tumor-associated macrophages and antibody-dependent immunotherapy response. Sci Immunol. 2017;2:7. doi:10.1126/sciimmunol.aah6413.
12. Devaud C, Rousseau B, Netzer S, Pitard V, Paroissin C, Khairallah C, Costet P, Moreau J-F, Couillaud F, Dechanet- Merville J, et al. Anti-metastatic potential of human Vδ1(+) γδ T cells in an orthotopic mouse xenograft model of colon carci-noma. Cancer Immunol Immunother. 2013;62(7):1199–1210. doi:10.1007/s00262-013-1402-1.
13. Devaud C, A-F T-M, Vignolle-Vidoni A, Souleres P, Denadai- Souza A, Rolland C, Duthoit C, Blanpied C, Chabot S, Bouillé P, et al. FAK alternative splice mRNA variants expression pattern in colorectal cancer. Int J Cancer. 2019 Jan 10; doi:10.1002/ijc.32120. 14. Schölch S, García SA, Iwata N, Niemietz T, Betzler AM,
Nanduri LK, Bork U, Kahlert C, Thepkaysone M-L, Swiersy A, et al. Circulating tumor cells exhibit stem cell characteristics in an orthotopic mouse model of colorectal cancer. Oncotarget. 2016;7 (19):27232–27242. doi:10.18632/oncotarget.8373.
15. Zitvogel L, Pitt JM, Daillère R, Smyth MJ, Kroemer G. Mouse models in oncoimmunology. Nat Rev Cancer. 2016;16 (12):759–773. doi:10.1038/nrc.2016.91.
16. Corbett TH, Griswold DP, Roberts BJ, Peckham JC, Schabel FM. Tumor induction relationships in development of transplantable cancers of the colon in mice for chemotherapy assays, with a note on carcinogen structure. Cancer Res. 1975;35:2434–2439. 17. Efremova M, Rieder D, Klepsch V, Charoentong P, Finotello F,
Hackl H, Hermann-Kleiter N, Löwer M, Baier G, Krogsdam A, et al. Targeting immune checkpoints potentiates immunoediting and changes the dynamics of tumor evolution. Nat Commun. 2018;9(1):32. doi:10.1038/s41467-017-02424-0.
18. Kocher B, Piwnica-Worms D. Illuminating cancer systems with genetically engineered mouse models and coupled luciferase repor-ters in vivo. Cancer Discov. 2013;3(6):616–629. doi:10.1158/2159- 8290.CD-12-0503.
19. Tung JK, Berglund K, Gutekunst C-A, Hochgeschwender U, Gross RE. Bioluminescence imaging in live cells and animals. Neurophotonics. 2016;3(2):025001. doi:10.1117/1.NPh.3.2.025001. 20. Yeh AC, Ramaswamy S. Mechanisms of cancer cell dormancy–
another hallmark of cancer? Cancer Res. 2015;75(23):5014–5022. doi:10.1158/0008-5472.CAN-15-1370.
21. Koebel CM, Vermi W, Swann JB, Zerafa N, Rodig SJ, Old LJ, Smyth MJ, Schreiber RD. Adaptive immunity maintains occult cancer in an equilibrium state. Nature. 2007;450(7171):903–907. doi:10.1038/nature06309.
22. Murray PJ, Allen JE, Biswas SK, Fisher EA, Gilroy DW, Goerdt S, Gordon S, Hamilton JA, Ivashkiv LB, Lawrence T, et al. Macrophage activation and polarization: nomenclature and
experimental guidelines. Immunity. 2014;41(1):14–20. doi:10.1016/j.immuni.2014.06.008.
23. Kumar V, Patel S, Tcyganov E, Gabrilovich DI. The nature of myeloid-derived suppressor cells in the tumor microenvironment. Trends Immunol. 2016;37(3):208–220. doi:10.1016/j.it.2016.01.004. 24. Neumann C, Blume J, Roy U, Teh PP, Vasanthakumar A, Beller A,
Liao Y, Heinrich F, Arenzana TL, Hackney JA, et al. c-Maf- dependent Treg cell control of intestinal TH17 cells and IgA establishes host-microbiota homeostasis. Nat Immunol. 2019;20 (4):471–481. doi:10.1038/s41590-019-0316-2.
25. Cuadrado E, van den Biggelaar M, de Kivit S, Chen -Y-Y, Slot M, Doubal I, Meijer A, RAW VL, Borst J, Amsen D. Proteomic analyses of human regulatory T cells reveal adaptations in signaling pathways that protect cellular identity. Immunity. 2018;48 (5):1046–1059.e6. doi:10.1016/j.immuni.2018.04.008.
26. Konkel JE, Zhang D, Zanvit P, Chia C, Zangarle-Murray T, Jin W, Wang S, Chen W. Transforming growth factor-β signaling in regulatory T cells controls T Helper-17 cells and tissue-specific immune responses. Immunity. 2017;46(4):660–674. doi:10.1016/j. immuni.2017.03.015.
27. Miragaia RJ, Gomes T, Chomka A, Jardine L, Riedel A, Hegazy AN, Whibley N, Tucci A, Chen X, Lindeman I, et al. Single-cell tran-scriptomics of regulatory T cells reveals trajectories of tissue adaptation. Immunity. 2019;50(2):493–504.e7. doi:10.1016/j. immuni.2019.01.001.
28. Zitvogel L, Kepp O, Galluzzi L, Kroemer G. Inflammasomes in carcinogenesis and anticancer immune responses. Nat Immunol. 2012;13(4):343–351. doi:10.1038/ni.2224.
29. Coussens LM, Werb Z. Inflammation and cancer. Nature. 2002;420 (6917):860–867. doi:10.1038/nature01322.
30. Chittezhath M, Dhillon MK, Lim JY, Laoui D, Shalova IN, Teo YL, Chen J, Kamaraj R, Raman L, Lum J, et al. Molecular profiling reveals a tumor-promoting phenotype of monocytes and macro-phages in human cancer progression. Immunity. 2014;41 (5):815–829. doi:10.1016/j.immuni.2014.09.014.
31. Zilionis R, Engblom C, Pfirschke C, Savova V, Zemmour D, Saatcioglu HD, Krishnan I, Maroni G, Meyerovitz CV, Kerwin CM, et al. Single-cell transcriptomics of human and mouse lung cancers reveals conserved myeloid populations across individuals and species. Immunity. 2019;50(5):1317–1334.e10. doi:10.1016/j.immuni.2019.03.009.
32. Engblom C, Pfirschke C, Pittet MJ. The role of myeloid cells in cancer therapies. Nat Rev Cancer. 2016;16(7):447–462. doi:10.1038/ nrc.2016.54.
33. Galon J, Angell HK, Bedognetti D, Marincola FM. The continuum of cancer immunosurveillance: prognostic, predictive, and mechanistic signatures. Immunity. 2013;39(1):11–26. doi:10.1016/ j.immuni.2013.07.008.
34. Katlinski KV, Gui J, Katlinskaya YV, Ortiz A, Chakraborty R, Bhattacharya S, Carbone CJ, Beiting DP, Girondo MA, Peck AR, et al. Inactivation of interferon receptor promotes the establish-ment of immune privileged tumor microenvironestablish-ment. Cancer Cell. 2017;31(2):194–207. doi:10.1016/j.ccell.2017.01.004.
35. Bindea G, Mlecnik B, Tosolini M, Kirilovsky A, Waldner M, Obenauf AC, Angell H, Fredriksen T, Lafontaine L, Berger A, et al. Spatiotemporal dynamics of intratumoral immune cells reveal the immune landscape in human cancer. Immunity. 2013;39 (4):782–795. doi:10.1016/j.immuni.2013.10.003.
36. Filatenkov A, Baker J, Mueller AMS, Kenkel J, Ahn G-O, Dutt S, Zhang N, Kohrt H, Jensen K, Dejbakhsh-Jones S, et al. Ablative tumor radiation can change the tumor immune cell microenviron-ment to induce durable complete remissions. Clin Cancer Res. 2015;21(16):3727–3739. doi:10.1158/1078-0432.CCR-14-2824. 37. Nakamura K, Yaguchi T, Ohmura G, Kobayashi A, Kawamura N,
Iwata T, Kiniwa Y, Okuyama R, Kawakami Y. Involvement of local renin-angiotensin system in immunosuppression of tumor microenvironment. Cancer Sci. 2018;109(1):54–64. doi:10.1111/ cas.13423.
38. Song W, Shen L, Wang Y, Liu Q, Goodwin TJ, Li J, Dorosheva O, Liu T, Liu R, Huang L. Synergistic and low adverse effect cancer immunotherapy by immunogenic chemotherapy and locally expressed PD-L1 trap. Nat Commun. 2018;9(1):2237. doi:10.1038/s41467-018-04605-x.
39. Watanabe H, Numata K, Ito T, Takagi K, Matsukawa A. Innate immune response in Th1- and Th2-dominant mouse strains. Shock. 2004;22(5):460–466. doi:10.1097/01.shk.0000142249.08135.e9. 40. Zhang Y, Davis C, Shah S, Hughes D, Ryan JC, Altomare D,
Peña MMO. IL-33 promotes growth and liver metastasis of color-ectal cancer in mice by remodeling the tumor microenvironment and inducing angiogenesis. Mol Carcinog. 2017;56(1):272–287. doi:10.1002/mc.22491.
41. Xu H, Zhang Y, Peña MM, Pirisi L, Creek KE. Six1 promotes colorectal cancer growth and metastasis by stimulating angiogen-esis and recruiting tumor-associated macrophages. Carcinogenangiogen-esis. 2017;38(3):281–292. doi:10.1093/carcin/bgw121.
42. Liu X, Jiang J, Chan R, Ji Y, Lu J, Liao Y-P, Okene M, Lin J, Lin P, Chang CH, et al. Improved efficacy and reduced toxicity using a custom-designed irinotecan-delivering silicasome for orthotopic colon cancer. ACS Nano. 2018 Dec 11; doi:10.1021/acsnano.8b06164. 43. Clark AJ, Safaee M, Oh T, Ivan ME, Parimi V, Hashizume R,
Ozawa T, James CD, Bloch O, Parsa AT. Stable luciferase expres-sion does not alter immunologic or in vivo growth properties of GL261 murine glioma cells. J Transl Med. 2014;12:345. doi:10.1186/s12967-014-0345-4.
44. Baklaushev VP, Kilpeläinen A, Petkov S, Abakumov MA, Grinenko NF, Yusubalieva GM, Latanova AA, Gubskiy IL, Zabozlaev FG, Starodubova ES, et al. Luciferase expression allows bioluminescence imaging but imposes limitations on the orthoto-pic mouse (4T1) model of breast cancer. Sci Rep. 2017;7(1):7715. doi:10.1038/s41598-017-07851-z.
45. Choy G, O’Connor S, Diehn FE, Costouros N, Alexander HR, Choyke P, Libutti SK. Comparison of noninvasive fluorescent and bioluminescent small animal optical imaging. BioTechniques. 2003;35(5):1022–1026, 1028–1030. doi:10.2144/03355rr02.
46. Zitvogel L, Ayyoub M, Routy B, Kroemer G. Microbiome and anticancer immunosurveillance. Cell. 2016;165(2):276–287. doi:10.1016/j.cell.2016.03.001.
47. Rivollier A, He J, Kole A, Valatas V, Kelsall BL. Inflammation switches the differentiation program of Ly6Chi monocytes from antiinflamma-tory macrophages to inflammaantiinflamma-tory dendritic cells in the colon. J Exp Med. 2012;209(1):139–155. doi:10.1084/jem.20101387.
48. Zigmond E, Varol C, Farache J, Elmaliah E, Satpathy AT, Friedlander G, Mack M, Shpigel N, Boneca IG, Murphy KM, et al. Ly6C hi monocytes in the inflamed colon give rise to proinflammatory effector cells and migratory antigen-presenting cells. Immunity. 2012;37(6):1076–1090. doi:10.1016/j.immuni.2012.08.026.
49. Afik R, Zigmond E, Vugman M, Klepfish M, Shimshoni E, Pasmanik-Chor M, Shenoy A, Bassat E, Halpern Z, Geiger T, et al. Tumor macrophages are pivotal constructors of tumor col-lagenous matrix. J Exp Med. 2016;213(11):2315–2331. doi:10.1084/ jem.20151193.
50. Shojaei F, Zhong C, Wu X, Yu L, Ferrara N. Role of myeloid cells in tumor angiogenesis and growth. Trends Cell Biol. 2008;18 (8):372–378. doi:10.1016/j.tcb.2008.06.003.
51. Chen DS, Mellman I. Elements of cancer immunity and the cancer-immune set point. Nature. 2017;541(7637):321–330. doi:10.1038/nature21349.
52. Tanoue T, Atarashi K, Honda K. Development and maintenance of intestinal regulatory T cells. Nat Rev Immunol. 2016;16 (5):295–309. doi:10.1038/nri.2016.36.
53. Dépis F, Kwon H-K, Mathis D, Benoist C. Unstable FoxP3+ T regulatory cells in NZW mice. Proc Natl Acad Sci U S A. 2016;113(5):1345–1350. doi:10.1073/pnas.1524660113.
54. Sanz-Garcia E, Argiles G, Elez E, Tabernero J. BRAF mutant colorectal cancer: prognosis, treatment, and new perspectives. Ann Oncol. 2017;28(11):2648–2657. doi:10.1093/annonc/ mdx401.
55. Livak KJ, Schmittgen TD. Analysis of relative gene expression data using real-time quantitative PCR and the 2(-Delta Delta C(T)) Method. Methods. 2001;25(4):402–408. doi:10.1006/meth.2001.1262.