1 The Patent Buyout Price for Human Papilloma Virus (HPV) Vaccine and the Ratio of R&D Costs to the Patent Value 1
Supporting Information
23
Throughout the paper, we converted all monetary variable values to 2018 US$, according to Table S0. 4
Table S0. Consumer price index (CPI) with base year 2015 and price index (PI) with base year 2018. 5
Observation date CPI PI*
2007 87.48 0.826 2008 90.84 0.857 2009 90.52 0.854 2010 92.00 0.868 2011 94.90 0.896 2012 96.87 0.914 2013 98.29 0.928 2014 99.88 0.942 2015 100.00 0.944 2016 101.26 0.956 2017 103.42 0.976 2018 105.94 1.00
* PI is given by CPI (base year 2015) in a given year divided by CPI in 2018. 6
Source: Federal Reserve Bank (69) and own calculations. 7
8
To derive operating profits using equation No. 1, we need prices, number of sold units, and variable costs. 9
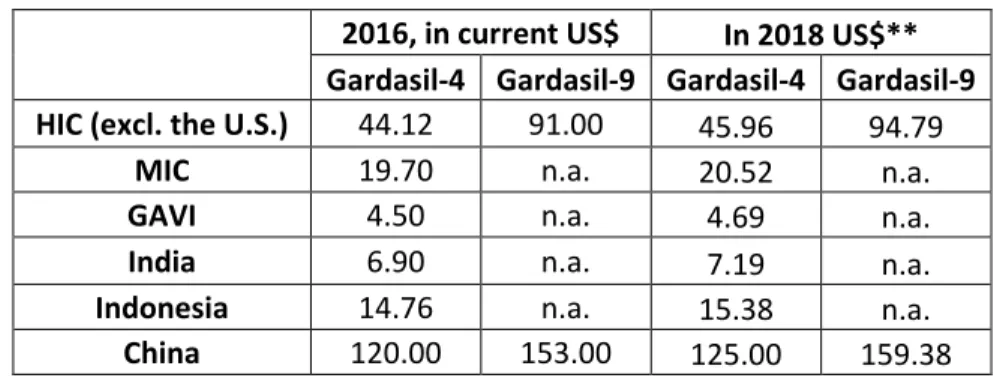
Table S1. Prices of Gardasil-4 and Gardasil-9 outside the U.S. in year 2016.* 10
2016, in current US$ In 2018 US$** Gardasil-4 Gardasil-9 Gardasil-4 Gardasil-9 HIC (excl. the U.S.) 44.12 91.00 45.96 94.79
MIC 19.70 n.a. 20.52 n.a.
GAVI 4.50 n.a. 4.69 n.a.
India 6.90 n.a. 7.19 n.a.
Indonesia 14.76 n.a. 15.38 n.a.
China 120.00 153.00 125.00 159.38
* Median prices for middle-income countries (MIC) and high-income countries (HIC). ** Deflated prices using the 11
price index for 2016, PI=0.956 (Table S0). n.a.: Not applicable because Gardasil-9 has not been sold in these regions. 12
Sources: HIC, MIC (includes purchases mediated by PAHO), GAVI (9); India (75); Indonesia (76); China 13
(73,74) and own calculations. 14
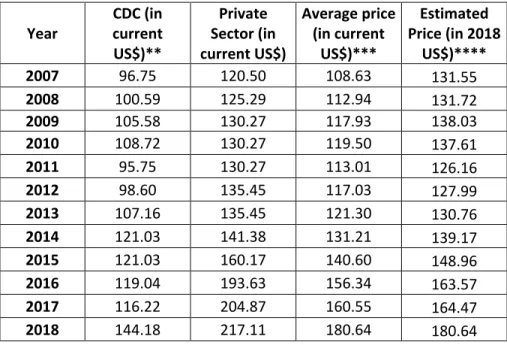
2 Table S2. Gardasil prices* per dose in the U.S. from 2007-2018.
16
Year CDC (in current US$)** Private Sector (in current US$) Average price (in current US$)*** Estimated Price (in 2018 US$)**** 2007 96.75 120.50 108.63 131.55 2008 100.59 125.29 112.94 131.72 2009 105.58 130.27 117.93 138.03 2010 108.72 130.27 119.50 137.61 2011 95.75 130.27 113.01 126.16 2012 98.60 135.45 117.03 127.99 2013 107.16 135.45 121.30 130.76 2014 121.03 141.38 131.21 139.17 2015 121.03 160.17 140.60 148.96 2016 119.04 193.63 156.34 163.57 2017 116.22 204.87 160.55 164.47 2018 144.18 217.11 180.64 180.64
* Prices for Gardasil-4 in 2007-2015 and for Gardasil-9 for 2016-2018. **CDC refers to prices for sales mediated by 17
Centers for Disease Control (CDC) funded programs. *** Simple average of numbers in columns 2 and 3. **** 18
Deflated by the PI as given in Table S0. 19
Source: CDC (40) and own calculations. 20
21
GAVI (18) gives estimates on the number of units for 2010-2017 and predictions for 2018-2027 for HIC as 22
a whole and for other regions. The number of units is thus not readily available as breakdown of HIC 23
numbers into those sold in the U.S. and those sold in other HIC. We also do not have estimates for the 24
period 2007-2009. We can derive, however, the market share for the period 2015-2017 in the U.S. and 25
know that in period 2007-2009 Gardasil has only been sold in HIC. Using revenue information in Table 1 of 26
the main text, the missing data to generate the middle estimates for 2007-2017 in Table 2 (“Number of 27
Gardasil doses sold in different countries and country groups…”) is derived accordingly in Tables S3a-S3c. 28
Table S3a. U.S. market share, 2015-2017. 29
Year U.S. revenue (in million US$) Total revenue (in million US$) U.S. revenue share (in %)
2015 1,520 1,908 79.66
2016 1,780 2,173 81.91
2017 1,565 2,308 67.81
Average U.S revenue share 2015-2017 (in %) 76.46 Source: Merck (77).
3 Table S3b. Total Gardasil sales revenues, its estimated composition (U.S. vs. non-U.S.) and estimated 31
number of doses sold in the U.S., 2007-2017. 32
Revenue (in million US$)
Year U.S.* Non-U.S.* Total Nominal U.S. price/dose** sold in the U.S. (in Number of doses millions) 2007 1,132.07 348.53 1,480.60 108.63 10.42 2008 1,072.58 330.22 1,402.80 112.94 9.50 2009 855.13 263.27 1,118.40 117.93 7.25 2010 755.42 232.58 988 119.5 6.32 2011 924.40 284.60 1,209 113.01 8.18 2012 1,247.06 383.94 1,631 117.03 10.66 2013 1,399.98 431.02 1,831 121.30 11.54 2014 1,328.87 409.13 1,738 131.21 10.13 2015 1,520 388 1,908 140.60 10.81 2016 1,780 393 2,173 156.34 11.39 2017 1,565 743 2,308 160.55 9.75
* For 2007-2014 we assumed the U.S. (non-U.S.) market share corresponds to 76.46% (23.54%) of the global Gardasil 33
revenue market, as calculated in Table S3a, using total revenues from Table 1 (main text). ** The column restates 34
the average median price in the U.S. from Table S2, assuming that 50% of sales are mediated by CDC funded 35
programs. 36
Sources: GAVI (19) and own calculations. 37
38
Table S3c. Nominal prices and number of doses in HIC excluding the U.S., 2007-2009. 39
Year Revenue
(in million US$)* Nominal price/dose in other HIC (in US$)** other HIC (in millions)*** Number of doses sold in
2007 348.53 37.95 9.18
2008 330.22 39.41 8.38
2009 263.27 39.27 6.70
* Revenue information for non-U.S. countries from Table S3b (these are HIC in 2007-2009). ** Prices from Table S1 40
deflated by PI from Table S0. *** Revenue in column 2 divided by price in column 3. 41
42
For the forecasts (2018-2027) in Table 2 of the main text we employ the average U.S. market share in 43
period 2010-2017 as derived in Table S4 for the breakdown of the number of units sold in the U.S. vs. other 44
HIC. 45
46 47
4 Table S4. U.S. share of total number of doses sold in HIC, 2010-2017.
48
Year Number of doses sold in all HIC (in millions) Number of doses sold in U.S. (in millions)* U.S. sales share (in %)
2010 15.66 6.32 40.4 2011 20.88 8.18 39.2 2012 18.27 10.66 58.3 2013 17.4 11.54 66.3 2014 15.23 10.13 66.5 2015 14.79 10.81 73.1 2016 15.66 11.39 72.7 2017 15.66 9.75 62.2
Average U.S. sales share 2010-2017 (in %) 59.8 * Calculated in Table S3b.
49
Source: GAVI (19) and own calculations. 50
51
Table S5a and Table S5b summarize the derived middle estimates of the number of doses for the periods 52
2007-2017 and 2018-2027 (forecasts), respectively: they also display the “high” estimates (adding 20% to 53
the middle estimate) and the “low” estimates (subtracting 20% from the middle estimate) that account 54
for uncertainty in the estimates and predictions. The “high” and “low” estimates by region enter the 55
calculations of operating profits (Table S9). From those, we can derive the PDV of operating profits for the 56
two scenarios as given in Table 4 of the main text by applying equation No. 2. 57
5 Table S5a. Number of Gardasil doses in different regions in millions, 2007-2017, different scenarios. 59
Year Estimate
Number of doses (in millions)
HIC total U.S.* Other HIC** MIC GAVI Indonesia India/ China Total
2007 Low (-20%) 15.68 8.34 7.34 0 0 0 0 15.68 Middle 19.60 10.42 9.18 0 0 0 0 19.60 High (+20%) 23.52 12.50 11.02 0 0 0 0 23.52 2008 Low (-20%) 14.30 7.60 6.70 0 0 0 0 14.30 Middle 17.88 9.50 8.38 0 0 0 0 17.88 High (+20%) 21.46 11.40 10.06 0 0 0 0 21.46 2009 Low (-20%) 11.16 5.80 5.36 0 0 0 0 11.16 Middle 13.95 7.25 6.70 0 0 0 0 13.95 High (+20%) 16.74 8.70 8.04 0 0 0 0 16.74 2010 Low (-20%) 12.53 5.06 7.47 4.87 0 0 0 17.40 Middle 15.66 6.32 9.34 6.09 0 0 0 21.75 High (+20%) 18.79 7.59 11.21 7.31 0 0 0 26.10 2011 Low (-20%) 16.70 6.54 10.16 9.05 0 0 0 25.75 Middle 20.88 8.18 12.70 11.31 0 0 0 32.19 High (+20%) 25.06 9.82 15.24 13.57 0 0 0 38.63 2012 Low (-20%) 14.62 8.53 6.09 11.14 0 0 0 25.75 Middle 18.27 10.66 7.61 13.92 0 0 0 32.19 High (+20%) 21.92 12.79 9.14 16.70 0 0 0 38.63 2013 Low (-20%) 13.92 9.23 4.69 11.14 0.70 0 0 25.75 Middle 17.40 11.54 5.86 13.92 0.87 0 0 32.19 High (+20%) 20.88 13.85 7.03 16.70 1.04 0 0 38.63 2014 Low (-20%) 12.18 8.10 4.08 9.05 0.70 0 0 21.92 Middle 15.23 10.13 5.10 11.31 0.87 0 0 27.41 High (+20%) 18.27 12.15 6.12 13.57 1.04 0 0 32.89 2015 Low (-20%) 11.83 8.65 3.18 7.66 1.39 0 0 20.88 Middle 14.79 10.81 3.98 9.57 1.74 0 0 26.10 High (+20%) 17.75 12.97 4.78 11.48 2.09 0 0 31.32 2016 Low (-20%) 12.53 9.11 3.42 7.66 2.09 0.70 0 22.97 Middle 15.66 11.39 4.27 9.57 2.61 0.87 0 28.71 High (+20%) 18.79 13.66 5.13 11.48 3.13 1.04 0 34.45 2017 Low (-20%) 12.53 7.80 4.73 7.66 1.39 0.70 0 22.27 Middle 15.66 9.75 5.91 9.57 1.74 0.87 0 27.84 High (+20%) 18.79 11.70 7.09 11.48 2.09 1.04 0 33.41 To
tal Low (-20%) Middle 106.84 133.55 63.02 78.77 54.77 43.82 68.21 85.26 6.26 7.83 1.74 1.39 0 0 182.70 228.38
High (+20%) 160.25 94.53 65.73 102.31 9.40 2.09 0 274.05
* For the U.S. middle estimates, see Table S3b. ** Implied by subtracting U.S. numbers from HIC total. 60
6 Table S5b. Number of Gardasil doses in different regions in millions, 2018-2027, different scenarios. 61
Year Estimate
Number of doses (in millions)
HIC total U.S.* Other HIC** MIC GAVI Indonesia India/ China Total
2018 Low (-20%) 11.83 7.08 4.76 8.35 4.18 0.70 0 25.06 Middle 14.79 8.84 5.95 10.44 5.22 0.87 0 31.32 High (+20%) 17.75 10.61 7.13 12.53 6.26 1.04 0 37.58 2019 Low (-20%) 12.18 7.28 4.90 9.74 18.79 0.70 0 41.41 Middle 15.23 9.10 6.12 12.18 23.49 0.87 0 51.77 High (+20%) 18.27 10.93 7.34 14.62 28.19 1.04 0 62.12 2020 Low (-20%) 13.22 7.91 5.32 10.44 27.84 0.70 0 52.20 Middle 16.53 9.88 6.65 13.05 34.80 0.87 0 65.25 High (+20%) 19.84 11.86 7.97 15.66 41.76 1.04 0 78.30 2021 Low (-20%) 12.53 7.49 5.04 10.44 21.58 11.14 0 55.68 Middle 15.66 9.36 6.30 13.05 26.97 13.92 0 69.60 High (+20%) 18.79 11.24 7.55 15.66 32.36 16.70 0 83.52 2022 Low (-20%) 11.83 7.08 4.76 10.44 22.97 20.18 0.70 66.12 Middle 14.79 8.84 5.95 13.05 28.71 25.23 0.87 82.65 High (+20%) 17.75 10.61 7.13 15.66 34.45 30.28 1.04 99.18 2023 Low (-20%) 11.14 6.66 4.48 10.44 25.06 18.79 2.09 67.51 Middle 13.92 8.32 5.60 13.05 31.32 23.49 2.61 84.39 High (+20%) 16.70 9.99 6.72 15.66 37.58 28.19 3.13 101.27 2024 Low (-20%) 10.44 6.24 4.20 11.14 17.40 19.49 2.78 61.25 Middle 13.05 7.80 5.25 13.92 21.75 24.36 3.48 76.56 High (+20%) 15.66 9.36 6.30 16.70 26.10 29.23 4.18 91.87 2025 Low (-20%) 9.74 5.83 3.92 11.83 22.27 17.40 2.78 64.03 Middle 12.18 7.28 4.90 14.79 27.84 21.75 3.48 80.04 High (+20%) 14.62 8.74 5.88 17.75 33.41 26.10 4.18 96.05 2026 Low (-20%) 9.74 5.83 3.92 11.83 20.88 16.01 3.48 61.94 Middle 12.18 7.28 4.90 14.79 26.10 20.01 4.35 77.43 High (+20%) 14.62 8.74 5.88 17.75 31.32 24.01 5.22 92.92 2027 Low (-20%) 9.74 5.83 3.92 11.83 20.18 14.62 4.87 61.25 Middle 12.18 7.28 4.90 14.79 25.23 18.27 6.09 76.56 High (+20%) 14.62 8.74 5.88 17.75 30.28 21.92 7.31 91.87 To tal Low (-20%) 112.40 67.22 45.19 106.49 201.14 119.71 16.70 556.45 Middle 140.51 84.02 56.48 133.11 251.43 149.64 20.88 695.57 High (+20%) 168.61 100.83 67.78 159.73 301.72 179.57 25.06 834.68 * Assuming for the middle estimates that number doses sold in the U.S. corresponds to 59.8% of total number of 62
doses sold in HIC markets (see Table S4). ** Implied by subtracting U.S. numbers from HIC total. 63
Source: GAVI (19) and own calculations. 64
7 We next come to variable costs that are composed of capital costs, costs for materials, costs for filling and 65
packaging, and labor costs. Based on variable costs, the price information presented in Tables S1 and S2, 66
and the number of units in Tables S5a and S5b, we can apply equation No. 1 to compute operating profits, 67
and accordingly equation No. 2 to compute the PDV of the stream of operating profits. 68
We first restate in Table S6a the calculation of Clendinen et al. (12) who annualize capital costs by assuming 69
a 5% real (no inflation) discount rate and a useful life of 10 years for equipment and 25 years for building. 70
The range of costs reflects uncertainty in estimates. In Table S6b we obtain variable capital costs by 71
dividing the total annualized capital costs by the average number of doses per year produced in the period 72
2010-2017, using the middle estimates in Table 5a. 73
Table S6a. Total investment costs and annualized capital costs for Gardasil-4, in million 2014 US$. 74
Low Estimate High Estimate
Investment
Building cost 100 166.7
Equipment cost 50 83.3
Total investment in building and equipment 150 250
Cost of capital
Annualized capital cost - Building 6.8 11.3
Annualized capital cost - Equipment 6.2 10.3
Total annualized capital cost 13 21.6
Source: Clendinen et al. (12). 75
76
Table S6b. Estimated variable capital costs (per year) for manufacturing one million doses of Gardasil-4. 77
Low estimate High estimate Variable building cost (annualized capital cost/28.55 million)* 238,204.71 395,840.18 Variable equipment cost (annualized capital cost/28.55 million)* 217,186.64 360,810.07 Total variable capital cost for one million doses (in 2014 US$) 455,391.35 756,650.25 Total variable capital cost for one million doses (in 2018 US$)** 428,067.87 711,251.24 * To obtain variable costs per million doses, variable capital costs from Table S6a are divided by the average number 78
of doses sold per year between 2010-2017 (i.e. 228.38/8=28.55 million, according to middle estimates in Table S5a). 79
** Numbers in row 3 deflated by price index for 2014, PI=0.942 (Table S0). 80
Source: Own calculations. 81
8 Costs for materials are derived in Table S7, whereas Table S8 presents the estimates of variable labor costs. 83
Table 3 of the main text shows total variable costs based on Tables S6b-S8. 84
Table S7. Estimated cost of materials for producing one million doses of Gardasil-4. 85 Materials (units) Units per package sold by life science companies Price per package (2013 US$) Number of units needed per million doses
Price for one million doses (2013 US$)* Yeast Media (kg) 0.02 100 7.11 35,532.47 Yeast Extract (kg) 1.00 300 88.83 26,649.35 Soy Protein (kg) 25.00 2,600 44.42 4,619.22 Magnesium Chloride (kg) 5.00 150 0.78 23.38 Thimerosal (g) 500.00 2,000 18.17 72.67 Glucose (kg) 2.50 250 88.83 8,883.12 Sodium Hydroxide (kg) 5.00 200 4.04 161.45 Galactose (kg) 5.00 700 177.66 24,872.73 PS--80 (kg) 25.00 360 10.09 145.37 Sodium Chloride (kg) 50.00 550 646.04 7,106.49 DTT (g) 100.00 1,000 38.96 389.61 Benzonase (ku) 25.00 180 299.81 2,158.60 MOPS (kg) 5.00 2,000 1.95 779.22 Ammonium sulfate (kg) 5.00 290 9.81 569.00 Microfiltration filters 1.00 10,000 0.10 974.03 Hollow--fiber membranes 1.00 9,000 0.10 876.62 PVDF—Millipore200 (3pk=3000L) 1.00 850 0.10 82.79 Poros 50HS beads 20x3ft (L) 10.00 22,500 34.77 78,222.56
Filling and packaging 310,000.00
High Estimate – Total listed retail prices (in 2013 US$) 502,118.67 High Estimate – Total listed retail prices (in 2018 US$)** 539,912.55 Low Estimate – Discounted at 40% (in 2018 US$)** 323,947.53
* The price for one million doses in the last column 4 is obtained by multiplying the numbers in column 2 and 3 and 86
dividing by the units per package in column 1 ** Deflated by price index for 2013, PI=0.928 (Table S0). 87
Source: Clendinen et al. (12) and own calculations. 88
89
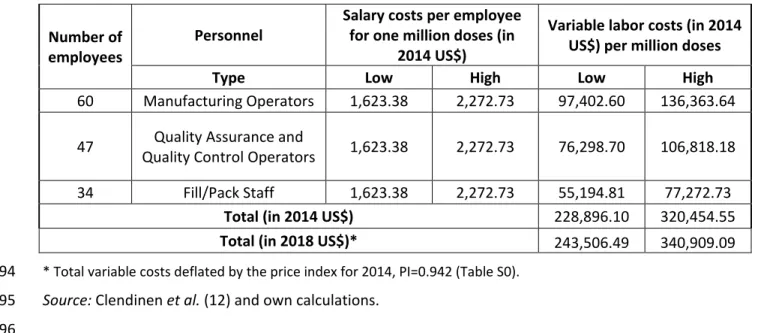
According to Clendinen et al. (12), it takes 152 personnel across different functions (management, 90
manufacturing, inspection and quality assurance) to manufacture two sets of batches or up to 30.8 million 91
doses of Gardasil-4 in one year. Based on their estimates, we arrive at Table S8 for variable labor costs. 92
9 Table S8. Variable labor cost for producing one million doses of Gardasil-4.
93
Number of
employees Personnel
Salary costs per employee for one million doses (in
2014 US$)
Variable labor costs (in 2014 US$) per million doses
Type Low High Low High
60 Manufacturing Operators 1,623.38 2,272.73 97,402.60 136,363.64 47 Quality Control Operators Quality Assurance and 1,623.38 2,272.73 76,298.70 106,818.18
34 Fill/Pack Staff 1,623.38 2,272.73 55,194.81 77,272.73
Total (in 2014 US$) 228,896.10 320,454.55
Total (in 2018 US$)* 243,506.49 340,909.09
* Total variable costs deflated by the price index for 2014, PI=0.942 (Table S0). 94
Source: Clendinen et al. (12) and own calculations. 95
96
Table S9 uses prices, number of units, and variable costs to calculate operating profits. 97
Table S9. Detailed calculation for Table 4 of operating profits for different countries and country groups 98
(a) 2007-2009, (b) 2010-2019 and (c) 2019-2028, applying equation No. 1. 99
a) Operating profits estimation, 2007-2009 100
2007 2008 2009
U.
S.
Price 131.55 131.72 138.03
Variable costs Low 1.00 1.00 1.00
High 1.59 1.59 1.59
# doses (in millions) Low 8.34 7.60 5.80
High 12.50 11.40 8.70
Profit (in million 2018 US$) Low 1,083.37 989.00 791.33 High 1,632.43 1,490.23 1,192.13 Oth er H IC Price 45.96 45.96 45.96
Variable costs Low 1.00 1.00 1.00
High 1.59 1.59 1.59
# doses (in millions) Low 7.34 6.70 5.36
High 11.02 10.06 8.04
Profit (in million 2018 US$) Low 325.84 297.45 237.81
High 495.26 452.10 361.47
Total profit (in million 2018 US$) High Low 1,409.21 2,127.69 1,286.45 1,942.33 1,029.15 1,553.59
101 102
10 b) Operating profits estimation, 2010-2019
103
2010 2011 2012 2013 2014 2015 2016 2017 2018 2019
U.
S.
Price 137.61 126.16 127.99 130.76 139.17 148.96 163.57 164.47 180.64 180.64
Variable costs Low 1.00 1.00 1.00 1.00 1.00 1.00 1.00 1.00 1.00 1.00
High 1.59 1.59 1.59 1.59 1.59 1.59 1.59 1.59 1.59 1.59
# doses (in millions)
Low 5.06 6.54 8.53 9.23 8.10 8.65 9.11 7.80 7.08 7.28
High 7.59 9.82 12.79 13.85 12.15 12.97 13.66 11.70 10.61 10.93 Profit (in million
2018 US$) Low 687.90 815.15 1,077.57 1,192.56 1,114.75 1,274.54 1,475.37 1,270.18 1,266.87 1,304.14 High 1,036.33 1,228.51 1,623.91 1,797.02 1,679.30 1,919.46 2,221.12 1,912.17 1,906.57 1,962.65 Oth er H IC Price 45.96 45.96 45.96 45.96 45.96 45.96 45.96 45.96 45.96 94.79
Variable costs Low 1.00 1.00 1.00 1.00 1.00 1.00 1.00 1.00 1.00 1.00
High 1.59 1.59 1.59 1.59 1.59 1.59 1.59 1.59 1.59 1.59
# doses (in millions)
Low 7.47 10.16 6.09 4.69 4.08 3.18 3.42 4.73 4.76 4.90
High 11.21 15.24 9.14 7.03 6.12 4.78 5.13 7.09 7.13 7.34
Profit (in million
2018 US$) High 503.80 Low 331.46 450.79 685.17 270.24 410.75 207.96 316.09 274.97 180.91 141.24 214.68 151.71 230.59 318.95 209.84 320.76 211.04 456.34 688.84
MI
C
Price 20.52 20.52 20.52 20.52 20.52 20.52 20.52 20.52 20.52 20.52
Variable costs Low 1.00 1.00 1.00 1.00 1.00 1.00 1.00 1.00 1.00 1.00
High 1.59 1.59 1.59 1.59 1.59 1.59 1.59 1.59 1.59 1.59
# doses (in millions)
Low 4.87 9.05 11.14 11.14 9.05 7.66 7.66 7.66 8.35 9.74
High 7.31 13.57 16.70 16.70 13.57 11.48 11.48 11.48 12.53 14.62 Profit (in million
2018 US$) Low 92.23 171.29 210.81 210.81 171.29 144.93 144.93 144.93 158.11 184.46 High 142.66 264.94 326.08 326.08 264.94 224.18 224.18 224.18 244.56 285.32 GA VI Price 4.69 4.69 4.69 4.69 4.69 4.69 4.69
Variable costs Low 1.00 1.00 1.00 1.00 1.00 1.00 1.00
High 1.59 1.59 1.59 1.59 1.59 1.59 1.59
# doses (in
millions) High Low 0.00 0.00 0.00 0.00 0.00 0.00 1.04 0.70 1.04 0.70 2.09 1.39 3.13 2.09 2.09 1.39 6.26 4.18 18.79 28.19 Profit (in million
2018 US$) High Low 0.00 0.00 0.00 0.00 0.00 0.00 3.85 2.16 3.85 2.16 7.70 4.31 11.55 6.47 7.70 4.31 23.10 12.94 103.94 58.21
In do ne sia a nd Ind ia Price 11.28 11.28 11.28 11.28
Variable costs Low 1.00 1.00 1.00 1.00
High 1.59 1.59 1.59 1.59
# doses (in millions)
Low 0.00 0.00 0.00 0.00 0.00 0.00 0.70 0.70 0.70 0.70
High 0.00 0.00 0.00 0.00 0.00 0.00 1.04 1.04 1.04 1.04
Profit (in million
2018 US$) High Low 0.00 0.00 0.00 0.00 0.00 0.00 0.00 0.00 0.00 0.00 0.00 0.00 10.73 6.75 10.73 6.75 10.73 6.75 10.73 6.75
Total profit (in
million 2018 US$) High 1,682.79 2,178.62 2,360.74 2,443.03 2,223.05 2,366.01 2,698.17 2,473.73 2,505.73 3,051.49 Low 1,111.59 1,437.22 1,558.63 1,613.49 1,469.10 1,565.02 1,785.23 1,636.02 1,655.70 2,009.89
104 105
11 c) Operating profit estimation, 2020-2028
106
2020 2021 2022 2023 2024 2025 2026 2027/2028
U.
S.
Price 180.64 180.64 180.64 180.64 180.64 180.64 180.64 180.64 Variable costs High Low 1.00 1.59 1.00 1.59 1.59 1.00 1.00 1.59 1.00 1.59 1.59 1.00 1.59 1.00 1.00 1.59 # doses (in millions) High Low 11.86 7.91 11.24 7.49 10.61 7.08 6.66 9.99 6.24 9.36 8.74 5.83 8.74 5.83 5.83 8.74
Profit (in million
2018 US$) High Low 1,415.92 1,341.40 1,266.87 1,192.35 1,117.83 1,043.31 1,043.31 2,130.88 2,018.73 1,906.57 1,794.42 1,682.27 1,570.12 1,570.12 1,043.31 1,570.12
Oth
er
H
IC
Price 94.79 94.79 94.79 94.79 94.79 94.79 94.79 94.79
Variable costs High Low 1.00 1.59 1.00 1.59 1.59 1.00 1.00 1.59 1.00 1.59 1.59 1.00 1.59 1.00 1.00 1.59 # doses (in millions) High Low 5.32 7.97 5.04 7.55 7.13 4.76 4.48 6.72 4.20 6.30 5.88 3.92 5.88 3.92 3.92 5.88
Profit (in million
2018 US$) High Low 495.46 747.89 469.38 708.53 669.16 443.30 417.23 629.80 391.15 590.44 551.08 365.07 551.08 365.07 365.07 551.08
MI
C
Price 20.52 20.52 20.52 20.52 20.52 20.52 20.52 20.52
Variable costs High Low 1.00 1.59 1.00 1.59 1.59 1.00 1.00 1.59 1.00 1.59 1.59 1.00 1.59 1.00 1.00 1.59 # doses (in millions) High Low 10.44 15.66 10.44 15.66 15.66 10.44 10.44 15.66 11.14 16.70 17.75 11.83 17.75 11.83 11.83 17.75
Profit (in million
2018 US$) High Low 197.64 305.70 197.64 305.70 305.70 197.64 197.64 305.70 210.81 326.08 346.46 223.99 346.46 223.99 223.99 346.46
GA
VI
Price 4.69 4.69 4.69 4.69 4.69 4.69 4.69 4.69
Variable costs High Low 1.00 1.59 1.00 1.59 1.59 1.00 1.00 1.59 1.00 1.59 1.59 1.00 1.59 1.00 1.00 1.59 # doses (in millions) High Low 27.84 41.76 21.58 32.36 34.45 22.97 25.06 37.58 17.40 26.10 33.41 22.27 31.32 20.88 20.18 30.28
Profit (in million
US$) High Low 153.99 86.23 119.34 66.83 127.04 71.14 138.59 77.61 53.90 96.24 123.19 68.99 115.49 64.68 111.64 62.52
In do ne sia an d Ind ia Price 11.28 11.28 11.28 11.28 11.28 11.28 11.28 11.28
Variable costs High Low 1.00 1.59 1.00 1.59 1.59 1.00 1.00 1.59 1.00 1.59 1.59 1.00 1.59 1.00 1.00 1.59 # doses (in millions) High Low 0.70 1.04 11.14 16.70 30.28 20.18 18.79 28.19 19.49 29.23 26.10 17.40 24.01 16.01 14.62 21.92
Profit (in million
2018 US$) High Low 10.73 6.75 107.92 171.74 311.28 195.61 182.12 289.81 188.86 300.54 268.34 168.63 246.87 155.14 141.65 225.41
Chi
na
Price 159.38 159.38 159.38 159.38 159.38 159.38
Variable costs High Low 1.00 1.59 1.00 1.59 1.00 1.59 1.00 1.59 1.00 1.59 1.00 1.59 # doses (in millions) High Low 0.00 0.00 0.00 0.00 1.04 0.70 2.09 3.13 2.78 4.18 4.18 2.78 5.22 3.48 4.87 7.31
Profit (in million
2018 US$) High Low 0.00 0.00 0.00 0.00 165.34 109.82 329.46 496.03 439.27 661.37 661.37 439.27 826.72 549.09 1,157.40 768.73
Total profit (in million
2018 US$) High 3,349.18 3,324.03 3,485.09 3,654.35 3,656.94 3,520.56 3,656.73 Low 2,201.99 2,183.17 2,284.38 2,396.40 2,401.83 2,309.26 2,401.28 2,605.27 3,962.10
Source: Own calculations based on Tables S1, S2, S5a, S5b and Table 3. 107
12 We next present the details for the estimation of fixed manufacturing costs that are displayed in Table 5. 108
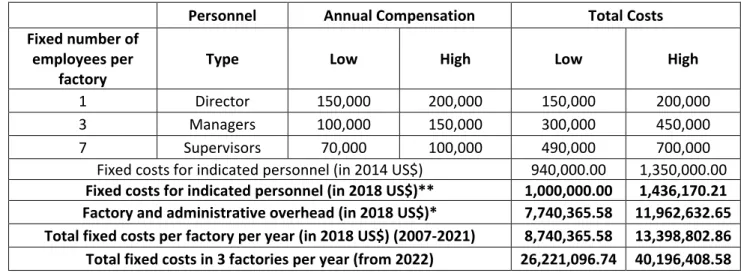
Table S10a starts with the derivation of annual fixed labor compensation, based on hourly compensation 109
and the required number of directors, managers and supervisors per factory as provided by Clendinen et 110
al. (12). Factory and administrative overhead (in 2018 US$) costs are computed in Table S10b, assumed to 111
be 45% of the sum of total labor costs plus the costs for materials. From 2022 onwards, the total fixed 112
manufacturing cost is based on three factories rather than one. The assumptions are discussed in Section 113
2.3 (main text). 114
Table S10a. Annual manufacturing fixed costs, in 2014 US$ – detailed derivation of Table 5. 115
Personnel Annual Compensation Total Costs
Fixed number of employees per
factory Type Low High Low High
1 Director 150,000 200,000 150,000 200,000
3 Managers 100,000 150,000 300,000 450,000
7 Supervisors 70,000 100,000 490,000 700,000
Fixed costs for indicated personnel (in 2014 US$) 940,000.00 1,350,000.00 Fixed costs for indicated personnel (in 2018 US$)** 1,000,000.00 1,436,170.21 Factory and administrative overhead (in 2018 US$)* 7,740,365.58 11,962,632.65 Total fixed costs per factory per year (in 2018 US$) (2007-2021) 8,740,365.58 13,398,802.86 Total fixed costs in 3 factories per year (from 2022) 26,221,096.74 40,196,408.58 * Derived in Table S10b. ** Deflated by price index for 2014, PI=0.942 (Table S0).
116
Source: Clendinen et al. (12) and own calculations. 117
118
Table S10b. Low and high estimate for the factory and administrative overhead, in 2018 US$. 119
Low estimate High estimate
Annual personnel cost Fixed* 1,000,000 1,436,170
Variable (cost of 1 million x 28.55)** 6,952,110 9,732,955 Cost of materials (cost of 1 million x 28.55)** 9,248,702 15,414,503
Total 17,200,812 26,583,628
Annual factory and administrative overhead costs (45% costs
of personnel and material) 7,740,366 11,962,633
* Manufacturing fixed costs are taken from Table S10a. ** For variable costs of labor and materials per one million 120
doses, see Table 3. These are multiplied by the average number of doses sold per year between 2010-2017 (i.e. 121
228.38/8=28.55 million, according to Table S3b). 122
Source: Clendinen et al. (12) and own calculations. 123
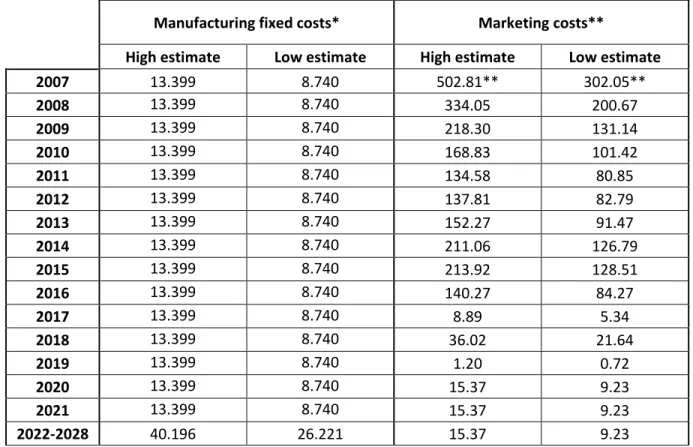
13 The information from Table S10a is taken over in the left panel of Table S11 to summarize manufacturing 124
fixed costs. The right panel of Table S11 presents the sum of DTCA spending in the U.S (90% of global DTCA 125
spending) and the estimates for marketing expenditure on health providers (150% and 50% of global DTCA 126
spending for the “high estimate” and “low” estimate, respectively); see Section 2.3. The information in 127
Table S11 is used by applying equation No. 3 to compute the PDV of the stream of fixed manufacturing 128
and marketing costs from 2020-2028 and 2007-2028. Results are presented in Table 6 of the main text. 129
Table S11. Estimated fixed manufacturing and marketing costs from 2007-2028, in million 2018 US$. 130
Manufacturing fixed costs* Marketing costs**
High estimate Low estimate High estimate Low estimate
2007 13.399 8.740 502.81** 302.05** 2008 13.399 8.740 334.05 200.67 2009 13.399 8.740 218.30 131.14 2010 13.399 8.740 168.83 101.42 2011 13.399 8.740 134.58 80.85 2012 13.399 8.740 137.81 82.79 2013 13.399 8.740 152.27 91.47 2014 13.399 8.740 211.06 126.79 2015 13.399 8.740 213.92 128.51 2016 13.399 8.740 140.27 84.27 2017 13.399 8.740 8.89 5.34 2018 13.399 8.740 36.02 21.64 2019 13.399 8.740 1.20 0.72 2020 13.399 8.740 15.37 9.23 2021 13.399 8.740 15.37 9.23 2022-2028 40.196 26.221 15.37 9.23
* From Table S10a. ** We assume that marketing spending on health providers is 50% (“low” scenario) and 150% 131
(“high” scenario) of the direct to consumer advertising (DTCA) spending, respectively, and that 90% of the marketing 132
spending is in the U.S. Moreover, marketing costs in 2007 (the first full year Gardasil was sold) include costs of 2006 133
and the annual marketing costs for the period 2020-2028 equals the average of the annual marketing costs from 134
2017-2019. DTCA spending originally in current Euro. All numbers converted to current US$ using the exchange rate 135
from Thomson Reuters and then deflated by PI from Table S0. 136
Source: Clendinen et al. (12), ‘The Nielsen Company’ (DTCA spending for the U.S.), and own calculations. 137
138
We calculate R&D costs for each phase as given in Table 8 as follows. We use the bounds of the cost range 139
per subject provided by Light et al. (15) as given in Table S12 and multiply them by the number of subjects 140
14 as given in Table S14a for Gardasil-4 and S14b for Gardasil-9. Analogously, we use the site cost and study 141
cost estimates by Sertkaya et al. (21) given in Table S13 jointly with Tables S14a and S14b. As Sertkaya et 142
al. (21) originally provide average costs from 2004-2012 in current US$, we use the price index PI in Table 143
S0 for the median year 2008 to calculate the corresponding costs in 2018 US$. 144
Table S12. Cost per subject per clinical trial phase 145
Cost per subject
(in 2008 US$) Cost per subject (in 2018 US$)*
Low High Low High
Phase I 100.00 400.00 116.28 465.12
Phase II 300.00 400.00 348.84 465.12
Phase III 2,000.00 3,000.00 2,325.58 3,488.37 * Deflated by PI=0.86 for year 2008 (Table S0).
146
Source: Light et al. (15). 147
148
Table S13. Site and study costs estimates for each phase of the clinical trial. 149
Phase I Phase II Phase III
Site costs
Recruitment 51,904.00 233,729.00 395,182.00 Site retention 193,615.00 1,127,005.00 1,305,361.00 Administrative staff 237,869.00 1,347,390.00 2,321,628.00 Monitoring 198,896.00 1,083,186.00 1,624,874.00 Total (in 2008 US$) 682,284.00 3,791,310.00 5,647,045.00 Total (in 2018 US$) 793,353.49 4,408,500.00 6,566,331.40
Study costs
Data management 50,331.00 59,934.00 39,047.00 IRB approvals 11,962.00 60,188.00 114,118.00
IRB amendments 1,094.00 1,698.00 1,919.00
Source data verification 326,437.00 406,038.00 400,173.00 Overheads 528,685.00 1,741,811.00 2,541,313.00 Other costs 1,139,887.00 4,003,615.00 5,967,193.00 Total (in 2008 US$) 2,058,396.00 6,273,284.00 9,063,763.00 Total (in 2018 US$)* 2,393,483.72 7,294,516.28 10,539,259.30 * Deflated by PI=0.86 for year 2008 (Table S0).
150
Source: Sertkaya et al. (21). 151
15 Table S14a. Estimated costs of R&D from phase I to phase III clinical trial for Gardasil-4, in 2018 US$. 152 Pha se # Description # of subjs Costs estimation
per subject* Calculated costs
Low High Low High
Pha
se
I
1***
• In one study subjects were given four dose formulations of HPV11 L1 VLP vaccine (10, 20, 50, and 100 ug). There were 28 subjects per dose level and 28 for the placebo group
• In the other study three different formulations were used to test HPV16 L1 VLPs: 10 ug (13 active and four placebo), 40 ug (45 active and 15 placebo) and 80 ug (24 active and eight placebo). • Source: (88)
249 116 465 28,953 115,814
2***
• 40 women, aged 16-23 years, were randomly assigned (2:1 vaccine to placebo ratio) to receive either HPV18 L1 VLP vaccine or placebo.
•Source: (89)
40 116 465 4,651 18,605
3***
• Healthy nonpregnant women aged 18 to 26 years old were assigned to study groups to receive placebo or a 3-dose regime of the different HPV 16 L1 VLP vaccine dosage of 10 μg (n=112), 20 μg (n=105), 40 μg (n=104), or 80 μg (n=107).
• Source: (90)
480 116 465 55,814 223,256
4
• Females aged 9-26 year were vaccinated with a single dose of Gardasil in an open label study to evaluate safety and tolerability of the vaccine. • From: March 2008-April 2008
• ID: NCT00635830
40 116 465 4,651 18,605
Total spent on subjects on phase I 94,070 376,279
Total spent on sites (number of studies x 793,353.49**) 3,173,414 3,173,414
Total spent of study costs (number of studies x 2,393,483.72**) 9,573,935 9,573,935
Total spent on phase I clinical trials 12,841,419 13,123,628
Ph
as
e
II
1
• Young women aged 16-23 years old were randomly assigned to receive three doses of placebo (n=1198) or HPV-16 virus-like–particle vaccine (n=1194)
• From: September 1999- March 2004 • ID: NCT00365378
2,392 349 465 834,419 1,112,558
2
• A total of 831 women aged 16-23 years were vaccinated with one of the three formulations quadrivalent HPV (Types 6/11/16/18) L1 virus-like particle (VLP) (each of the 3 groups had 275-280 subjects) or received one of the two placebo formulations (n=275). Dose escalation assessment (n=52).
• From: May 2000-May 2004 • ID: NCT00365716
16 3
• Women aged 18-26 years were assigned to receive Gardasil vaccination (n=509) or placebo (n=512)
• From: June 2006-September 2009 • ID: NCT00378560
1,021 349 465 356,163 474,884
4
• Evaluate the effectiveness of Gardasil in men aged 27-45 who have completed 4 years of observation in HPV infection in men • Duration: December 2012 - October 2019 • ID: NCT01432574
150 349 465 52,326 69,767
5
• The immunogenicity, safety and tolerability of the quadrivalent vaccine was assessed in females Aged 9-17 years.
• From: December 2006 - September 2009 • ID: NCT00411749
107 349 465 37,326 49,767
Total spent on subjects on phase II 1,684,186 2,245,581 Total spent on sites (number of studies x 4,408,500.00**) 22,042,500 22,042,500
Total spent of study costs (number of studies x 7,294,516.28**) 36,472,581 36,472,581
Total spent on phase II clinical trials 60,199,267 60,760,663
Ph
as
e
III
1
• Women aged 16-24 year were randomly assigned to receive 3 doses of the quadrivalent vaccine (2723) or placebo (n=2732).
• From: December 2001-January 2009; ID: NCT00092521
5,455 2,326 3,488 12,686,047 19,029,070
2
• Women aged 16-23 were randomized (1:1:1:1) to receive three doses of quadrivalent HPV-6/11/16/18 vaccine co-administered with HBV vaccine, quadrivalent vaccine with HBV-vaccine matched placebo, HBV vaccine with HPV-vaccine matched placebo, or HPV-vaccine matched placebo and HBV-vaccine matched placebo. • From: December 2001 - June 2004 • ID: NCT00517309
1,871 2,326 3,488 4,351,163 6,526,744
3
• Women aged 16-23 years in a phase III study to compare the immunogenicity and safety of the quadrivalent Gardasil and Monovalent HPV 16 vaccine.
• From: June 2002 - June 2004 • ID: NCT00092482
3,882 2,326 3,488 9,027,907 13,541,860
4
• Women aged 15-26 were randomly assigned 1:1 to receive 3 doses of the quadrivalent vaccine or placebo
• From: June 2002 - July 2007 • ID: NCT00092534
17 5
• Women age 10-23 years were randomly assigned to receive placebo or Gardasil to assess the immune response to the 4 components of the vaccine.
• From: December 2002 - September 2004 • ID: NCT00092495
3,055 2,326 3,488 7,104,651 10,656,977
6
• Adolescents aged 9 to 15 years were randomly assigned 2:1 to receive HPV4 vaccine or saline placebo. On the 30th, the placebo group (n = 482) received the same regimen of HPV4 vaccine and both cohorts were followed through month 96.
• From: October 2003 - November 2005 • ID: NCT00092547
1,781 2,326 3,488 4,141,860 6,212,791
7
• Women aged 24-45 years were receive 3 doses of Gardasil (n=1911) or placebo (1908).
• ID: NCT00090220
• From: June 2004 - May 2009
3,819 2,326 3,488 8,881,395 13,322,093
8
• Heterosexual males aged 16-24 (n=3463) and homosexual men aged 16–24 years (n= 602) were randomly assigned to receive three doses of Gardasil (n=2032) or placebo (n=2033). • From: September 2004 - July 2009 • ID: NCT00090285
4,065 2,326 3,488 9,453,488 14,180,233
9
• Females aged 9–23 years were randomly assigned to receive three doses of Gardasil (n=117) or placebo (n=59).
• From: October 2005 - June 2006 • ID: NCT00157950
176 2,326 3,488 409,302 613,953
10
• Adolescents (394 boys and 648 girls) aged 10-17 years were randomly assigned in a 1:1 ratio to receive: 3 doses of Gardasil with one dose of Menactra and Adacel (concomitant), 3 of Gardasil with one dose of Menactra and Adacel
(nonconcomitant).
• From: April 2006 - April 2007 • ID: NCT00325130
1,042 2,326 3,488 2,423,256 3,634,884
11
• Teenage boys and girls aged 11-17 were enrolled in an open-label study in which all subjects received three doses of GARDASIL and one of REPEVAX.
• From: May 2006-May 2007 • ID: NCT00337428
843 2,326 3,488 1,960,465 2,940,698
12
• Women aged 9-15 years participated in the study to evaluate the safety and tolerability of Gardasil.
• From: May 2007-February 2008 • ID: NCT00380367
18 13
• Chinese females aged 9-45 years (n=500) and males aged 9 to 15 years (n=100) were randomly assigned in a 1:1 ratio to receive either 3 doses of Gardasil or aluminum-containing placebo. • From: July 20, 2008-February 28, 2009 • ID: NCT00496626
600 2,326 3,488 1,395,349 2,093,023
14
• Females aged 20-45 years were assigned to receive three doses of Gardasil or placebo to test the safety and effectiveness of the vaccine. • From: December 31, 2008- May 11, 2012 • ID: NCT00834106
3,006 2,326 3,488 6,990,698 10,486,047
15
• Sub-Saharan females aged 9-26 were enrolled in the study to evaluate safety, tolerability and immunogenicity of the three dose Gardasil. Thirty females ages 13-15 and 120 females ages 16-26 received the three dose Gardasil. In addition, girls aged 9-12 years were randomized in a 4:1 ratio to receive either Gardasil (n = 80) or placebo (n = 20).
• From: March 2011 - April 2013 • ID: NCT01245764
250 2,326 3,488 581,395 872,093
16
• Open label study to evaluate Gardasil`s safety and effectiveness in females aged 16- to 26 years. • From: November 2011-August 2016
• ID: NCT01544478
1,030 2,326 3,488 2,395,349 3,593,023
17
• Japanese males aged 16-26 year were enrolled in a study to evaluate the efficacy and tolerability of Gardasil.
• From: June 2013 - August 2017 • ID: NCT01862874
1,124 2,326 3,488 2,613,953 3,920,930
18
• Evaluate the immunogenicity, safety, and tolerability of Gardasil in females aged 9-26 years • Duration: August 2018 - October 2023
• ID: NCT03493542
766 2,326 3,488 1,781,395 2,672,093
19
• Evaluate Two-dose schedule of Gardasil-4 in 11-year-old Boys
• Duration: February 2015 - December 2015 • ID: NCT02382900
500 2,326 3,488 1,162,791 1,744,186
20
• Evaluate tolerability and immunogenicity of a 3-dose regimen of Gardasil administered to healthy married females aged 16-23 years
• Duration: October 2009 - October 2013 • ID: NCT00733122
600 2,326 3,488 1,395,349 2,093,023
21
• Boys aged 9-15 years were enrolled in an open label two-part study in which part 1 assessed immunogenicity and tolerability of Gardasil up to Month 7 whereas part 2 assessed long-term immunogenicity and safety (Month 7-Month 30). • From: November 2015 - August 2018
• ID: NCT02576054
100 2,326 3,488 232,558 348,837
Total spent on subjects on phase III 107,539,535 161,309,302 Total spent on sites (number of studies x 6,566,331.40**) 137,892,959 137,892,959
19
Total spent of study costs (number of studies x 10,539,259.30**) 221,324,445 221,324,445
Total spent on phase III clinical trials 466,756,940 520,526,707
Total cost of all phases 539,797,626 594,410,998
* From estimates displayed in Table S12. ** From estimates displayed in Table S13. *** Clinical trial was not 153
registered on www.clinicaltrial.gov thus they do not have an ID. However, results were published in peer reviewed 154
journals cited in the description (“Source”). 155
156
Table S14b. Estimated costs of R&D from phase I to phase III clinical trial for Gardasil-9, in 2018 US$. 157 Pha se # Description # of subjs Costs estimation
per subject* Calculated costs
Low High Low High
Pha
se
I
1
• Evaluate the safety and tolerability of octavalent HPV L1 VLP vaccine formulated with amorphous aluminum hydroxysulfate and ISCOMATRIX in females aged 18-24 years
• Duration: April 2006 - November 2009 • ID: NCT00851643
158 116 465 18,372 73,488
Total spent on subjects on phase I 18,372 73,488
Total spent on sites (number of studies x 793,353.49**) 793,353 793,353
Total spent of study costs (number of studies x 2,393,483.72**) 2,393,484 2,393,484
Total spent on phase I clinical trials 3,202,637 3,250,037
Ph
as
e
II
1
• Determine immunogenicity, safety and tolerability of Gardasil-4 and 9 vaccine in young cancer survivors aged 9-26 years
• Duration: July 2012 - November 2020 • ID: NCT01492582
1252 349 465 436,744 582,326
2
• Females aged 16-23 years were enrolled in a study to evaluate the tolerability and immunogenicity of the 3-dose vaccine.
• From: December 2005 - August 2007 • ID: NCT00260039
680 349 465 237,209 316,279
3
• Compare safety and immunogenicity of V505 HPV vaccine candidate and Gardasil-4 in females 16-26 years
• Duration: October 2007-May 2011 • ID: NCT00520598
511 349 465 178,256 237,674
4
• Examine tolerability and immunogenicity HPV L1 VLP vaccine candidate administered Concomitantly with Gardasil in females aged 16-26.
• Duration: October 2007 - May 2009 • ID: NCT00551187
620 349 465 216,279 288,372
Total spent on subjects on phase II 1,068,488 1,424,651
Total spent on sites (number of studies x 4,408,500.00*) 17,634,000 17,634,000
Total spent of study costs (number of studies x 7,294,516.28*) 29,178,065 29,178,065
20 Ph as e III 1
• A Phase III Open-label Safety and Immunogenicity Study of GARDASIL™9 Administered to 9- to 26-Year-Old Females and Males in Vietnam
• Duration: June 2018 - January 2019 • ID: NCT03546842
200 2,326 3,488 465,116 697,674
2
• This study will assess the safety and
immunogenicity of GARDASIL®9 (V503) in 27- to 45-year-old women
• Duration: September 2017 - November 2018 • ID: NCT03158220
1212 2,326 3,488 2,818,605 4,227,907
3
• Examine the acceptability, uptake and
immunogenicity of the vaccine in the postpartum setting in women 16 years to 26 years
• Duration: November 2018 - July 2019 • ID: NCT03451071
200 2,326 3,488 465,116 697,674
4
• Assess occupational exposure to Human Papilloma Virus (HPV) and prophylactic vaccination in
healthcare workers aged 27-69 • Country: USA
• Duration: February 2018 - November 2018 • ID: NCT03350698
100 2,326 3,488 232,558 348,837
5
• Evaluate the Immunogenicity of the nonvalent vaccine against Human Papillomavirus in men (age 18-36 years) infected by HIV who have sex with men. • Duration: October 2018 - December 2021
• ID: NCT03626467
166 2,326 3,488 386,047 579,070
6
• Assess the efficacy of HPV vaccine in reducing high-grade cervical lesions in patients with HPV and HIV infections in females aged 25 and older
• Duration: January 2019 - October 2021 • ID: NCT03284866
536 2,326 3,488 1,246,512 1,869,767
7
• Assess the safety and immunogenicity of a 2-dose regimen of Gardasil-9 (V503) in boys and girls 9 to 14 years of age and in young women aged 16-26 years • Duration: November 2013 - August 2018
• ID: NCT01984697
1518 2,326 3,488 3,530,233 5,295,349
8
• Assess safety, immunogenicity and long-term effectiveness Gardasil-9 in preventing cervical cancer and related precancers caused by HPV types covered in the vaccine in females aged 16-26 years
• Duration: January 2016 - January 2024 • ID: NCT02653118
4453 2,326 3,488 10,355,814 15,533,721
9
• Evaluate immunogenicity and tolerability of Gardasil-9 administered Concomitantly with Menactra and Adacel in boys and girls aged 11-15 year
• Duration: October 2009 - February 2011 • ID: NCT00988884
21 10
• Evaluate tolerability of Gardasil-9 in females aged 12-26 years who were previously vaccinated with GARDASIL-4
• Duration: February 2010 - November 2015 • ID: NCT01047345
924 2,326 3,488 2,148,837 3,223,256
11
• Evaluate if Gardasil-9 induces non-inferior
Geometric Mean Titres (GMTs) for serum anti-HPV 6, 11, 16, and 18, compared to GARDASIL-4 in males aged 16 – 26 year
• Duration: March 2014 - April 2015 • ID: NCT02114385
500 2,326 3,488 1,162,791 1,744,186
12
• Compare immunogenicity and tolerability of Gardasil-4 and 9 in females ages 9-15 years • Duration: February 2011 - December 2011 • ID: NCT01304498
600 2,326 3,488 1,395,349 2,093,023
13
• Evaluate whether if first dose of Gardasil-9 concomitantly administrated with REPEVAX™ is well tolerated and equally immunogenic compared to administration of REPEVAX a month after Gardasil-9 first dose
• Countries: Finland, Germany, Denmark, Thailand, Belgium, Austria
• Duration: April 2010 - June 2011 • ID: NCT01073293
1054 2,326 3,488 2,451,163 3,676,744
14
• Evaluate safety, tolerability and Immunogenicity of Gardasil-9 in Japanese girls aged 9-15 year
• Duration: January 2011 - August 2013 • ID: NCT01254643
100 2,326 3,488 232,558 348,837
15
• Assess immunogenicity and tolerability of Gardasil-9 in males and females aged Gardasil-9-15 years
• Duration: August 2009 - December 2020 • ID: NCT00943722
3074 2,326 3,488 7,148,837 10,723,256
16 • Compare the safety, efficacy, and immunogenicity of Gardasil-4 and 9 in females aged 16-26 years old. • Duration: September 2007 - July 2016
• ID: NCT00543543
14840 2,326 3,488 34,511,628 51,767,442
17
• Evaluate immunogenicity and tolerability of Gardasil-9 in males and females aged 16-26 years • Duration: October 2012 - August 2014
• ID: NCT01651949
2520 2,326 3,488 5,860,465 8,790,698
Total spent on subjects on phase III 77,297,674 115,946,512 Total spent on sites (number of studies x 6,566,331.40**) 111,627,634 111,627,634
Total spent of study costs (number of studies x 10,539,259.30**) 179,167,408 179,167,408
Total spent on phase III clinical trials 368,092,716 406,741,553
Total costs of all phases 419,178,479 458,238,595
* From estimates displayed in Table S12. ** From estimates displayed in Table S13. 158
159 160