Publisher’s version / Version de l'éditeur:
Vous avez des questions? Nous pouvons vous aider. Pour communiquer directement avec un auteur, consultez la
première page de la revue dans laquelle son article a été publié afin de trouver ses coordonnées. Si vous n’arrivez pas à les repérer, communiquez avec nous à [email protected].
Questions? Contact the NRC Publications Archive team at
[email protected]. If you wish to email the authors directly, please see the first page of the publication for their contact information.
https://publications-cnrc.canada.ca/fra/droits
L’accès à ce site Web et l’utilisation de son contenu sont assujettis aux conditions présentées dans le site LISEZ CES CONDITIONS ATTENTIVEMENT AVANT D’UTILISER CE SITE WEB.
Internal Report (National Research Council of Canada. Institute for Research in Construction), 2000-02-01
READ THESE TERMS AND CONDITIONS CAREFULLY BEFORE USING THIS WEBSITE.
https://nrc-publications.canada.ca/eng/copyright
NRC Publications Archive Record / Notice des Archives des publications du CNRC :
https://nrc-publications.canada.ca/eng/view/object/?id=cd2fc964-87fa-44f5-9446-88d674095306 https://publications-cnrc.canada.ca/fra/voir/objet/?id=cd2fc964-87fa-44f5-9446-88d674095306
NRC Publications Archive
Archives des publications du CNRC
For the publisher’s version, please access the DOI link below./ Pour consulter la version de l’éditeur, utilisez le lien DOI ci-dessous.
https://doi.org/10.4224/20331239
Access and use of this website and the material on it are subject to the Terms and Conditions set forth at
Equations and Theory of the Simple Correlation Model of FIERAsystem
Feng, P.; Hadjisophocleous, G. V.; Torvi, D. A.
7 - ~ ~ -
ser
ANALYZED
l
THl
i
National Research Conseil national1
R 4 2 7 Council Canada de recherche CanadaInstitute for lnstitut de
Aerospace Research recherche aerospatiale
Equations and Theory of the Simple
Correlation Model of FIERAsystem
P. Feng,
G.V.
Hadjisophocleous, p h . ~ . , P.Eng. and D.A. Torvi, P~.D., P.Eng.Internal Report No. 779
Date of Issue, February 2000 . . ,1;e,r.,!rr-..T*L15ac !:
5.
&S@R.&irV
::
MAR
29 2KfJFlERAsystem THEORY REPORT: SIMPLE CORRELATION MODEL
P. Feng, G.V. Hadjisophocleous and D.A. TOM ABSTRACT
The Simple Correlations Model of FlERAsystem consists of a number of equations and models that are commonly used by fire protection engineers to quickly estimate various fire characteristics. This report describes the equations used in the Simple Correlations Model, and provides references where more information can be obtained on the underlying theory for each of the equations.
NOMENCLATURE Notation A C
c1
C8 Cl0 c11 c12 CFc,
D d F 9 H h hc h, K k L m.
m N P Q QP q" q R r S SP t T U.
v
v
v VF W X YYl
z Area, m2Ratio of area to square of distance Constant
Constant Constant Constant Constant
Conversion factor, min/MJ/m2 Specific heat, kJ1kg.K
Diameter, m Distance, m View factor
Acceleration due to gravity, m/$ Height, m
Heat transfer coefficient, kW/m2.~ Heat of combustion, kJ/kg Heat of vaporization, kJ/kg Configuration parameter Thermal conductivity, kW1m.K Fire load, kg Mass, kg
Mass flow rate, kg/s Total number
Absolute pressure, Pa
Heat release rate of the fire, kW Flow of people, people/min/door Heat flux, kW/m2
Fire load density, M J / ~ ' Gas constant, J/kg K
Stoichiometric airlfuel mass ratio Ratio of height to width (or vice-versa) Spread parameter, m.K?s
Time, s
Temperature, K or "C
Fraction of unprotected openings Volume rate of smoke production, m3/s Flame spread velocity, mls
Speed, mlmin Ventilation factor Width, m
Depth, m
Fraction of radiation losses Fraction of other losses Height, m
Subscripts
a actual abs absolute air air btm bottom
c combustible, calorific, convective CP plume centreline cr critical door door e equivalent
eff
effective ent entrainmentexitdoor through exit openings exit-leaves exit door leaves f floor
fb fully developed burning fl flame fo flashover 9 gas Qr growth h horizontal ig ignition max maximum o opening
od onset of the decay phase P penetration
people total evacuating population PI plume
r radiant riser riser of stairs s surface T total top top
tread tread of stairs
u unprotected openings v vertical
w weighted
Greek Svmbols
fire growth coefficient for t2fire, kw/s2
characteristic mass loss rate per unit area, kg/m%in density, kg/m3
thickness of compaltment lining material, m flame absorption coefficient, 1Im
combustion efficiency ambient
adjustment factor for considering mobile but slow moving persons
FlERAsystem THEORY REPORT: SIMPLE CORRELATION MODEL by
P. Feng, G.V. Hadjisophocleous and D.A. TOM
1. INTRODUCTION
As Canada and other countries move from prescriptive-based building codes to
performancdobjective-based codes, new design tools are needed to support these new
codes. One such tool is the cornouter model FiRECAMm. which has been develooed over the past decade by the ~ i r e k i s k Management prog& of the Institute for
'
Research in Construction at the National Research Council of Canada (NRC).
FiRECAMm is a computer model for evaluating fire protection systems in residential and office buildings that can be used to compare the expected safety and cost of candidate fire protection options.
To evaluate fire protection systems in light industrial buildings, a new computer model is being developed. This model, whose current focus is aircraft hangars and warehouses, is based on a framework that allows designers to establish objectives, select fire scenarios that may occur in the building and evaluate the impact of each of the selected scenarios on i i e safety, properly protection and business interruption. The new computer model is called FlERAsystem, which stands for Fire Evaluation and Risk Assessment system.
FlERAsvstem uses time-de~endent deterministic and orobabilistic models to evaluate the imbact of selected firescenarios on life, property'and business interruption. The main FlERAsvstem submodels calculate fire develooment, smoke movement through a building time of failure of building elements and occupant response and evacuation. In addition, there are submodels dealing with the effectiveness of fire suppression systems and the response of fire departments.
Simple Correlation Model (SCOR) is a submodel of FlERAsystem which is used to quickly estimate the various aspects of fire characteristics based on simple fire
engineering equations and models. The current version of the Simple Correlation Model contains the following procedures:
Heat Release Rate for a $Fire Heat Release Rate for a Pool Fire
Heat Release Rate for a Fully-Developed Fire Thomas Flashover Correlation
McCaffrey Flashover Correlation Heat Release Rate of Decay Flame Height
Lateral Flame Spread
Plume Centreline Temperature Average Plume Temperature Entrained Mass Flow Rate Plume Filling Rate
14) Plume Rise 15) Plume Diameter ~ ~~
16j Comparbnent Temperature during Pre-Flashover 171 Com~arbnent Temperature during Post-Flashover
-
18) volume of Smoke '19) Smoke Filling Height and Time (Steady or Unsteady Fire with No Exhaust) 20) Mass Flow Exhaust (Steady Fire with Exhaust)
21) Atrium Smoke Temperature 22) Ceiling Jet Temperature
23) Radiant Ignition of Adjacent Fuel 24) Egress Times
25) Law's Fire Resistance Time 26) Spatial Separation
The above procedures are grouped in four categories as shown in Figure 1 .l. The purpose of this report is to present all of the theoretical underpinning for the
procedures in the Simple Correlation Model (SCOR) model in FlERAsystem.
References for each of the correlations are given; these should be consulted for details on the assumptions, applicability and limitations of each correlation.
eat Release Rate for a Plume centerline
Heat Release Rate for Ehttaheci Mass Row
Figure 1.1 Simple Correlation Components
2. FIRE DEVELOPMENT
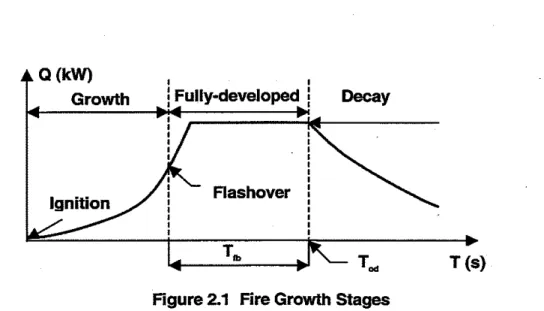
A typical fire may go through four stages: fire ignition, the pre-flashover or growth period, the post flashover or fully developed stage and the decay stage, as shown in Figure 2.1. The transition from the growth stage to the fully developed stage is called flashover.
I
y-developed
j
Decayk A
T* k c Td b T
(s)
Figure 2.1 Fire Growth Stages
An estimate of the heat release rate of the fire is very important when solving fire science problems. Usually, the heat release rate is estimated using experimental results or empirical correlations. Under the Fire Development submenu, the heat release rates at diierent stages can be selected, as well as flame height and lateral flame spread calculation methods:
Heat release rate for a f-fire; Heat release rate for a pool fire;
Heat release rate for a fully developed fire; Thomas and McCaffrev flashover correlations; Heat release rate of d&y;
flame height;
Lateral flame spread.
2.1 Heat Release Rate for a
f
FireA
f
fire is one of the most commonly used estimates for fire growth. It assumes that the fire growth rate is proportional to the square of the elapsed time. The fire growth rate is defined in terms of the fire growth coefficient, a, which depends on the fuel type and arrangement of the fuel. The heat release rate is given by[I]:
Where: Q = heat release rate of the fire, kW;
t =time, s;
Table 2.1 Typical Fire Growth Rate Coefficient [1,2]
2.2 Heat Release Rate for a Liquid Pool Fire
Medium Fast Ultrafast
For a burning pool of liquid fuel, Burgess and Hertzberg [3] proposed the
following equation, which relates the fire heat release rate to fuel properties and fire size:
Where: D = diameter of the fire, m;
h, = heat of vaporization of the fuel, W g ;
K = absorption coefficient of the flame, m-', (for hydrocarbons K = 1.55 m-');
B
= characteristic mass loss rate per unit area (for hydrocarbonsB
= 0.051 kg/m2min);h, = heat of combustion of the fuel, kJ/kg. 0.01 172
0.0469 0.1876
The above equation can be used in compartments in the very early pre-flashover stages of a fire. It can also be used for pool fires in open spaces.
floors.
Solid wooden furniture such as desks, cotton/polyester spring mattress, etc.
Light wooden furniture such as plywood wardrobes, full mail bags, plastic foam, stacked timber pallets.
Upholstered furniture, some pool fire, lightweight drapes.
2.3
Heat
Release Rate for a Ventilation Controlled, Fully Developed FireThe fully developed fire stage occurs after flashover. It is characterized by very high temperatures and heat release rate. Assuming that all the air is burnt in a
compartment, Thomas et al[4] proposed the following equations to calculate the heat release rate for a ventilation controlled, fully developed fire.
Where: h, =the heat of combustion of the fuel (kJ/kg);
r =the stoichiometric airfiuel mass ratio;
m e =the mass flow rate of air into the compartment (kgls), which is calculated as follows:
Where: A = the ventilation area (m2);
Ho
=the height of a single opening or set of openings at the same levelabove the floor and all of the same height.
Equation 2.4 assumes that all the air is burnt in the compartment and, therefore, should be used with caution where external wind conditions are not still.
2.4 Heat Release Rate of Decay
During the decay stage, which is assumed to start when 80% of the fuel has been consumed, the burning rate of a fire is assumed to decrease at a linear rate. The heat release rate during the decay phase, Q (t), as a function of time, can be estimated using the following equation [5]:
Where: t, = duration of fully developed burning (see Figure 2.1), s;
t ~ a = time of onset of the decay phase (see Figure 2.1), s;
= heat release during fully developed burning phase, kW. Equation (2.5) assumes that there is no suppression of the fire.
2.5 Thomas and McCaffrey Flashover Correlations
Two popular methods for predicting the heat release rate for flashover are included in FIERAscor. One was proposed by Thomas [6] and the other was developed by McCaffrey, et al
m.
Thomas [6] suggested that a hot gas layer temperature of 600°C was necessary for a flashover to occur, and that the minimum heat release rate necessary to cause flashover can be correlated as follows:
Where:
Qfi
= rate of heat release at flashover, kW;AT = total sutface area of the compartment minus ventilation openings, m2;
= A~l3+An,r+~,,-&;
A,
= area of opening, m2;Ho
= height of opening, m.McCaffrey et a1
m
predict the heat release rate necessary for flashover by using the equation for the temperature of the hot gas layer in the pre-flashover phase of a compartment fire:Where: g = acceleration due to gravity, m/s2;
CP = specific heat of gas, kJ/kgK;
P-
= ambient air density, kg/m3;Tg
=temperature of the upper gas layer, K;T-
= ambient temperature, K;h, = effective heat transfer coefficient, kW/m2-K (see Equation 2.8).
h, = k16 te,
'
tph,
= (k-p+~,lt,,)"~ ,,t I t , t, =(p.~,Ik)(S12).~Where: k =thermal conductivity of compartment lining material, kWlm-K;
6 =thickness of compartment lining material, m;
P
= density of compartment lining material, kg/m3;CP = specific heat of the compartment lining material, kJ/kgK;
t q =time of exposure;
ZP =thermal penetration time, s.
2.6 Mean Flame Height
Flame height is useful to determine the potential ignition of adjacent fuel and to detect the flame. It can be estimated using the heat release rate. Heskestad [8] proposed that the mean flame height, /,,, (m), taken as a mean value above the fire source, could be estimated using the following equation:
Where: D = diameter or effective diameter of the fire source, m;
Q
= heat release rate of the fire, W .The coefficient 0.235 in the above equation comes from the assumption that the atmospheric temperature is 293 K and the atmos~heric Dressure is 101.3 kPa.
~ ~ u a t k n 2.9 is invalid if the atmospheric tempeldture and pressure deviate significantly from these values. Equation 2.9 is also invalid or unpractical for the small values of heat release rate, which give negative flame heights.
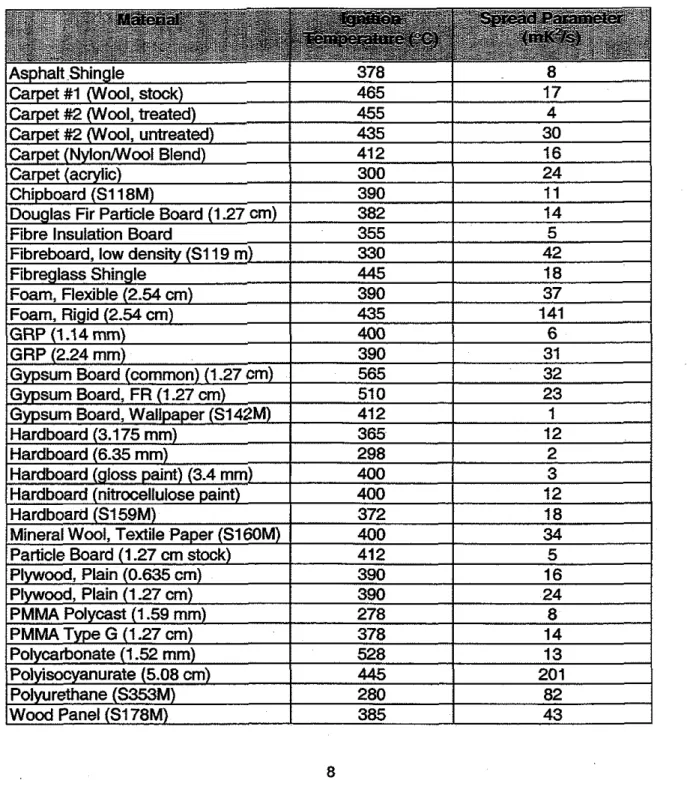
2.7 Lateral Flame Spread
The lateral or downward spread of a fire along a combustible surface is estimated using the spread velocity, V (m/s), and is given by [9]:
Where: SP = an experimentally determined spread parameter (m.~=/s);
Tit = ignition temperature PC);
T,
= surface temperature prior to ignition PC).The spread parameter and ignition temperatures for some materials can be found in Table 2.2. These values were calculated from experimental data, as described by Quintiere and Harkleroad [9].
'\
',
3. PLUME CORRELATIONSIn this section, plume correlations are presented for: plume centreline temperature;
average plume temperature; entrained mass flow rate; plume filling rate;
plume gas density; plume rise;
plume diameter.
3.1 Plume Centreline Temperature
The plume centreline temperature is calculated as follows 181. It is noted that Equation 3.1 is invalid at and below the mean flame height as defined by Equation 2.9:
Where:
T,
T,
Qc g CP P- Z z,= plume centreline temperature, K;
= absolute ambient temperature, K;
= convective heat release rate, kW;
= acceleration due to gravity, rnls2;
= specific heat of gas, kJ/kg-K;
= ambient air density, kg/m3;
= height above top of the fire source, m;
= height of virtual origin relative to the base of the fire source,
The height of virtual origin, &, is the elevation of the virtual origin above the fire source. It is usually located near the fuel surface and can be estimated using
Equation 3.2 [8]. If z, is negative, the virtual origin lies below the top of the fire source. Negative virtual origins indicate fires with low heat release rates and large diameters, while positive virtual origins often indicate fires with high heat release rates:
Where: D = diameter of fire, m;
Q
= heat release rate of the fire, kW. 3.2 Average Plume TemperatureWhere: T,I = average plume temperature,
"C;
T , = ambient temperature, "C;
Qc - = convective heat release rate of fire, kW;
CP = specific heat of gas, kJ/kg.K;
.
m ~ t = entrainment mass flow rate, kgls (see Equation 3.4 for detailed
calculation).
..
3.3
Entrained Mass Flow Rate in PlumesThe entrained mass flow rate of the plume is usually used to predict the growth and the properties of the smoke layer. Heskestad [8] proposed the following equation to estimate the entrained mass flow rate in plumes at and above the mean flame height, using a virtual origin &correction:
Where:
Q,
= convective heat release rate, kW;T,
= ambient temperature, K;g = acceleration due to gravity, m/s2; CP = specific heat of gas, kJ1kg.K; P- = ambient air density, kg/m3;
z = height above top of the fire source, m;
Z, = height of virtual origin relative to the base of the fire source, m.
3.4 Plume Filling Rate
Equation 3.5 calculates the total flow of hot gases at a given height in the plume for steady state conditions [I I]. The equation is appropriate for the estimation of the gas flow rate in those portions of the fire plume above the flame, rather than near the flame itself:
Where: Q
.
= heat release rate of the fire, kW;V , = flow of hot gases, m3/s;
Y = fraction of radiation losses (default taken to be 0.35); y l = fraction of other losses (default taken to be 0.15);
z = height (in fire plume) above fire source.
3.5 Plume Gas Density
The density of air or plume gases is calculated from the perfect gas law as follows [I 21:
Where: p, = density of air and plume gases, kg/m3;
P
=absolute pressure, Pa (often taken to be standard atmosphericpressure, 101 235 Pa);
R = gas constant, J/kg.K (taken to be of air, 287 J1kg.K); T = absolute temperature, K.
3.6 Plume Rise
The maximum plume rise, either in a tall building or the open environment, can be estimated as described by Briggs [13]. Equation 3.7 gives a correlation for the maximum plume rise in a tall building.
When a thermal plume rises against a temperature gradient, there comes a point at which it cools to the temperature of its environment and can no longer rise under buoyancy. Such a temperature gradient can be created inside a tall building where solar gain and space heating can cause air at the top of the building to be significantly warmer than at ground level.
Where: T, = ambient temperature,
t<;
g = acceleration due to gravity, m/s2;
CP = specific heat of gas, kJ/kg.K;
P- = ambient air density, kglm3;
T T ~ = the temperature at the top of the building, K;
T B ~ =the temperature at the bottom of the building, K; HB =the height of the building, m.
The expression is also useful for estimating plume rise (from a fire at sea level) in the open when assuming no disturbance by the wind.
3.7 Plume Diameter
The diameter of a plume is approximated as follows [I 41:
Where: D, = diameter of visible plume, m;
z
= height above top of fuel, m.Equation 3.9 is within 5% of a more complicated correlation that is in terms of the centreline temperature [12]. It is found that the above equation is probably of sufficient accuracy for the design applications, considering that plumes are in constant motion and that the diameter can only be measured approximately.
4. SMOKE CORRELATIONS
The Smoke submenu contains further submenus that predict smoke temperature, smoke filling height and filling time, etc. They are:
Compartment temperature during pre-flashover; Compartment temperature during post-flashover; Volume of smoke;
Interface height; Atrium temperature; Ceiling jet temperature.
4.1 Compartment Temperature during Pre-Flashover
In FIERAscor, the hot layer temperature in the compartment of fire origin is calculated using the following equation proposed by McCaffrey, Quintiere and Harkleroad
m:
Where: g
CP 0-
= acceleration due to gravity, mls2;
= specific heat of gas, kJIk9.K;
= ambient air density, kglm3;
= heat release rate of the fire, kW; =temperature of the upper gas layer, K; = ambient temperature, K;
=total surface area of the compartment minus ventilation openings, m2;
= ~ l s + ~ A c . i , i i - & ;
=total area of walls, m2;
= area of floor, m2;
=
area of ceiling, m2;= area of opening, m2;
= height of opening, m;
= effective heat transfer coefficient (see Equation 2.8), kW/m2 K.
4.2 Maximum Compartment Temperature during Post-Flashover
The maximum compartment temperature is predicted using the following equation proposed by Law [I
51:
Where
P
and Y are represented as Equation 4.3 and 4.4:Where: T,, = maxjmum expected compartment temperature,
K;
L
= fire load (equivalent kg wood), kg. 4 3 Volume Flow RateThe volume flow rate of smoke produced can be estimated, according to BSI [I 01, as follows:
.
Where: V s
.
= volume rate of smoke production at a specified temperature, rn3/s;m = mass Row rate, kg/s;
Ts
=
smoke temperature in smoke plume, K;P- = ambient air density, kg/m3; T, = ambient temperature, K.
4.4 Interface Height (Steady and Unsteady Fire with No Exhaust)
Smoke filling heights and filling times for both steady fires (constant heat release rate) and unsteady fires (uneven growth) are calculated from NFPA 92B [14].
4.4.1 Filling by a Steady Fire
The following is an experimental correlation of the accumulation of smoke in a
Where: z = height of the first indication of smoke above the fire, m;
H
= ceiling height above the fire, m;t =time, s;
Q
= heat release rate from steady fire, kW; A = cross-sectional area of the atrium, m2;c,o
=1.11.Equation 4.6 is conservative since it estimates the height of the first indication of smoke above the fire rather than the smoke interface as shown in Figure 4.1. In the idealized zone model, the smoke interface is considered as the height where there is smoke above and none below. In real fires, there exists a transition zone between the lower cool layer and the upper hot layer. This equation is based on a plume that has no contact with walls. This condition is conservative since wall contact reduces entrainment of air.
4 Ceiling
4 Smoke Layer Interface
4 First Indication of Smoke
Figure 4.1 Smoke layer interface
In addition, the equation is for a constant cross-sectional area with respect to height. The equation is appropriate under the following conditions:
The steady filling equation can be solved for filling time as follows:
4.4.2 Filling by an Unsteady Fire
For a t2 fire, the location of the smoke layer interface can be estimated from NFPA 928 1141:
Where:
z
= height of the first indication of smoke above the fire, m;H = ceiling height above the fire, m;
t =time, s;
tn =fire growth time, s (see Table 4.1);
A
=
cross-sectional area of the atrium, m2;CII = 0.91.
This equation is also conservative and is based on a plume that has no wall contact. In addition, the equation is for a constant cross-sectional area with respect to height and is appropriate under the following conditions:
The filling time is estimated as follows:
Where: C,Z = 0.937.
Table 4.1. Typical Fire Growth Constants
4.4.3 Mass Flow Exhaust
Ultrafast
The calculation of the mass flow rate of exhaust air is based on the following simplifying assumptions:
75
1. The design fire must have a constant heat release rate so as to maintain a steady clear height.
2. The only flow into the smoke layer is from the plume, and the only flow from the smoke layer is the smoke exhaust.
3. From the principle of conservation of mass for a steady process, the exhaust flow must equal the flow from the plume.
The user should verify these assumptions before using this method. The equation to calculate the exhaust flow rate is [12]:
Where: m = mass flow exhaust of exhaust air, kgls; z = clear height above top of fuel, m;
Qc = convective heat release rate of fire, kW;
CI = 0.071;
cs
= 0.0018.4.5 Atrium Smoke Temperature
The smoke temperature in an atrium is estimated with the consideration of radiation and convection energy losses as follows [I 61:
AT= 220 (4.1 3)
z513 (l+39.8-)
Q2"
Where: AT =the temperature rise, O C ;
z = clear height above top of fuel, m;
Q
= heat release rate of the fire,kW.
Equation 4.13 is valid when the level of energy does not exceed that prescribed in Equation 4.1 4:
4.6 Ceiling Jet Temperature
Alpert and Ward [17] proposed the following equation to calculate the
temperature of a ceiling jet over a free burning fire at a distance at least 0.2 times the height of the plume. The calculation is conservative. It is suggested that the formula be used to estimate the hazard of such gases rather than the response of a heat detector:
Where:
Tpl
= plume gas temperature,"C;
T,
= ambient temperature,"C;
K
=
configuration parameter;= 1, when the fire is away from any walls;
= 2, when the fire is near a wall;
= 4, when the fire is in a comer;
H = vertical distance above fire, m;
R = radial distance from the centreline of the plume, m;
Q
= heat release rate of the fire, kW.The formula is valid as prescribed in Equation 4.1 6 or when the core of the flame reaches the ceiling:
5.1 Radiant Ignition of Adjacent Fud
The following equations can be used to estimate the irradiation for a free buming fire required to ignite a near-by fuel. These equations were developed from
experimental data; a detailed description can be found in Babrauskas [I 81. The most probable value of irradiance and a conservative estimate are calculated using
Equations 5.1 and 5.2, respectively:
q; = q'*(1.0+ll.ld2) (Most probable)
q; = q"
*
(1.0+
2.8d2) (Conservative) Where: q;=
heat flux from a burning item, kW/m2;4' = critical incident heat flux on a target, kw/m2;
= 10, loose newsprint, curtains;
= 20, upholstered furniture;
= 40, wood thicker than 25 mm; d =the distance from a burning item, m.
5.2 Egress Time
The egress time is the time needed for a person or group of people to exit an area or building. The basic assumptions in the calculation include [I 91:
1. Any congestion will occur at doorways. Movement through vertical and horizontal passageways will be relatively free flowing;
2. Doors let people flow at a rate of one person per second per door leaf;
3. The capacity of stairs is equal to 60 persons per minute per metre of effective total stair width;
4. The impact of stair steepness on exit flow is proportional to the square root of riser to tread ratio;
5. The defautt rate of emergency egress flow is 76.2 mlmin on level travel and 12.2 rnlmin on stairs.
5.2.1 Unimpeded Egress Time for One Evacuee
The time required for the person furthest away to reach an exit, without any delay due to bottlenecks at doors, is calculated using Equation 5.3:
Where: t- =time required for the person furthest away to reach an exit without any delay due to bottlenecks at doors;
X
= adjustment factor for considering mobile but slow moving persons; th =time required for a fully able person to travel the total length oftv =time required for a fully able person to travel the total length of all
portions of the exit route that are over stairs, min.
The travel time on a flat pathway (th) is calculated using Equation 5.4. The default travel speed on a dry, flat surface, vh, is assumed to be 72.6 dmin:
Where: dh = total horizontal distance travelled by the evacuee, m;
vh = speed of an able evacuee moving on flat, dry surface, dmin.
The travel time on a vertical pathway (t,) is calculated using Equation 5.5 with the consideration of deviations in standard-stair design measurements. The default speed of an able evacuee moving in a vertical means of egress is assumed to be 12.2 dmin.
Where: t, = time required for a fully able person to travel the total length of all portions of the exit route that are over stairs, min;
d, =total vertical traverse distance, in;
v, = speed of an able evacuee moving in a vertical means of egress, dmin;
= height of the riser from tread to tread, m;
x = depth of the tread from riser to riser, m.
These times will be modified if the user specifies reduced travel efficiency
x
(see Equation 5.6) for the slowest person in the evacuating population.Where: X =the speed of slowest evacuees as percentage of that of an able person.
5.2.2 Time to clear population through exit doors
The time to move all evacuees through the exterior exit doors is calculated as follows:
Where: =time to clear population through exit doors, min;
N =total evacuating population;
NUituitImvCI = number of exit door leaves available to evacuees;
QP,, = flow rate through an exit door (people/door/min)
5.2.3 Time to Move Entire Evacuees out of Stairway Enclosures
The time to move all evacuees through and out of the stairway enclosures is calculated using Equation 5.8:
Where: t,, =the time to move all evacuees through and out of the stairway enclosures, min;
WH
= effective width of an exit passageway, m (may be either the stainnray enclosure exit door width or the width of the stairway itself);QP-
=
flow rate in a stairway enclosure per unit effective width (60 people/min/m by default (see Assumption 3 on page 17)). The above earess time estimates assume the most efficient exit ~ a t h s are chosen. There is nknsideration of investigation, verification, 'way-findingn and assistance during the whole egress process. There is also no flow congestion and no adjustments to flow speed with respect to evacuee flow density. ~raveis~eeds on a flat surface and on stairs, flow rate in a stairway enclosure and through exit doorways are all user adjustable.5.3 Fire Severity
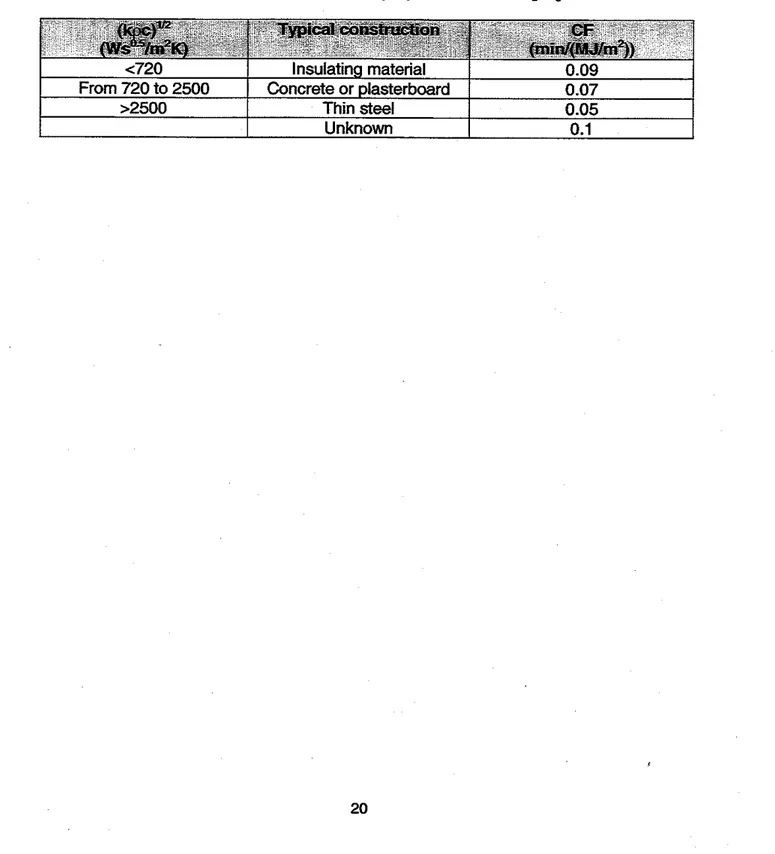
Fire severity is defined as the equivalent time of exposure to a standard fire. The following is an empirical procedure prepared by CIB W14 [20] to estimate the equivalent fire severity, g(min), based on wood crib tests in standard compartments:
Where:
CF
= conversion factor, min/MJ/m2 (see Table 5.1);VF
= ventilation factor, (see Equation 5.1 0);=fire load density per floor area, M J / ~ ' (see Equation 5.12). The VF and q, are calculated as follows:
Where:
Af
=total interior area of the compartment floor, m2;A,
= surface area of the compamnent including openings, m2;A,
=total area of the openings, m2;Hw = average height of~the openings weighted with respect to each
Where: m; =total mass of each combustible material in the compartment,
kg;
hi = lower calorific value of the fuel for each combustible, MJ/kg, (see
Table 5.2).
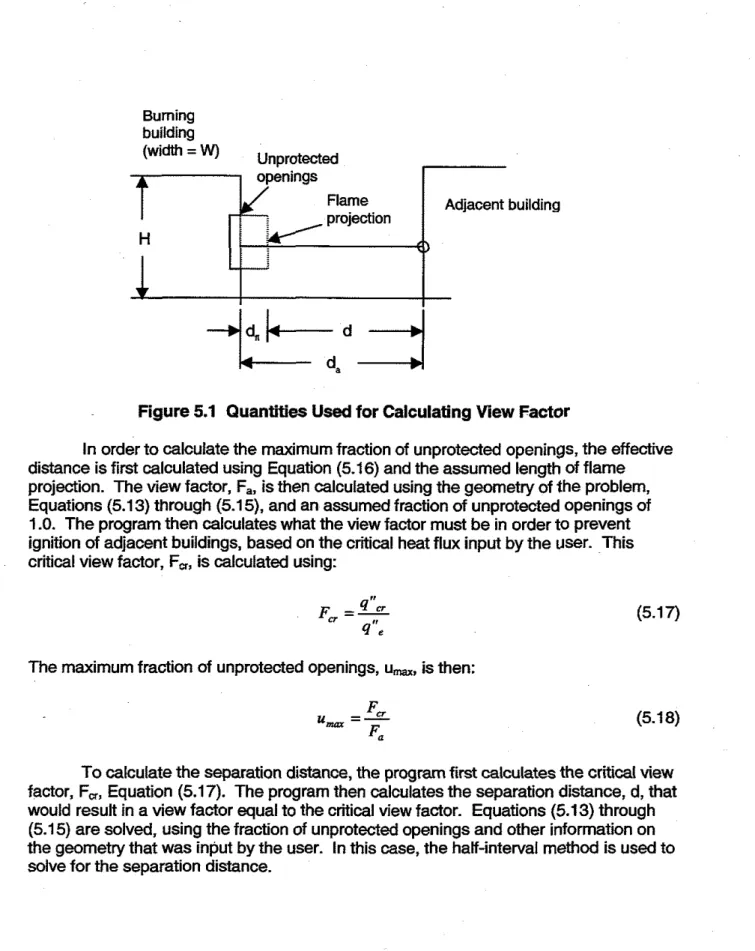
5.4 Spatial Separation
The Spatial Separation module calculates the minimum distance between buildings and maximum areas of unprotected openings necessary to reduce the risk of fire spreading between buildings to an acceptable level. The detailed theory of this model can be found in the FlERAsystem Radiation to Adjacent Building Model theory report [21].
An equivalent heat flux at any unprotected opening in the burning building, q",, must first be selected by the user. The user can input any equivalent heat flux value, or one of two suggested values:
180 k w h 2 for an occupancy of "normal' hazard, or 360 kw/m2 for an occupancy with a "severe" hazard.
The thermal radiation to an adjacent building is then calculated using the equivalent heat flux at the unprotected opening and the radiation view factor between the unprotected openings and a point on the face of the adjacent building
The view factor,
F,,
for the unprotected openings, is calculated using the following formula [22]:Where: u =the fraction of unprotected openings (0 I u 5 I),
H =the height of face of the burning building (m),
W =the width of the face of the burning building (m),
d
=
is the 'effective" distance (see below) between the burning and adjacent buildings (m), andThe effective distance, d, is the actual distance between the buildings (d, in Figure 5.1) minus the assumed distance that flames may project horizontally outside of the windows of the burning building,
&:
The minimum separation distance allowed by the program is 2.4 m, based on the National Building Code of Canada 1231.
Burning building
(width = W) Unprotected
t
openings Flame Adjacent building projectionH
<)
I
Figure 5.1 Quantities Used for Calculating
View
FactorIn order to calculate the maximum fraction of unprotected openings, the effective distance is first calculated using Equation (5.16) and the assumed length of flame projection. The view factor, Fa, is then calculated using the geometry of the problem,
Equations (5.1 3) through (5.1 5), and an assumed fraction of unprotected openings of 1 .O. The program then calculates what the view factor must be in order to prevent ignition of adjacent buildings, based on the critical heat flux input by the user. This critical view factor, Fa, is calculated using:
The maximum fraction of unprotected openings, u, , is then:
To calculate the separation distance, the program first calculates the critical view factor, Fa, Equation (5.17). The program then calculates the separation distance, d, that
would result in a view factor equal to the critical view factor. Equations (5.13) through (5.15) are solved, using the fraction of unprotected openings and other information on the geometry that was input by the user. In this case, the half-interval method is used to solve for the separation distance.
REFERENCES
Evans, D.D., 'Ceiling Jet Flows", SFPE Handbook of Fire Protection Engineering, National Fire Protection Association, Quincy, MA, 1995, pp. 2-32
-
2-39.Buchanan, A. H., 'Fire Engineering Design Guide", Centre for Advanced Engineering, University of Canterbury, New Zealand, 1994.
Burgess D. and Hertzberg M., "Radiation from Pool Flames", Heat Transfer in Flames, N.H. Afgan and J.M. Beer, eds., Wiley, 1974.
Thomas P. H., Heselden, A. J. M. and Law M., 'Fully Developed Compartment Fires -Two Kinds of Behaviours", Fire Research Technical Paper 18, HMSO, 1967.
"Fire Engineering Guideline", Fire Code Reform Centre Ltd., Sydney, Australia, 1996.
Thomas, P. H., "Testing Products and Materials for their Contribution to Flashover in Rooms", Fire and Materials, Vol. 5, No. 3, 1981, pp.103-111.
McCaffrey, B.J., Quintiere, J.G. and Harkleroad, M.F., "Estimating Room Fire Temperatures and the Likelihood of Flashover using Test Data Correlations", Fire Technology, Vol. 17, 1981, pp. 98-1 19.
Heskestad, G., "Fire Plumes", Chapter 2-2, SFPE Handbook of Fire Protection Enaineerina, Societv of Fire Protection Enaineers. Quincv. MA. USA.1995.
~uktiere,
IG.
and-~arkleroad, M., ' ~ e w tonceits for M;asu;inglame
Spread Properties', Symposium on Application of Fire Science to Fire Engineering, American society for Testing and Materials and Society of Fire ~ktection- Engineers, Denver,CO,
June 27,1984.BSI Standards, 'Draft British Standard Code of Practice for the Application of Fire Safety Engineering Principles to Fire Safety in Buildings", Panel FSMJ-15 and Technical Committee FSW24 Fire Safety Engineering, London, UK, 1994. Cooper, L.Y. and Stroup, D. W., "Calculating Available Egress Time (ASET) - A Computer Program and User's Guide", NBSlR 82-2578, National Bureau of Standards, Gaithersburg, MD, USA, 1982.
Klote, J.H., "Method of Predicting Smoke Movement in Atria with Application of Smoke Management", NlSTlR 5516, National Institute of Standards and Technology, Gaithersburg, MD, 1994.
Briggs G.A., 'Plume Rise', US Atmic Energy Commission Critical Review Series, 1969.
NFPA 928, 'Guide for Smoke Management Systems in Malls, Atria, and Large Spaces', National Fire Protection Association, Quincy, MA, USA, 1995.
Law, M., 'A Basis for the Design of Fire Protection of Building Structures', Structural Engineering, Vol. 61A, No. 1,1983, pp. 25.
Nelson, H.E., Shibe, A.J., Levin, B.M., Thorne, S.D. and Cooper, L.Y., 'Fire Safety Evaluation System for National Park Service Overnight Accommodations', NBSlR 84-2896, National Bureau of Standards, Gaithersburg, MD, 1984.
Alpert. R. L. and Ward, E. J., "Evaluatina Uns~rinklered Fire Hazards". SFPE ~ & h n o l o ~ ~ Report 83-2, Society of Fire~rot&tion Engineers, ~oston; MA, 1983. Babrauskas, V., Will the Second Item Ignite?", NBSlR 81-2271, National Bureau of Standards, Gaithersburg, MD, USA, 1981.
NFPA 101, "Code for Safety to Lie from Fire in Buildings and Structures", National Fire Protection Association, Quincy, MA, USA, 1997.
CIB Workshop W14, "Design Guide Structural Fire Safety", Fire Safety Journal, Vol. 10, NO. 2, 1986, pp. 75-137.
21. TOM, D.A. and Hadjisophocleous, G.V., 'FIERAsystem Theory Report: Radiation to Adjacent Buildings Model', IRC Internal Report No. 789, Institute for Research in
Construction, National Research Council Canada, Ottawa, ON, 2000.
22. Williams-Leir, G., "Approximations for Spatial Separation," Fire Technology, Vol. 2,
1966, pp. 136-145.
23. National Building Code of Canada 1995, Canadian Commission on Building and Fire Codes, National Research Council of Canada, Ottawa, ON, 1995.

![Table 2.1 Typical Fire Growth Rate Coefficient [1,2]](https://thumb-eu.123doks.com/thumbv2/123doknet/14204642.480650/10.941.104.855.103.1092/table-typical-growth-rate-coefficient.webp)


![Table 5.2 Net calorific values of typical combustible materials [2O]](https://thumb-eu.123doks.com/thumbv2/123doknet/14204642.480650/26.933.102.860.138.1090/table-net-calorific-values-of-typical-combustible-materials.webp)