HAL Id: hal-01438423
https://hal.sorbonne-universite.fr/hal-01438423
Submitted on 10 Feb 2017
HAL is a multi-disciplinary open access
archive for the deposit and dissemination of sci-entific research documents, whether they are pub-lished or not. The documents may come from teaching and research institutions in France or abroad, or from public or private research centers.
L’archive ouverte pluridisciplinaire HAL, est destinée au dépôt et à la diffusion de documents scientifiques de niveau recherche, publiés ou non, émanant des établissements d’enseignement et de recherche français ou étrangers, des laboratoires publics ou privés.
Overlapping Community Detection by Local
Decentralised Vertex-centred Process
Maël Canu, Marie-Jeanne Lesot, Adrien Revault d’Allonnes
To cite this version:
Maël Canu, Marie-Jeanne Lesot, Adrien Revault d’Allonnes. Overlapping Community Detection by Local Decentralised Vertex-centred Process. 2016 IEEE 16th International Conference on Data Mining Workshops (ICDMW’16), IEEE, Dec 2016, Barcelone, Spain. pp.77-84, �10.1109/ICDMW.2016.0019�. �hal-01438423�
Overlapping Community Detection by Local Decentralised Vertex-centred Process
Ma¨el Canu∗†, Marie-Jeanne Lesot∗† and Adrien Revault d’Allonnes‡
∗Sorbonne Universit´es, UPMC Univ Paris 06, UMR 7606, LIP6, F-75005, Paris, France
E-mail:hfirst namei.hlast [email protected]
†CNRS, UMR 7606, LIP6, F-75005, Paris, France
‡Universit´e Paris 8, EA 4383, LIASD, FR-93526, Saint-Denis, France
E-mail: [email protected]
Abstract—This paper focuses on the identification of overlap-ping communities, allowing nodes to simultaneously belong to several communities, in a decentralised way. To that aim it proposes LOCNeSs, an algorithm specially designed to run in a decentralised environment and to limit propagation, two essential characteristics to be applied in mobile networks. It is based on the exploitation of the preferential attachment mech-anism in networks. Experimental results show that LOCNeSs is stable and achieves good overlapping vertex identification.
1. Introduction
Community detection is a central issue in the domain of computational network science [1]. Although no consensus exists regarding the definition of a community, it can be intuitively considered as a denser sub-network, an area displaying more connections within itself than with the rest of the network.
Many community detection methods partition the net-work into disjoint communities, but it is known that most real-world network communities are overlapping, that is, a node can belong to several communities [2], [3]. This feature is useful to single out nodes having a special role, being at the interface between two or more communities. These nodes are often, mistakenly, referred to as overlapping nodes (in a network) or overlapping vertices (in a graph).
The interpretation of multi-membership depends on the context which the considered graph refers to: in a social networking context an overlapping vertex may represent an individual involved in multiple communities, being therefore a useful element to determine relationships between mem-bers of these different communities. In a networking context, overlapping nodes can reveal the points where most peering traffic passes, useful to better route inter-networks traffic.
The identification of overlapping vertices is difficult because of this contextual definition. Usually, not all vertices at the interface between two communities can be defined as overlapping, because overlapping vertices have a more specific function than constituting a border. Should there be too many overlapping vertices, i.e. would nearly every community share a majority of its vertices with others, then the meaning of these overlapping vertices, and even of the
whole community structure, would be far less legible. On the other side, virtually any network exhibiting a community structure contains vertices that can be viewed as overlapping. Therefore, designing a detection method accurately identi-fying overlapping vertices is not trivial.
To address these problems, we propose LOCNeSs (Locating Overlapping Communities in Network Structures) a vertex-centred algorithm able to detect communities in a decentralised way, using a local approach and limiting propagation. This algorithm processes an undirected graph and produces a community cover (i.e. a vertex partition) of this graph, encompassing overlapping vertices.
This novel approach allows in particular an implementa-tion in the specific context of decentralised ad-hoc networks (MANET) [4], whose very nature makes it difficult to iden-tify a sufficiently accurate community structure: the whole network may not be known at a given time and, as such, can-not be processed by existing centralised algorithms. Being fully decentralisable and limiting propagation is also best suitable to be implemented in graph analysis Think-Like-A-Vertex (TLAV) frameworks such as Pregel [5], because vertex data dependency and propagation both generate much inter-process messages, which are known to impact running time performances [5].
The rest of this paper is organised as follows: tion 2 reviews existing community detection methods; Sec-tion 3 describes the LOCNeSs algorithm in detail; SecSec-tion 4 presents experimental results validating the proposed ap-proach and the paper concludes in Section 5.
2. Related Works
This section presents existing methods related to com-munity detection in networks, successively considering the non-overlapping and overlapping cases.
2.1. Community Detection in Graphs
There are numerous community detection methods, we propose here to distinguish three main approaches: criterion-based, label propagation and vertex-centric. They can be fur-ther distinguished according to their community discovery strategy, local or global: local detection processes a subgraph
in order to determine if it contains one (or more) community, where global detection considers the whole graph and tries to delimit the subsets forming a community structure.
Besides the three previously mentionned main ap-proaches, other popular methods include: clustering (local or global), spectral graph analysis (mostly global), random walks and Markov processes (local or global), statistical inference/probability methods based on generative models (mostly global). See [1], [6] for extensive surveys and references.
Criterion-based methods constitute a very popular fam-ily. They are based on an objective function optimisation. This function measures the quality of the graph partition into communities. It can be global, like the popular network modularity [7], which has been proved to yield very good results although suffering from major drawbacks such as resolution limit [8], or local, for instance [9], which is a local adaptation of modularity. Adjustments of modularity and other criteria have been made to run on distributed graphs [4] but they do not take the overlapping case into account.
Label Propagation is a family of local methods, among those offering the best results: each vertex is given a unique label and propagates it to all other vertices throughout the graph [10]. After the propagation phase, each vertex retains the most frequently received label for its community. This technique can be implemented in MANET, however the massive use of propagation overfloods the network and is a major drawback [11].
Vertex-centric approaches rely on the principle that some vertices in the network are “leaders” or “seeds” and the others are followers [12]. The terms leader will be used throughout the paper to refer to the central vertex role in the general sense related to seed-centric and leader-based approaches. In these methods, communities are formed by gathering followers around leaders, resulting in ego-centred communities (centred around the leader). An example is the
Top-Leaders approach [13]. Although this method is more
related to k-means clustering (re-allocation of the leader)
than truly vertex-oriented, the introduced idea of expanding communities around leaders considering the potential
prefer-enceof a follower vertex (resp. a group of follower vertices)
to join a leader vertex has been exploited by several algo-rithms. Leader-Follower [14] assumes that each community is a clique, which is a strong assumption generally not true in real-world networks. YASCA [15] greedily expands communities around leaders and gathers communities using ensemble clustering; LICOD [16] starts with a careful selec-tion of leaders before computing ranked community mem-bership for each follower, then adjusting preferences and memberships until stabilisation using strategies borrowed from social choice theories. EMc and PGDc [17] locally ex-pand around a leader via EM or Projected Gradient Descent algorithm, using conductance to delimit communities. Canu et al. [18] consider each vertex as a potential leader and use vertex preference measures to constitute dependencies between vertices.
2.2. Overlapping Detection
Because multi-membership vertices are frequently en-countered in real-world networks, numerous overlapping community detection methods have been proposed, see [3] for a thorough survey. Many are adapted from disjoint methods but original methods have been proposed, including
clique percolation or expansion, based on k-clique finding
in the graph, or game-theoretic based frameworks. Although most of these methods correctly identify communities with respect to the ground truth, they lack precision as for the overlapping vertices identification [3]. First, we distinguish the adapted methods, and then we focus on the agent-based algorithm iLCD, more related to the work presented in this paper, and finally we present vertex oriented methods.
Adapted Methods like SLPA [19] and COPRA [20] are label propagation methods extending the principles of [10]. SLPA defines two roles, speaker and listener. Each vertex takes turn being the speaker (i.e. spreading its label) while the others are listening, until label stabilisation is reached, which can be arbitrarily long. COPRA introduces a belong-ing coefficient to extend [10] for overlappbelong-ing communities. Clustering methods and local objective function optimisa-tion, with OSLOM [21], have been adapted as well.
However, many specific ones have also been developed. Agent-based methods, such as iLCD [22], consider each vertex as an agent and each edge as a bond, a relationship between two agents. Communities are formed through an agent simulation process where each vertex can perform ac-tions such as trying to create or join a new community. The detection relies on each agent doing a local computation, and thus follows the same basic principle as LOCNeSs.
Few vertex-centric overlapping community detection method existing to date. The most popular is [23]. However, this method uses a custom PageRank procedure to expand the leader set, which is not decentralised and generates much propagation, therefore unsuitable for use in the considered context.
3. Proposed Method: LOCNeSs
This section presents the proposed algorithm, LOCNeSs, standing for Locating Overlapping Communities in Network Structures. First, the extension of the preferential attach-ment, then the principles of the algorithm itself are de-scribed. Finally, some properties of LOCNeSs are discussed: complexity, propagation and stability.
We use the following notations:G = (V, E)is an
undi-rected and unweighted graph, whereV is the set of vertices,
E the set of edges. G is assumed to be fully connected
without isolated vertices nor self-loops. We denoten = |V |
andm = |E|,dv the degree andΓ(v)the set of neighbours
of a vertexv.d¯is the average degree inG.C = {c1, ..., ck}
is the set of k communities formed after detection, and
C : V → P(C)gives the set of community memberships of a vertexv. If |C(v)|> 1,v is an overlapping vertex.
Algorithm 1 LOCNeSs - Step 2
Require: G = (V, E) a graph,
Av⊂ V the set of leaders of v
Ensure: C ⊂ P(V )a set of vertex communities in G
1: Step 2.1
2: for each v ∈ V do
3: abv ← arg maxa∈Avda
4: merge(C(v), C(abv)) (see Description, step 2.1)
5: end for 6: 7: Step 2.2 8: for each v ∈ V do 9: if |Av|> 1 then 10: for all av∈ Av\ {abv} do 11: C(av) ← C(av) ∪ {v} 12: end for 13: end if 14: end for
3.1. Extending Preferential Attachment
The preferential attachment theory [24] describes a com-monly observed formation pattern of complex scale-free networks, especially social networks. It states that a network entity tends to be attracted to other entities it shares many links with, creating denser areas in the network. In other words, during the formation of the network, vertices having higher degrees tend to grab new links more easily, resulting in characteristic network shapes and structures.
Based on this principle and the vertex-centric approach, we propose to consider the community detection task from the perspective of a vertex, trying to answer the question: “Which of my neighbours am I the most related to?” and then join these neighbours to form a community. We adapt a vertex-centred approach allowing a follower to possibly follow more than one leader, defining an overlapping vertex as a vertex belonging to the communities of all of its leaders.
3.2. Overview of LOCNeSs
LOCNeSs is based on a set of leaders and followers formed using a vertex-centred leader selection process (see Section 2). It is required that this method allows a follower
vertexv to be associated with several potential leaders.
The implementation proposed in this paper is based on [18], in which each vertex can be a leader or a follower or both, and performs only local computations in each vertex neighbourhood, thus being fully decentralisable. Each vertex selects which of its neighbours it will follow, resulting in an interdependency structure. A final merging step folds up the interdependencies and a community is formed by each group of vertices following one another.
We add two features, detailed in the next subsection to enable multi-membership identification:
1) a follower can select multiple leaders,
2) the final merging is adapted and divided into two parts.
3.3. Algorithm Description
This subsection describes the important steps of LOC-NeSs. The pseudo-code of step 2 is sketched in Algorithm 1.
The set of all leaders is denotedA ⊂ V and the set of the
leaders selected by a vertexv,Av.
Step 1 - Formation of the Leader Set. A set of
poten-tial leaders is presumed to exist prior to this step. It can
be computed by any relevant vertex-oriented method (see Section 2).
In this step, a preference functionfv: V →R+ is used
to select v’s leaders and form the Av set. It is applied to
each vertex and each potential leader. A vertex v keeps in
its Av the leaders it maximises fv with.
In the proposed implementation, the potential leaders
of v are all of its direct neigboursΓ(v), and thef function
is the agreement [18].
Step 2.1 - Assignment to Community, Merging. We propose to adapt the use of the preferential attachment principle (see Subsection 3.1) to the overlapping case. To
this end, we define for each v ∈ V a main leaderabv∈ Av.
This leader serves as a basis for community merging. In the
current version of LOCNeSs, abv is set to be the maximum
degree leader of v:abv= arg maxa∈Avda, according to the
preferential attachment. If severalaare of maximum degree,
then one is retained randomly.
After completion, a merging pass is performed: each
vertex v forms its own community, then each vertex
com-munityC(v) is merged withC(abv).
This way of proceeding can seem convoluted, but among other strategies involving merging tested during the con-ception of the algorithm, it turned out to be the one that works best. Other solutions, for example having all the followers merging their communities with those of their leaders produces few large size communities, unrelated with the ground truth. The solution presented here provides a compromise between the quantity and accuracy of overlap-ping vertices, and cohesive community structure, consistent with the ground truth, as shown in Section 4.
Step 2.2 - Assignment to Community, Additional
Com-munities. Once the merges have been performed, if v
has been identified as overlapping, then it is added to the
communityC(u), without fusion, for each remaining vertex
u ∈ Av, resulting in:
∀u ∈ Av\ {abv}, v ∈ C(u).
This last step is the one bringing the overlapping
repar-tition: v becomes a member of each community it has a
leader in.
3.4. Algorithm Properties
This section discusses LOCNeSs’ amount of propaga-tion required in terms of number and size of exchanged messages, its stability and algorithmic complexity.
3.4.1. Propagation. As mentionned in Section 2.1, too much propagation is a disadvantage for decentralised
meth-ods. In LOCNeSs, each vertex v sends messages to its
neighbours (d¯ on average), which send v back a reply.
The estimated average number of messages sent at each
step is O(2n ¯d). Thus, the total number of message after
simplication is estimated on average toO(n ¯d).
In comparison, considering that a typical flooding
algo-rithm requires each vertexv to send its label to every other
vertex in the graph, emitting a message that goes through
every edge of the graph, produces an order of O(nm)
messages. For example, in a graph of 5, 000vertices with
¯
d = 10, the total number of exchanged message is about ten times lower for LOCNeSs.
3.4.2. Stability. LOCNeSs design makes it nearly
determin-istic, the only exception being the case when several abv
can be chosen in step 2, and one is drawn at random. It also benefits from the local approach stability [1], a local variation in the graph structure is less able to cause a major change in the community structure than for a global method. This is illustrated in the experimental results (see Section 4). 3.4.3. Complexity. Classical complexity study on commu-nity detection algorithms rely on strong hypothesis, that are mostly unrealistic for real-world complex networks. Because their structure is usually different from a random graph, the worst case complexity being very pessimistic compared to average performance. As a matter of fact, estimating the potential running time and scalability is hard [1].
In LOCNeSs, each vertex runs operations on at most all
of its neighbours. Thus, each vertex v’s “individual vertex
program” total complexity can be estimated asO(d2
v). So we
get noperations running in O( ¯d2), where d¯is the average
degree of the graph. There arenmerging operations, whose
complexity depends on the community size. Writing |c|¯
the average size of a community, we can write the total estimated complexity asO( ¯d2+ ¯|c|).
4. Experimental Study
A series of experiments has been conducted to study the validity of LOCNeSs compared to existing algorithms, especially its ability to correctly identify overlapping ver-tices in a decentralised context, as well as its stability and robustness.
First, the datasets and evaluation criteria used for testing are presented, then the general experimental protocol and finally each experiment alongside its results.
4.1. Datasets
Both artificial and real-world graphs are used to test the proposed algorithm. Artificial graphs are generated using the classic LFR benchmark [25], which creates graphs with a community structure together with a ground truth, i.e. the community membership assignment for each vertex. Real-world graphs are the classic Zachary’s karate club [26], and the High School Students network proposed in [3].
Artificial Graphs Parameters. We use several sets of parameters for the LFR benchmark generator. Their possible values are the ones used in [3]. We specify which value is used for each experiment in the following subsections.
The number of vertices n is tested here for several
values up ton = 10, 000. LOCNeSs has been found to work
well on graphs up to n = 1, 000, 000, however we could
not compute the NMI nor the Omega Index on
million-vertex graphs. The mixing parameter µ is related to the
intra- and inter-density of communities, and describes how “well-knit” the graph is. The higher this value is, the less community detection is easy to perform because boundaries of the dense areas are harder to identify. The average degree
¯
kis set to 10, and the maximum degreemaxkis set to 50.
Community size ranges are the intervals of possible sizes
for a community. Two ranges are used, as in [3]:s (small)
from 10 to 50 vertices, andb(big) from 20 to 100 vertices.
The number of overlapping verticesOnis usually
ex-pressed as a percentage ofn. We use two values:On= 10%
i.e. a minority of overlapping vertices, which is generally easy to capture for community detection methods, and
On = 50% i.e. half of the vertices are overlapping, which
often results in a dramatic drop in detection performance.
Note that On = 50% is an extreme value to evaluate
the degeneration of method performances and is never en-countered as such in real-world graphs. Indeed, overlapping vertices should remain a minority in the graph (see Sec-tion 1).
The number of memberships for overlapping vertices
Om is the exact number of different community
member-ships for each of theOn overlapping vertices in the graph.
We make this parameter vary from 2 to 8. Note that is it actually uncommon to get the same exact number of memberships for all vertices in a real-world graph.
There are a total of 112 combinations, and we generate 10 graphs for each.
4.2. Evaluation Criteria
To measure the accuracy of overlapping vertices identi-fication by LOCNeSs, classic criteria are used, see [3]. 4.2.1. Similarity between partitions. We use the overlap-ping variant of the popular Normalized Mutual Information (NMI) [1], and Omega Index [27], a variation of the Ad-justed Rand Index (ARI) which gives a score of similarity between two partitions of a set, corrected for chance.
NMI ranges in[0, 1]and Omega Index in(−1, 1]. Both
reach 1 when the two partitions are totally similar, and 0 when the partitions are totally dissimilar for NMI, or similar to the output of a random partition for Omega Index. Abnormally dissimilar partitions are given a negative Omega Index value.
The reason why we use these two criteria is that although they both measure the similarity between two partitions, their results are not always similar nor correlated: NMI uses entropy and thus gives more importance to the fact of having a large fraction of pairs of vertices put in the
same communities in the two partitions. Thus, it can be high even if the global community repartition is very different from the ground truth, for example is made of numerous little communities. On the contrary, Omega Index is heavily affected by the global community structure and can easily drop if the number and size of detected communities is not the same as in the ground truth.
4.2.2. Overlapping Vertex Identification. NMI and Omega Index both capture the matching of the community structure and the identification of overlapping vertices at the same time, and therefore lack the capability of evaluating the relevance of this identification alone. We therefore use the
F1-score (F-score) to this end, formulated as a classification
task: a vertex is correctly classified if it is categorized as overlapping and if it is the case in the ground truth.
The number of memberships is not considered here, a vertex is defined as overlapping if it follows more than 1 other vertex. Precision and recall are computed separately
and used to compute theF-score.
4.3. Experimental Protocol
We compare LOCNeSs results to that of: COPRA, Greedy Clique Expander (GCE), iLCD, OSLOM and SLPA described in Section 2. Being agent-oriented, iLCD is LOC-NeSs most direct competitor considering the application context. SLPA and COPRA are local and decentralised, so they are also competitors to LOCNeSs, although they use much propagation due to being label propagation methods. OSLOM (criterion-based) and GCE (clique-percolation) are shown to provide more comparison about the performance of overlapping community detection, though they could not be straightforwardly applied to the considered context.
All the tested implementations are those made available by their respective authors, run with the recommended
de-fault parameters. For COPRA, the parameter v to control
the maximum number of communities per vertex is set to
d1.5×Ome, for SLPA we use the recent GANXiS
implemen-tation with the parameter r set to 0.3,value obtained after
experimental tuning, and for LOCNeSs, the leader selection step uses the default parameters recommended in [18].
Each algorithm is run 10 times on each graph to deal with its non-determinism. Note that for artificial graphs, these 10 runs are done over each of the 10 different instances generated using the same set of parameters.
4.4. Quality of Overlapping Vertex Identification
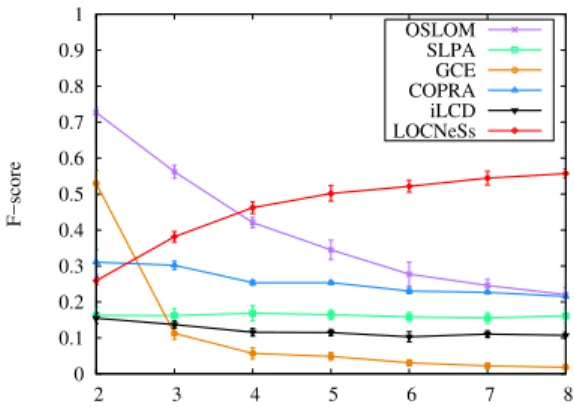
This experiment uses theF-score to show the ability of
LOCNeSs to identify overlapping vertices, compared to its competitors. This experiment is performed on a set of graphs
generated with parameters n = 5000, µ = 0.3, On = 10%,
andscommunity size range. Om varies.
On the results given Figure 1, we can see that LOCNeSs’
F-Score rises, contrary to all other methods that decrease
or remain stable. In fact, the precision and recall values
used to calculate F-score, not shown here due to lack of
0 0.1 0.2 0.3 0.4 0.5 0.6 0.7 0.8 0.9 1 2 3 4 5 6 7 8 F−score OSLOM SLPA GCE COPRA iLCD LOCNeSs
Figure 1.Overlapping vertices identification in term of F -score as a function of Om
space, reveal that SLPA, GCE and OSLOM are more precise with precision values between 40-50% for SLPA, but have a lower recall, e.g. around 10% for SLPA. LOCNeSs achieves
only 20% precision, for Om = 2 to 41% precision for
Om= 8, but has a higher recall: between 34%, forOm= 2
to 85%, for Om = 8. In other words, LOCNeSs identifies
more overlapping vertices than existing in the ground truth, whereas SLPA identifies less.
Altogether, LOCNeSs achieves significantly better
F-score when Om ≥ 4, i.e. when a vertex belongs to many
communities. This feature is interesting because vertices that are overlapping in certain real world networks, such as social networks, tend to belong to many communities [2].
4.5. Quality of Partitions
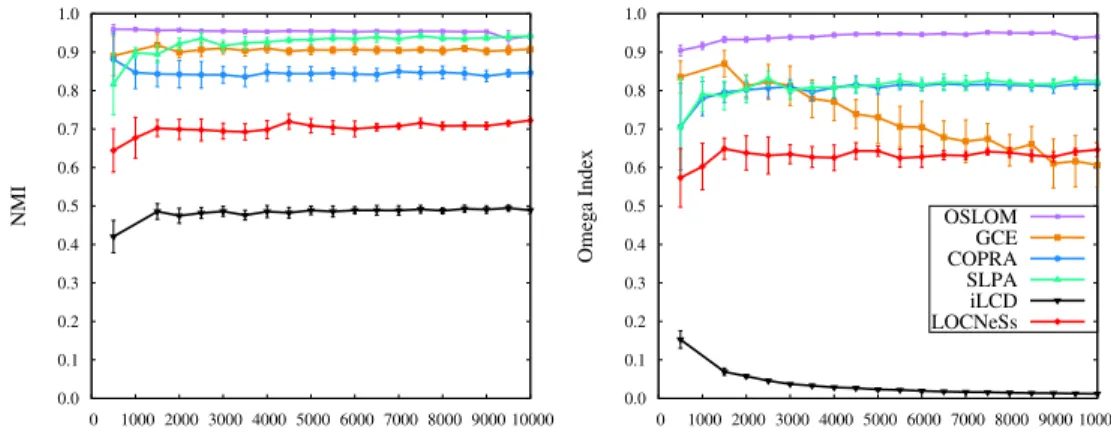
The goal of this experiment is to measure the
sensi-tivity of LOCNeSs against parametersn (Fig. 2) and Om
(Fig. 3) in the considered graphs. Fixed parameters are
µ = 0.3, On = 10%, size ranges. In Fig. 2,n varies from
500to10, 000andOmis set to 2, and in Fig. 3Om varies
from 2 to 8 andnis set to 5, 000.
We observe that LOCNeSs remains stable in all cases, achieving generally lower performances in terms of NMI and Omega Index than the optimisation or propagation-based methods, but always higher than the agent-propagation-based iLCD. In Fig. 3 it can be seen that the Omega Index for
all other methods drops faster than for LOCNeSs as Om
grows, revealing a consequence of the ability of LOCNeSs to better detect many-memberships overlapping. As a matter of fact, even if the same pairs of vertices tend to be placed together (high NMI), the overall community structure is less and less similar to the ground truth (low Omega Index). That is, having many communities that overlap on the same vertices blurs the community boundaries identification for the other methods.
0.0 0.1 0.2 0.3 0.4 0.5 0.6 0.7 0.8 0.9 1.0 0 1000 2000 3000 4000 5000 6000 7000 8000 9000 10000 NMI 0.0 0.1 0.2 0.3 0.4 0.5 0.6 0.7 0.8 0.9 1.0 0 1000 2000 3000 4000 5000 6000 7000 8000 9000 10000 Omega Index OSLOM GCE COPRA SLPA iLCD LOCNeSs
Figure 2.Comparative detection quality in terms of NMI and Omega Index as a function of the number of vertices n
0.0 0.1 0.2 0.3 0.4 0.5 0.6 0.7 0.8 0.9 1.0 2 3 4 5 6 7 8 NMI 0.0 0.1 0.2 0.3 0.4 0.5 0.6 0.7 0.8 0.9 1.0 2 3 4 5 6 7 8 Omega Index OSLOM SLPA GCE COPRA iLCD LOCNeSs
Figure 3.Comparative partition quality in terms of NMI and Omega Index as a function of Om
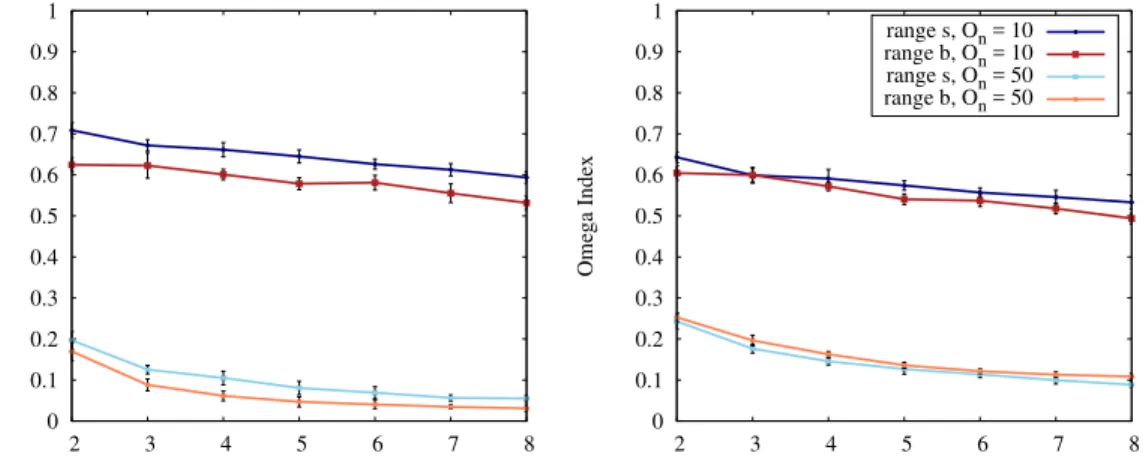
4.6. Proportion of Overlapping Vertices and Com-munity Size Range
This experiment is intended to measure the impact of two main parameters on the performance of LOCNeSs: the
proportion of overlapping vertices On and the community
size rangesor b, here shown in term of NMI as a function
of Om. Results, presented on Figure 4, are only related to
LOCNeSs due to the lack of space. Similar experiments and results for COPRA, GCE, iLCD, OSLOM and SLPA
can be found in [3]. Parameters for the graphs are: n =
5000, µ = 0.3.On is tested for two values 10% and 50%
while Om varies. As a reminder,On= 50%is an extreme
and unrealistic value, see Section 4.1.
We notice a significant drop whenOn= 50%compared
toOn = 10%, which is generally the case for most
overlap-ping community detection methods [3]. NMI for ranges s
andb are clearly correlated, performances being higher for
thesrange, which means that small communities are more
easily detected than big ones, a typical feature for methods not relying on modularity, also already identified in [3].
4.7. Real-World Graphs
The last two experiments aim at showing a visual com-munity repartition from LOCNeSs detection results on real-world graphs. The relatively small size of these graphs compared to the artificial graphs makes the NMI and Omega Index values not really significant, therefore we do not include them in the comments. We prefer to highlight some key vertex repartition and try to provide an explanation based on LOCNeSs expected behaviour.
4.7.1. Zachary’s Karate Club. Zachary’s network [26] pictures a karate club following a clash. Vertices represent the club members and the edges their friendship relations. Note that Zachary’s karate club has no “overlapping” ground truth and was not considered by its author as an overlapping community structure. A visualisation of LOCNeSs detection output is available on Figure 5.
We can notice that only a single non-overlapping vertex is misclassified: vertex #14 has been assigned to the cyan community whereas it is part of the orange one. That is because out of four edges, three link it to the cyan, thus influencing much more the assignment than the only link to the orange to #34, even if this vertex is of high degree.
0 0.1 0.2 0.3 0.4 0.5 0.6 0.7 0.8 0.9 1 2 3 4 5 6 7 8 NMI 0 0.1 0.2 0.3 0.4 0.5 0.6 0.7 0.8 0.9 1 2 3 4 5 6 7 8 Omega Index range s, On = 10 range b, On = 10 range s, On = 50 range b, On = 50
Figure 4.Onvalue and community size range effect as a function of Om for LOCNeSs
Figure 5. Graph visualisation of the cover produced on Zachary’s karate club. Orange and cyan: detected by LOCNeSs, including two overlapping in purple. Red line: split according to Zachary
Two overlapping vertices are detected: #20 and #29.
Vertex #20 shares an edge with #1, #2 (cyan community)
and #34 (orange community), three vertices of high degree
in the area, making #20 clearly at the border between the
two communities. Vertex #29is connected to #32 and #34
in the orange community and to #3in the cyan community,
#3 being itself at the border of the community, justifying
the overlapping condition of #29 and validating LOCNeSs
identification of overlapping vertices.
4.7.2. High School Network. The High School Network (Fig. 6) is a real-world network of 68 US high school students, presented by Xie et al. [3]. All the quotations in this subsection are taken from their paper.
This network is a result of a survey of high school students of different grades but from a same school. A link between two students reveals a certain degree of friendship (e.g. frequent interactions). This network encompasses 6 communities corresponding to the students grade, shown as background colors on the figure. A given run of LOCNeSs on the network resulted in 5 different communities detected (vertex color) and 7 overlapping vertices found (#0, 1, 42, 58, 59, 60, 63), each belonging to two communities,
bi-Figure 6. Graph visualisation of the cover produced on the Highschool Network. Vertex color: community according to LOCNeSs, background color: ground truth. Overlapping vertices are circled in black.
coloured and circled in black on the figure.
We observe that LOCNeSs does not detect the original red community, representing grade 12, but makes vertices #0 and #1 belong to both original yellow and green commu-nities, representing respectively grade 11 and 8. This odd proximity between grades 12 and 8 is explained by the misassignment of #61 to the green community (grade 8) instead of the orange (grade 9). The yellow community (grade 11) is not detected either, being put together with the deep blue one (grade 10). The preferential attachment dis-ruption between the two areas in the graph is not sufficient to make LOCNeSs decide that these vertices, that form their own community in the real-world, may constitute separate communities. Basically, it corresponds to a lack of density difference.
It is stated in [3] that the original magenta community corresponding to grade 9, here split into the orange and magenta communities, is actually divided into two sub-groups: white students (#14, 15, 41, 43, 44, 53, 54, 55, 56, 59, 61) and black students (#12, 13, 16, 17, 18, 19). LOCNeSs separated #13, 16, 17 and 19, in magenta, from
the rest of the community in orange rendering, imperfectly, the division. Vertex #59, assigned to both magenta and or-ange community, is described as a “boundary node between subgroups within a grade” .
Lastly, #42 is described as “serv[ing] as a bridge be-tween groups without having particular coherence to any group” [3]. This characteristic is well rendered by LOC-NeSs that makes #42 belong to both light blue and green communities.
5. Conclusion and Future Work
We introduced LOCNeSs, an algorithm to detect over-lapping communities in graphs. A vertex-centred method, this algorithm implementation is meant to be decentralised and to limit message propagation in the network. These characteristics are particularly suitable for use in a mobile opportunistic network, or to be implemented in a Think-Like-A-Vertex framework, such as Pregel.
We presented experiments to show the efficiency of LOCNeSs, in terms of quality of detection and stability measured on benchmark graphs, and also in terms of mean-ingfulness of communities when run on real social networks. To extend this work, an interesting avenue is to use gradation degree to express the multi-community member-ship. As a matter of fact, an overlapping vertex can belong more to a particular community than another, which is not reflected with the binary assignment (full belonging or not at all) used here. We are also currently working on a further extension to process dynamic graphs. The experimentally observed robustness against graph topology variations en-courages us to think that LOCNeSs would perform well on such time-varying graphs.
Acknowledgments
This work was performed as part of the Homo Textilus project, supported by the French National Agency for Re-search (ANR) under the grant ANR-11-SOIN-007. We thank Chi Dan Pham for helping us to name the algorithm.
References
[1] S. Fortunato, “Community detection in graphs,” Phys. Rep., pp. 75– 174, Jun. 2009.
[2] G. Palla, I. Dernyi, I. Farkas, and T. Vicsek, “Uncovering the overlap-ping community structure of complex networks in nature and society,” Nature, vol. 435, no. 7043, pp. 814–818, Jun. 2005.
[3] J. Xie, S. Kelley, and B. K. Szymanski, “Overlapping Community Detection in Networks: The State-of-the-art and Comparative Study,” ACM Comput. Surv., vol. 45, no. 4, p. 43, Aug. 2013.
[4] P. Hui, E. Yoneki, S. Y. Chan, and J. Crowcroft, “Distributed Community Detection in Delay Tolerant Networks,” in Proc. of the 2007 ACM/IEEE International Workshop on Mobility in the Evolving Internet Architecture, ser. MobiArch ’07. New York, NY, USA: ACM, 2007, p. 7.
[5] R. R. McCune, T. Weninger, and G. Madey, “Thinking Like a Vertex: A Survey of Vertex-Centric Frameworks for Large-Scale Distributed Graph Processing,” ACM Comput. Surv., vol. 48, no. 2, pp. 25:1– 25:39, Oct. 2015.
[6] P. Bedi and C. Sharma, “Community detection in social networks,” WIREs Data Mining Knowl Discov, vol. 6, no. 3, pp. 115–135, May 2016.
[7] M. E. J. Newman and M. Girvan, “Finding and evaluating community structure in networks,” Phys. Rev. E, vol. 69, no. 2, p. 026113, Feb. 2004.
[8] S. Fortunato and M. Barthlemy, “Resolution limit in community detection,” Proc. of the National Academy of Sciences, vol. 104, no. 1, pp. 36–41, 2007.
[9] A. Clauset, “Finding local community structure in networks,” Physi-cal Review E, vol. 72, no. 2, p. 026132, Aug. 2005.
[10] U. N. Raghavan, R. Albert, and S. Kumara, “Near linear time algo-rithm to detect community structures in large-scale networks,” Phys. Rev. E, vol. 76, no. 3, p. 036106, Sep. 2007.
[11] Y. Tian, A. Balmin, S. A. Corsten, S. Tatikonda, and J. McPherson, “From ”Think Like a Vertex” to ”Think Like a Graph”,” Proc. VLDB Endow., vol. 7, no. 3, pp. 193–204, Nov. 2013.
[12] J. Riedy, D. A. Bader, K. Jiang, P. Pande, and R. Sharma, “Detecting communities from given seeds in social networks,” Georgia Institute of Technology, Georgia Institute of Technology, Technical Report, 2011.
[13] R. Rabbany, J. Chen, and O. Zaane, “Top leaders community detection approach in information networks,” in 4th SNA-KDD workshop on Social Network mining and Analysis, 2010.
[14] D. Shah and T. Zaman, “Community detection in networks: The leader-follower algorithm,” in Proc. of the 2010 NIPS Workshop on Networks Across Discilines in Theory and Applications, 2010. [15] R. Kanawati, “YASCA: an ensemble-based approach for community
detection in complex networks,” in Computing and Combinatorics. Springer, 2014, pp. 657–666.
[16] Z. Yakoubi and R. Kanawati, “LICOD: A Leader-driven algorithm for community detection in complex networks,” Vietnam J Comput Sci, vol. 1, no. 4, pp. 241–256, Sep. 2014.
[17] T. van Laarhoven and E. Marchiori, “Local community detection by seed expansion: from conductance to weighted kernel 1-mean optimization,” (submitted), Jan. 2016, arXiv: 1601.05775.
[18] M. Canu, M. Detyniecki, M.-J. Lesot, and A. Revault d’Allonnes, “Fast community structure local uncovering by independent vertex-centred process,” in Proc. of the 2015 IEEE/ACM International Conference on Advances in Social Networks Analysis and Mining, Paris, France, Aug. 2015.
[19] J. Xie, B. K. Szymanski, and X. Liu, “SLPA: Uncovering Overlapping Communities in Social Networks via A Speaker-listener Interaction Dynamic Process,” in Proc. of the ICDM 2011 Workshop on DMCCI, Sep. 2011, arXiv: 1109.5720.
[20] S. Gregory, “Finding overlapping communities in networks by label propagation,” New Journal of Physics, vol. 12, pp. 1–26, 2010, other identifier: 2001289.
[21] A. Lancichinetti, F. Radicchi, J. J. Ramasco, and S. Fortunato, “Find-ing Statistically Significant Communities in Networks,” PLOS ONE, vol. 6, no. 4, p. e18961, Apr. 2011.
[22] R. Cazabet and F. Amblard, “Simulate to Detect: A Multi-agent Sys-tem for Community Detection,” in Proc. of the 2011 IEEE/WIC/ACM Web Intelligence and Intelligent Agent Technology (WI-IAT), vol. 2, 2011, pp. 402–408.
[23] J. J. Whang, D. F. Gleich, and I. S. Dhillon, “Overlapping community detection using seed set expansion,” in Proceedings of the 22nd ACM international conference on Conference on information & knowledge management, ser. CIKM ’13. New York, NY, USA: ACM, 2013, pp. 2099–2108.
[24] A.-L. Barabsi and R. Albert, “Emergence of Scaling in Random Networks,” Science, vol. 286, no. 5439, pp. 509–512, Oct. 1999.
[25] A. Lancichinetti, S. Fortunato, and F. Radicchi, “Benchmark graphs for testing community detection algorithms,” Phys. Rev. E, vol. 78, no. 4, p. 046110, Oct. 2008.
[26] W. Zachary, “An information flow model for conflict and fission in small groups,” J. Anthropol. Res., vol. 33, no. 4, pp. 452–473, 1977. [27] L. M. Collins and C. W. Dent, “Omega : A General Formulation of the Rand Index of Cluster Recovery Suitable for Non-disjoint Solutions,” Multivariate Behavioral Research, vol. 23, no. 2, pp. 231–242, Apr. 1988.