HAL Id: hal-01573568
https://hal.archives-ouvertes.fr/hal-01573568
Submitted on 10 Aug 2017
HAL is a multi-disciplinary open access
archive for the deposit and dissemination of
sci-entific research documents, whether they are
pub-lished or not. The documents may come from
teaching and research institutions in France or
abroad, or from public or private research centers.
L’archive ouverte pluridisciplinaire HAL, est
destinée au dépôt et à la diffusion de documents
scientifiques de niveau recherche, publiés ou non,
émanant des établissements d’enseignement et de
recherche français ou étrangers, des laboratoires
publics ou privés.
A Visual Decision Support System for Helping
Physicians to Make A decision on New Drugs
Jean-Baptiste Lamy, Adrien Ugon, Hélène Berthelot, Madeleine Favre
To cite this version:
Jean-Baptiste Lamy, Adrien Ugon, Hélène Berthelot, Madeleine Favre. A Visual Decision Support
System for Helping Physicians to Make A decision on New Drugs. Decision Support Systems VII.
Data, information and knowledge visualization in decision support systems, 282, pp.3-15, 2017, Lecture
Notes in Business Information Processing, �10.1007/978-3-319-57487-5_1�. �hal-01573568�
physicians to make a decision on new drugs
Jean-Baptiste Lamy1, Adrien Ugon1, Hélène Berthelot1, Madeleine Favre2
1
LIMICS, Université Paris 13, Sorbonne Paris Cité, 93017 Bobigny, France, INSERM UMRS 1142, UPMC Université Paris 6, Sorbonne Universités, Paris, France,
[email protected], WWW home page: http://www.lesfleursdunormal.fr,
2 Dept. of primary care, Université Paris Descartes, Société de Formation
Thérapeutique du Généraliste (SFTG), Paris, France
Summary. When new drugs come onto the market, physicians have to decide whether they will consider the new drug for their future prescrip-tions. However, there is no absolute “right” decision: it depends on the physician’s opinion, practice and patient base. Here, we propose a vi-sual approach for supporting this decision using iconic, interactive and graphical presentation techniques for facilitating the comparison of a new drug with already existent drugs. By comparing the drug properties, the physician is aided in his decision task.
We designed a prototype containing the properties of 4 new drugs and 22 “comparator” drugs. We presented the resulting system to a group of physicians. Preliminary evaluation results showed that this approach allowed physicians to make a decision when they were lacking information about the new drug, and to change their mind if they were overconfident in the new drug.
Key words: Knowledge visualization, Overlapping set visualization, Medical decision support, Drug knowledge
1 Introduction
Many drugs are available for major indications, such as pain or infectious dis-eases. Physicians typically have in their mind a “shortlist” of the drugs they usually consider for a prescription in a given indication, and they will prescribe a drug not belonging to the “shortlist” only if none of them is satisfying for a given patient, e.g. due to contraindications. However, new drugs regularly come onto the market. When a new drug is available, physicians have to make a deci-sion: whether they include the new drug in their “shortlist” for the corresponding indication.
This decision is very important, because the prescription of new drugs is as-sociated with a higher risk of serious adverse drug events and hospitalizations [14, 17], and with a higher cost for health insurances because new drugs are costlier [24, 5]. The decision is also very difficult to make, and the physician is under a lot of influence [1], from colleagues, pharmaceutical companies, health
insurances and patients. For most new drugs, there is no clear “good” or “bad” choice: the right decision depends on the physician’s opinion, practice and expe-rience, and also on his patient base. For example, a new drug associated with a high risk of diarrhea (an adverse effect) can be problematic for a physician who has many young children in his patients, because diarrhea can be life-threatening for babies, on the contrary, for another physician with older patients, it might not be a “deal-breaker” problem.
Today, the major source of information on new drugs is the pharmaceutical company sales representative. However, they are not independent from com-panies and their information might not be reliable, because new drugs involve huge economic interests for pharmaceutical companies. A review showed that the information from pharmaceutical companies never lead to positive impact on health costs or prescribing quality [21]. Another source of information is the expert opinion, typically found in independent medical journals, but these opin-ions are not tailored to the patient base of the physician and, as we explained in the previous paragraph, there is no “right” decision that can be taken for granted. Moreover, it is often difficult to assess the independence of experts [3]. In medicine, many clinical decision support systems have been proposed for diagnostic or therapy. These systems typically implement the recommendations of clinical guidelines [7], for instance with a rule-based system. However, in our context, there is no clear “right” decision and thus it nearly impossible to estab-lish rules. Therefore, it is not possible to design a rule-based decision support system producing recommendations such as “you should include this drug in your shortlist” or “you should not”, because the physician experience and patient base have an important impact on the decision and they can hardly be quantified and coded in rule conditions.
In this paper, we propose a different approach for decision support, based on drug knowledge visualization. Instead of providing recommendations or expert opinions, our decision support system help physicians to compare the properties of the new drug, such as contraindications or adverse effects, with the properties of the already existent drugs for the same indication (i.e. the comparator drugs). This comparison is complex, due to the huge number of properties involved, and their associated attributes (e.g. how to compare half a dozen drugs according to hundreds of adverse effects and their frequency for each drug?). For facilitating the comparison, we implemented three different visualization techniques, based on icons, interactivity and overlapping set visualization. The paper presents the visual decision support tool and preliminary evaluation results, including a com-parison of the physician decisions before consulting the system and after.
The rest of the paper is organized as follows. Section 2 describes the knowl-edge base. Section 3 describes the visualization techniques we used, and the resulting visual interface. Section 4 gives some preliminary evaluation results. Finally, section 5 discusses the methods and the results, and section 6 concludes.
2 Knowledge base
2.1 Design
First, we designed a knowledge base on drug properties, allowing the compar-ison of these properties between drugs. The design of the knowledge base was inspired by the structure of Summaries of Product Characteristics (SPCs), which are the official reference documents on drugs (one SPC per drug). The SPC lists the clinical properties of a drug, including indications, contraindications, inter-actions, cautions for use, adverse effects, excipients with known effects. SPC are similar to the drug labels, but more detailed because they are destined to health professionals rather than patients. We considered all clinical properties found in SPC.
In a second time, we organized two focus group sessions involving a total of 17 general practitioners (GPs). GPs were asked to annotate SPCs and other doc-uments, and we analyzed and asked them which drug properties were interesting from their point of view, for deciding whether they would consider a new drug for their future prescriptions. Following the focus group’s recommendations, we excluded from the knowledge base three pieces of information that were consid-ered of low interest by GPs: (1) cautions for use (i.e. recommendations such as “Reduce the dose for elderly patients”), (2) interactions of the first two levels (out of four), keeping only the “contraindicated” and “unadvised” levels, and (3) adverse effects that are both non-serious and non-frequent. Physicians were not interested by cautions for use and interactions of the first two levels because they do not prevent the prescription of the drug (contrary to contraindications or interactions of the higher levels). We also added economic data (daily costs and repayment rates) that were asked by GPs and absent in SPCs.
The knowledge base was edited using Protégé and formalized as an OWL (Ontology Web Language) ontology [26, 18, 19]. It belongs to the SHOIQ(D) family of description logics.
2.2 Extraction of drug knowledge
Drug knowledge was extracted manually by a pharmacist specialized in drug database (HB), from SPCs. This information was completed with the economic data.
We extracted data for four drugs recently made available in France: Antarene codeine®(ibuprofen+codeine, indicated for moderate-to-severe pain), Ciloxan® (ciprofloxacine, indicated for ear infections), Vitaros®(alprostadil, indicated for erectile dysfunction) and Pylera® (bismuth+metronidazole+tetracycline, indi-cated for treating H. pylori stomach infections). We also extracted data for 22 comparator drugs.
Fig. 1. Example of a list of contraindications with VCM icons.
3 Visual decision support system
3.1 Visualization techniques
We combined three advanced visual techniques for comparing drug properties. First, VCM icons (Visualization of Concept in Medicine) [9, 11, 10] are icons for representing the main categories of patient conditions, including symp-toms, disorders, age classes,... Due to the high number of patient conditions, it is not possible to create a specific icon for each of them. Therefore, VCM icons are created using an iconic language. This language includes a set of primitives (5 colors, 35 shapes and 140 pictograms) and grammatical rules for combin-ing the primitives and creatcombin-ing icons. For representcombin-ing a patient condition, an icon is made of a basic shape (a circle for physiological conditions or a square for pathological conditions) associated with a color (red for current conditions, brown for past conditions, orange for risk of future conditions) and a white pic-togram inside the shape (indicating the organ involved, e.g. heart or kidney, or the age class). Shape modifiers can be added to specify the type of disorder, e.g. a small bacteria for bacterial infection or an upward/downward arrow for hyper-or hypofunctioning of an hyper-organ.
VCM icons can be used to enrich lists of patient conditions, for example lists of contraindications. The icons can help physicians to quickly identify all contraindications related to a given organ (e.g. all cardiac contraindications) or type of disorder (e.g. all infections or cancers). Figure 1 shows a synthesis of the contraindications of Vitaros®, with a VCM icon for each.
Second, tables can be used for comparing the numerous clinical drug prop-erties related to security, namely contraindications, interactions and adverse ef-fects. The drugs are displayed in columns and the properties in rows, and the
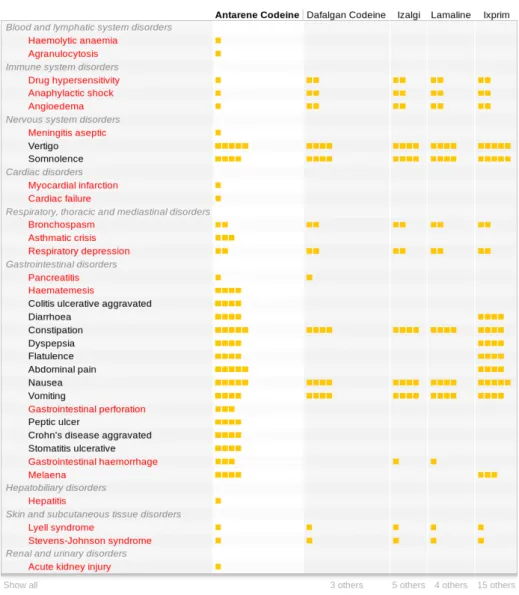
Fig. 2. Interactive table showing the adverse effects of Antarene codeine (a new drug for pain) with 4 other drugs with the same indication. All adverse effects of the new drug are shown; for comparators, only the effects shared with the new drug are shown. Below the table, the number of hidden rows is indicated. Serious adverse effects are written in red color.
Fig. 3. Rainbow boxes comparing the adverse effects of Antarene codeine (a new drug) with 4 comparator drugs (same dataset as figure 2, but displaying all effects for all drugs).
cells contain symbols indicating contraindications or interactions, or the absence of, or small square indicating the frequency of adverse effects (from 0 square, effect is absent, to 5 squares, effect is very frequent). Figure 2 gives an example. Interactive tables are an improvement over static tables, in which the rows can be displayed or hidden following the interaction with the user. We propose an interactive table able to display: (1) the properties of the new drug only (the properties of the comparator drugs being displayed only if the new drug has the same property), (2) the properties of the new drug and a user-selected comparator drug, allowing a comparison between two drugs (typically, the new drug and the drug the physician is used to prescribe), (3) the properties shared by the majority of comparator drugs but absent for the new drug (e.g. situation in which many comparators are contraindicated but not the new drug), and (4) all properties for all drugs (this often leads to a really huge table).
Third, rainbow boxes [8] is an information visualization technique we de-signed for overlapping set visualization (i.e. visualizing several elements and sets made of part of these elements) with drug comparison in mind. For our purpose, the elements are the drugs and the sets are the drug properties. In rainbow boxes, the drugs are displayed in columns and the properties (contraindications, interactions or adverse effects) are displayed as rectangular labeled boxes cov-ering the columns corresponding to the drugs sharing the property. The boxes are stacked vertically, with the largest ones at the bottom. In some situations, “holes” can occur in a box, when the drugs sharing a given property are not in consecutive columns. The drugs are ordered using a heuristic algorithm [8], in order to minimize the number of holes.
For comparing adverse effects in rainbow boxes, we used the color of the boxes to indicate the frequency and the seriousness of the effect. Serious effects are shown in red hue, and non-serious in orange. More frequent effects are shown with more saturated (i.e. stronger) colors. In the example of figure 3, rainbow boxes allow an easy comparison of the adverse effects of 5 drugs. In the visualization, it is easy to see that Antarene codeine (the new drug on the left) has more adverse effects than other drugs (because there are more boxes in its column), that many of these effects are serious (many red boxes) and that two of these effects are both frequent and serious, and thus very problematic (Haematemesis and Melaena, easily visible with their strong red color).
In addition to the advanced visual techniques described above, simple tables and bar charts were also used.
3.2 Presentation of the visual interface
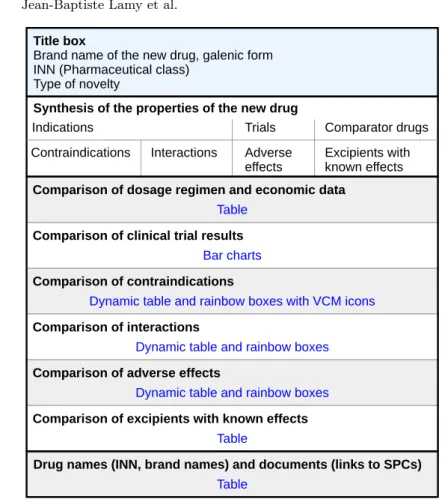
The system was implemented as an HTML website with CSS and JavaScript, the page being generated by Python scripts. Figure 4 shows the general structure of the page for presenting a new drug. In is made of four parts: (1) a title box identifying the new drug, (2) a synthesis listing the properties of the new drug and the name of the similar existing drugs (comparators), (3) a comparative part, comparing the clinical and economic properties of the new drug with the comparators, and (4) a reference part, identifying all drugs and providing links
Fig. 4. General structure of the page presenting a new drug. Categories of drug prop-erties are shown in black, and visualization techniques in blue.
to SPCs. If a new drug has several indications, there is one page per indication, and the list of indications (in the synthesis) includes hyperlinks for navigating through the pages.
The comparative part is the main one. For comparing contraindications, in-teractions and adverse effects, i.e. the three lengthiest and more complex cat-egories of drug properties, it proposes two visualization techniques: interactive table and rainbow boxes. Buttons allow switching from one to the other. For contraindications, VCM icons have also been added two both techniques, as well as the synthesis.
4 Evaluation
The evaluation protocol was difficult to set up for the following reason: there is no possible gold standard for the decision of considering the new drug for future
After
Not ready to presc. Lack of info. Ready to presc.
Before 45 1 42
Not ready to prescribe
the new drug 14 14 0 0
Lack of information
about the new drug 39 20 1 18
Ready to prescribe the
new drug 35 11 0 24
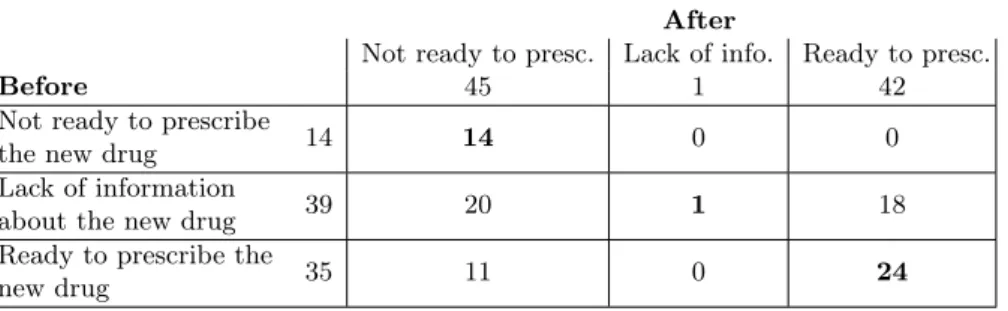
Table 1. Results of the evaluation.
prescriptions. The “good” decision rather depends on the GP himself, his convic-tion, his practice and his patient base. Consequently, during the evaluaconvic-tion, we did not compare the GPs decisions to a gold standard, but we rather evaluated the ability of the visual decision support system to change the opinion of the GPs. Thus, we performed a before vs after evaluation.
4.1 Recruitment
We recruited 22 GPs through an association responsible for the ongoing training of doctors. 12 were men, 10 women, and the mean age was 54.6.
4.2 Protocol
The evaluation was carried on a prototype of the website with the 4 new drugs. During the evaluation session, the website was first presented to the GPs in about 20 minutes, including the various visualization methods described above. GPs were asked to fill a first questionnaire in which they indicated, for each of the 4 new drugs, whether they lacked information about it and whether they were ready to prescribe it in their practice. Then, GPs consulted the decision support system for 45 minutes. Finally, they completed a second questionnaire with the same questions as in the first questionnaire, and a general discussion was conducted.
4.3 Results
88 decisions were collected (22 GPs × 4 new drugs), both before and after the use of the decision support tool. Each decision was categorized in one of three categories: (1) the GP lacks of information about the new drug (this usually implies that the GP will not prescribe the new drug), (2) the GP has enough information and he is not ready to prescribe the new drug, and (3) the GP has enough information and he is ready to prescribe the new drug.
Table 1 shows the distribution of the 88 decisions among the 3 categories, before and after the use of the decision support tool. In 39 cases, the GP lacked information before; after, in about half of these cases, he decided to retain the
new drug for future prescriptions, and he decided not to retain it in the other half. In only 1 case, the GP still lacked information after consulting the decision support tool. In 35 cases, the GP was ready to prescribe the new drug before; in about a third of these cases, he changed his mind after, and decided not to consider the new drug for future prescriptions. In 14 cases, the GP was not ready to prescribe the new drug before; in all of these cases, the GP stayed on his decision.
Therefore, we observed that, when information was lacking, the decision sup-port tool was sufficient for GPs to make a decision in all cases but one. In ad-dition, in some situation, GPs discovered that they were overconfident about a new drug they were ready to prescribe, and they changed their mind.
5 Discussion
In this paper, we presented a visual decision support system for helping physi-cians to decide whether they should consider a new drug for their future pre-scriptions. This approach differs from the usual approach for decision support in medicine: the usual approach consists in providing explicit recommendations to the physicians (guided approach) or raising alarms or reminders when the decision made is not the expected one (criticizing approach). However, in the context of new drugs, these usual approaches would have been difficult to imple-ment since, in many situations, there is no “right” decision. On the contrary the appropriate decision depends on the physician experience and his patient base. Moreover, in the medical domain, the acceptance of traditional clinical decision support systems is often low [15].
In the proposed approach, voluminous drug information is provided to the physicians as a decision aid, using visualization techniques for facilitating their consultation. This approach is promising because, with the advent of “big data”, more and more information and knowledge is available. According to distributed cognition [12], visualization can amplify the user cognition. In the presented sys-tem, the visualizations allow a global overview and a comparison of the properties of the drugs available for a given indication. These visualizations can help the physician to answer several typical questions involved in the decision of whether to consider a new drug for future prescriptions, such as: what are the contraindi-cations of the new drug? Could the new drug be prescribed when existing drugs cannot (due to contraindications)? What are the most frequent adverse effects of the new drug? Does the new drug have fewer adverse effects than existing ones? fewer serious adverse effects? How does the new drug compare with the drug X that the physician usually prescribe? The responses to these questions provide argument in favor or against the new drug, and therefore support the decision-making process. This approach also provides a visual explanation for the responses found, thus it might improve the acceptance by physicians.
F Nake [16] defines knowledge as information that can be reused in an-other context, thus acquiring a pragmatic dimension. In that sense, the drug information visualized in this study is actually knowledge: the drug properties
are determined during clinical trials on a controlled population of patients, and then these properties are considered for prescribing the drug to another patient outside this population (thus another context). In the literature, knowledge vi-sualization has been proposed for knowledge acquisition, knowledge transfer [4] and for improving communication [2], but rarely for decision support. Medical examples include the presentation of antibiotic spectrum of activity for helping physicians to prescribe antibiotics [22], the precise description of a patient with Sleep Apnea Syndrome [23] and VisualDecisionLinc, a visual analytics approach for clinical decision support in psychiatry [13].
The evaluation showed that almost all GPs lacking information were able to find the missing information using the decision support system, and that some GPs that were ready to prescribe the new drug changed their mind after consulting the system. However, we did not observe any GP that was not ready to prescribe the new drug before, and changed his mind. A possible explanation is that GPs not ready to prescribe might have a good reason for that, for instance they might be already aware of a strong negative property of the drug (e.g. a serious adverse effects or a high cost). On the contrary, GPs ready to prescribe might ignore some important issue with the drug and, by consulting the system, they can discover it and then change their mind.
Few studies have focused on the comparison of several drugs. C Wroe et al. [25] proposed DOPAMINE, a spreadsheet-like matrix-based tool, but this ap-proach was mostly aimed toward authoring drug properties. Iordatii et al. [6] proposed a matrix-based approach for comparing the contraindications and the adverse effects of a new drug to a single reference drug (thus the comparison was limited to two drugs). Drug Fact Boxes [20] offer some comparative drug information, but target patients rather than GPs and does not provide an ex-haustive list of the drug properties. More recently, Informulary proposed a drug fact boxes website (http://drugfactsbox.co), but the comparative information is limited to clinical trial results. On the Internet, Iodine (http://www.iodine.com) is a website that collects drug information from patients, including the efficacy of the drug and the adverse events they encountered. Iodine uses tables to com-pare similar drugs, but the list of the effects of each drug is displayed in a single row, which is tedious for making comparisons. In addition, the quality of patient-collected data is difficult to assess. To conclude, all the proposed approaches were based on tables, whereas our system also relies on icons and rainbow boxes.
6 Conclusion
In this paper, we presented a visual decision support system for helping a physi-cian to decide whether he should consider a new drug for his future prescriptions. This system provides several advanced visual tools (icons, interactive tables and rainbow boxes) for facilitating the comparison of a new drug with the already existent drug for the same indication, on the basis of the various clinical and economic drug properties. During a controlled evaluation, the system allowed GPs making a decision on four new drugs: all but one GPs lacking information
about a drug obtained enough information to make a decision, and some GPs that were ready to prescribe the new drug changed their mind.
Future works will focus on including additional new drugs in the system, the automatic extraction of drug knowledge from drug database, and the application of the visualization techniques developed for decision support in other domains. Acknowledgments. This work was funded by the French drug agency (ANSM, Agence Nationale de Sécurité du Médicament et des produits de santé) through the VIIIP project (AAP-2012-013).
References
1. Ballantyne PJ: Understanding users in the ’field’ of medications. Pharmacy 4(2), 19 (2016)
2. Bertschi, S., Bresciani, S., Crawford, T., Goebel, R., Kienreich, W., Lindner, M., Sabol, V., Vande Moere, A.: Knowledge visualisation currents: from text to art to culture, vol. 13, chap. What is knowledge visualisation? Eight reflections on an evolving discipline, p. 32. Springer-Verlag, London, United Kindom (2013) 3. Bindslev, J.B.B., Schroll, J., Gøtzsche, P.C., Lundh, A.: Underreporting of conflicts
of interest in clinical practice guidelines: cross sectional study. BMC medical ethics 14, 19 (2013). DOI {10.1186/1472-6939-14-19}
4. Burkhard RA: Knowledge and information visualization, vol. 226-243, chap. To-wards a framework and a model for knowledge visualization: Synergies between information and knowledge visualization. Berlin Heidelberg (2005)
5. Garattini, S., Bertele, V.: Efficacy, safety, and cost of new anticancer drugs. BMJ 325, 269 (2002)
6. Iordatii, M., Venot, A., Duclos, C.: Design and evaluation of a software for the objective and easy-to-read presentation of new drug properties to physicians. BMC medical informatics and decision making 15, 42 (2015)
7. Isern, D., Moreno, A.: Computer-based execution of clinical guidelines: A review. Int J Med Inf 77(12), 787–808 (2008)
8. Lamy, J.B., Berthelot, H., Favre, M.: Rainbow boxes: a technique for visualizing overlapping sets and an application to the comparison of drugs properties. In: 20th International Conference Information Visualisation, vol. 253-260. Lisboa, Portugal (2016)
9. Lamy, J.B., Duclos, C., Bar-Hen, A., Ouvrard, P., Venot, A.: An iconic language for the graphical representation of medical concepts. BMC Medical Informatics and Decision Making 8, 16 (2008)
10. Lamy, J.B., Soualmia, L.F., Kerdelhué, G., Venot, A., Duclos, C.: Validating the semantics of a medical iconic language using ontological reasoning. J Biomed Inform 46(1), 56–67 (2013)
11. Lamy, J.B., Venot, A., Bar-Hen, A., Ouvrard, P., Duclos, C.: Design of a graphical and interactive interface for facilitating access to drug contraindications, cautions for use, interactions and adverse effects. BMC Medical Informatics and Decision Making 8, 21 (2008)
12. Liu, Z., Nersessian, N., Stasko, J.: Distributed cognition as a theoretical frame-work for information visualization. In: IEEE Transactions on Visualization and Computer Graphics, vol. 14 (2008)
13. Mane, K.K., Bizon, C., Schmitt, C., Owen, P., Burchett, B., Pietrobon, R., Gersing, K.: VisualDecisionLinc: A visual analytics approach for comparative effectiveness-based clinical decision support in psychiatry. J Biomed Inform 45(1), 101–106 (2012)
14. Moore, T.J., Cohen, M.R., Furberg, C.D.: Serious Adverse Drug Events Reported to the Food and Drug Administration, 1998-2005. Arch Intern Med 167, 1752–1759 (2007)
15. Moxey, A., Robertson, J., Newby, D., Hains, I., Williamson, M., Pearson, S.A.: Computerized clinical decision support for prescribing: provision does not guaran-tee uptake. J Am Med Inform Assoc 17(1), 25–33 (2010). DOI {10.1197/jamia. M3170}
16. Nake F: Data, Information, and Knowledge. In: Liu, K. and Clarke, R.J. and An-dersen, P.B. and Stamper, R.K. (ed.) Organizational Semiotics: Evolving a Science of Information Systems, vol. 41-50. Kluwer, Montréal, Québec, Canada (2001) 17. Olson MK: Are novel drugs more risky for patients than less novel drugs? J Health
Econ 23, 1135–1158 (2004)
18. Rubin, D., Shah, N., Noy, N.: Biomedical ontologies: a functional perspective. Brief Bioinform 1(9), 75–90 (2008)
19. Schulz, S., Jansen, L.: Formal ontologies in biomedical knowledge representation. Yearb Med Inform 8, 132–46 (2013)
20. Schwartz, L.M., Woloshin, S.: The Drug Facts Box: Improving the communication of prescription drug information. Proc Natl Acad Sci U S A 110 Suppl 3, 14,069– 74 (2013). DOI {10.1073/pnas.1214646110}
21. Spurling, G.K., Mansfield, P.R., Montgomery, B.D., Lexchin, J., Doust, J., Oth-man, N., Vitry, A.I.: Information from pharmaceutical companies and the quality, quantity, and cost of physicians’ prescribing: a systematic review. PLoS medicine 7(10), e1000,352 (2010)
22. Tsopra, R., Jais, J.P., Venot, A., Duclos, C.: Comparison of two kinds of interface, based on guided navigation or usability principles, for improving the adoption of computerized decision support systems: application to the prescription of antibi-otics. J Am Med Inform Assoc (2013)
23. Ugon, A., Philippe, C., Pietrasz, S., Ganascia, J.G., Levy, P.P.: OPTISAS a new method to analyse patients with Sleep Apnea Syndrome. Stud Health Technol Inform 136, 547–52 (2008)
24. Watkins, C., Harvey, I., Carthy, P., Robinson, E., Brawn, R.: Attitudes and behav-ior of general practitioners and their prescribing costs: a national cross sectional survey. Qual Saf Health Care 12, 29–34 (2003)
25. Wroe, C., Solomon, W., Rector, A., Rogers, J.: DOPAMINE: a tool for visualizing clinical properties of generic drugs. In: Proceedings of the Fifth Workshop on Intelligent Data Analysis in Medicine and Pharmacology (IDAMAP), vol. 61-65 (2000)