Designing Effective Interfaces for Audiovisual Media
Hijung Valentina Shin B.S.E., Princeton University (2011)
Submitted to the Department of Electrical Engineering and Computer Science in Partial Fulfillment of the Requirements for the Degree of
Doctor of Philosophy at the
MASSACHUSETTS INSTITUTE OF TECHNOLOGY September 2017
C 2017 Massachusetts Institute of Technology. All rights reserved
Signature of Author ...
Signature redacted
Department of Electrical Engineering and Computer ScienceAugust 31 2017
Signature redacted
C ertified by ...
Fr6do Durand Professor of Electrical, gineering and Computer Science Thesis Supervisor
Signature redacted
A ccepted by ...
J LeieA. Kolodziejski Professor of Electrical Engineering and Computer Science Chair, Department Committee on Graduate Students MASSACHUSETTS INSTITUTE
OF TECHNQOGY
OCT 2
6
2017
ABSTRACT
Audiovisual media is an attractive and rich source of information, widely used in education, entertainment and industry. Unfortunately, audiovisual media can take painfully long hours to author, edit and navigate. This dissertation looks at ways to make creation, navigation and manipulation of audiovisual media easier and more convenient. In particular, we explore novel interaction techniques applied to three specific domains: speech recordings, lecture videos and presentations. For each domain, we propose a design solution to facilitate user interaction with the medium and implement the solution in a prototype interface. In doing so, we propose several design principles for effective audiovisual media interfaces that
Dedicated to the loving memory of Msgr. Javier Echevarria. 1932-2016
PUBLICATIONS
Some of the research leading to this thesis has appeared previously in the following publications.
* Hijung Shin, Floraine Berthouzoz, Wilmot Li, Fredo Durand. Visual Transcripts: Lecture Notes for Blackboard Style Lecture Videos. - ACM Transactions on Graphics (TOG) 34.6 (2015): 240.
* Hijung Shin, Wilmot Li, Fredo Durand.
Voice Script: Dynamic Authoring of Audio with Linked Scripts.
- Proceedings of the 29th Annual Symposium on User Interface
CONTENTS
1 INTRODUCTION 11
i.1 Challenges of Multimedia ... 11
1.2 The Goal: Effective Interfaces for Multimedia ... 14
1.3 Opportunities for Multimedia Interfaces ... 14
1.4 Overview ... 16
1.5 Related Work ... ... 18
1.5.1 Brow sing ... . 18
1.5.2 Authoring . . . . 19
1.5.3 Delivery . . . . 21
2 NAVIGATING LECTURE VIDEOS 23 2.1 Introduction . . . . 24
2.2 Previous Work . . . . 26
2.2.1 Video Visualization . . . . ... . . . . 26
2.2.2 Tools for Online Lecture Videos . . . . 27
2.3 Design Principles . . . . 27
2.4 The VisualTranscript Interface . . . . 29
2.5 Algorithm s . . . . 32
2.5.1 Pre-processing . . . . 32
2.5.2 Segmenting Visual Content . . . . 33
2.5.3 Structuring Transcript Content . . . .. 39
2.5.4 Layout and Formatting . . . . 40
2.6 User Evaluation . . . . 41
2.6.1 User Tasks . . . . 41
2.6.2 Findings and Discussion . . . . .. . . . 43
2.7 Discussion . . . . .45 2.7.1 Lim itations . . . . 45
2.7.2 Conclusion . . . . 47
3 AUTHORING VOICE RECORDINGS 49 3.1 Introduction . . . . 49
3.2 Previous Work . . . ... 51
3.2.1 Scripting . . . . .51 3.2.2 Recording and Editing Audio . . . . 51
3.2.3 Text-Based Audio Editing . . . .. 52
3.3 Design Principles . . . ... 52
3.4 The VoiceScript Interface . . . .. . 53
3.4.1 Typical Usage Scenarios . . . . 54
3.5 Algorithms . . . ...57
3.5.1 Transcribing the audio recording . . . .. . 58
3.5.2 Aligning the transcript to the master-script . . . 58
3.6 User Evaluation . . . . 62
3.6.1 Informal User Study . . . . 62
3.7 Discussion . . . .
3.7.1 Limitations . . . .
3.7.2 Conclusion. . . . .
4 DELIVERING SLIDE PRESENTATIONS
4.1 Introduction . . . .
4.2 Previous Work . . . .
4.2.1 Presentation Software. . . . . . 4.2.2 Nonlinear Presentations. .
4.2.3 Controlling Presentations. 4.2.4 Inking on Digital Documents. .
4.2.5 Beautifying Ink. . . . .
4.3 Design Principles . . . . 4.3.1 Current Practices and Needs .
4.3.2 Design Goals . . . . 4.4 The Aparecium Interface . . . . 4.4.1 Slide authoring . . . .
4.4.2 Inking during delivery . . . . .
4.5 User Evaluation . . . .
4.5.1 Study 1: Presenter Perspective
4.5.2 Study 2: Audience Perspective
4.5.3 Findings and Discussion . . . .
4.6 Limitations and Discussion . . . . 4.6.1 Conclusion. . . . . 5 CONCLUSION
-5.1 Contributions . . . .
5.2 Future Directions . . . . 5.2.1 Facilitating Collaborative Authoring of Audio-visual Media . . . . 5.2.2 Interactive Media . . . . 5.2.3 Human-Interface-Media Interaction . . . . BIBLIOGRAPHY . . . . 66 . . . . 66 . . . . 68 69 . . . . 69 . . . . 7 1 . . . . 71 . . . . 72 . . . . 72 . . . . 72 . . . . 72 . . . . 73 . . . . 73 . . . . 74 . . . . 75 . . . . 76 . . . . 76 . . . . 79 . . . . 8o . . . . 82 . . . . 83 . . . . 86 . . . . 90 91 . . . . 91 93 93 94 95 97
INTRODUCTION
Multimedia is not more media, but the employment of various kinds of media (and hybrid media) for what they each offer to advance the narrative.
- Fred Ritchin [82]
1.1 CHALLENGES OF MULTIMEDIA
The main subject of this dissertation is multimedia, content that com-bines multiple forms of media such as text, graphics, audio and video. In particular, we focus on audiovisual media that have both a sound and a visual component. For example, presentations that involve graph-ics and sound, audiobooks that combine text with audio, and videos that incorporate graphics, sound and text are all different types of audiovisual media.
As these everyday examples illustrate, audiovisual media has be-come commonplace. From the consumer's perspective, we encounter them in our normal activities, for instance, listening to a music while following its lyrics in text, watching an advertisement or sitting in on a presentation. We also frequently produce audiovisuals to communi-cate our ideas, for example, by creating a blog or sharing a video on YouTube. In addition, new technologies and online platforms encour-age new types of audiovisual media such as GoPro videos, 360-degree videos, interactive infographics or online lectures.
Unfortunately, ease of access does not translate directly to efficiency or good quality. Simply navigating audiovisual media to search for in-formation can be tedious. Consider the times you had to listen to a voicemail repeatedly to get the call back number, or when you had to play the video back and forth to find a specific moment. Producing compelling audiovisual media is even more time-consuming and dif-ficult. People spend hours to produce a single slide of presentation or a few seconds of video.
This dissertation explores three specific domains of audiovisual me-dia: navigating lecture videos, authoring speech recordings and deliv-ering slide presentations. For each domain, we propose a design so-lution to facilitate user interaction with the medium and implement the solution in a prototype interface. In doing so, we flesh out several design principles for effective audiovisual media interfaces that
gen-eralize to a wide range of applications and user tasks.
A major part of the difficulty in dealing with audiovisual media lies in the nature of multimedia itself. For one, as its name implies, multimedia blend multiple modalities, each of which have different characteristic strengths and weaknesses. Let's consider some of the basic components of multimedia.
TEXT: As a static representation of language, text is one of the most common forms of communication that most people are familiar with. It is easy to author and edit digitally, and many algorithms exist to process text, for instance, for text summarization or com-parison. Text is also easy to navigate by skimming or searching. It can be organized spatially to emphasize structure and further facilitate navigation. In addition, different visual attributes such as typeface, font size or color can be used to convey extra infor-mation such as emphasis.
On the other hand, some types of information is less suited for textual representation. For example, describing a complicated diagram or a piece of music would be difficult to achieve using text alone. There is also a limit to conveying tonal nuances or voice.
All
a
-WddL AUDIO: Audio is a rich source of information that can convey notonly speech but any other sound that may not have an accurate textual description, for example, the sound of a heartbeat or the
Figure 1: Audio sound of ocean waves. It is an effective media for evoking
emo-represented in tion or reflecting mood.
waveform.
However, most audio lack appropriate visual representation, which makes it difficult to navigate or edit. The waveform is the most generic representation used in many applications, but it is ambiguous and hard to manipulate (Figure 1). For instance, detecting or separating the sound of one instrument from a mu-sic recording is a challenging research problem.
IMAGE: A picture is worth a thousand words. Human perception is
visually oriented, so images can be a powerful tool to commu-nicate rich information intuitively in a small amount of space. Images are especially useful for conveying spatial relationships, structure, or detailed shape. Consider describing the layout of a building or the features of a face only using words versus show-ing a picture of the floor plan or the face.
On the other hand, it is difficult to convey information about movement or sequence using a still image. Oftentimes, text,
la-bels or animation effects are attached to a still image to focus the viewers' attention to a specific part of the image or to clarify the intended message.
ANIMATION /VIDEO: Animations are created from a set of static frames whereas videos record a continuous event which is then broken up into a series of frames. Both media are especially use-ful for illustrating concepts that involve motion or sequence. As with audio, it takes time to navigate through the content of an animation or video and it is difficult to skim or search.
TIME: In addition to having multiple modalities, audiovisual media is also intricately linked with time. Time imposes a linear struc-ture on the media and is expressed, for example, with timelines on videos, scrollbars on websites and page numbers on slides. Whereas time provides a natural order to the media, it can also make non-linear interactions more cumbersome. For instance, watching a video from beginning to end is easy, but searching for specific scenes is harder.
Time also imposes a certain speed or pace on the media, and makes each moment within the media transient. Video frames, parts of webpages or slides are displayed for a limited amount of time and replaced with different, successive information. The abundance of concurrent and transitory information makes au-diovisual media difficult to digest and manipulate compared to static media.
Finally, synchronization between multiple modalities is an es-sential part of audiovisual media. Effective navigation and ma-nipulation of the media both require that the concurrence be-tween multiple modes is appreciated and maintained. For in-stance, editing the audio track of a video normally requires edit-ing the correspondedit-ing visual footage as well.
In sum, the complex interplay of multimodal information with each other and with time makes audiovisual media difficult to author, edit or navigate efficiently. Workflows around audiovisual media usually involve nonlinear navigation and iteration between different modali-ties. Unfortunately, conventional media browsers are best suited for linear navigation. Prevalent editing tools also handle each modality independently, leaving users to manage their interconnection manu-ally. Both consumers and producers of audiovisual media have a right to be frustrated at the inefficiency caused by the lack of user-friendly
and media-friendly interfaces that takes into account the users'
I
Figure 3: Before convenient interfaces were developed, text documents were neither easy to author nor simple to navigate. (Above) Tripitaka Koreana, a collection of Buddhist scriptures carved onto 81,258 wooden printing blocks in 13th century Korea. (Below) Each wood block measures 24cm x 70cm. The blocks are stored in Haeinsa, a1.2 THE GOAL: EFFECTIVE INTERFACES FOR MULTIMEDIA
Just as effective multimedia carefully blends different types of me-dia to advance the narrative, effective interfaces for multimeme-dia must capitalize on the characteristics of each medium to expose the me-dia to the users and provide tools to interact with it efficiently. Well-designed interfaces facilitate the users' workflow, be it authoring, edit-ing or browsedit-ing, and whether it is linear or nonlinear. With the help of such interfaces, working with audiovisual media should be as sim-ple and natural as working with text documents.
Text documents are easy to navigate. One can read them carefully or skim through them. There are efficient techniques to search for specific information. For example, a table of contents, index, alpha-betically organized dictionaries and simple text search functions are well-established systems that are easy to use. Similarly, we create and edit text documents every day seemingly effortlessly, whenever we write an e-mail, a business report or a letter.
As natural as it seems today, text documents did not start out as an easy medium. Consider the 16-feet long scroll containing the text of the Diamond Sutra printed in 9th century China, or the Tripitaka Ko-reana, a collection of Buddhist scriptures carved onto 81,258 wooden printing blocks in 13th century Korea (Figure 3). These text docu-ments were neither painless to author nor easy to navigate. Even af-ter the advent of digital word processors in the 196os, it took several decades until the what-you-see-is-what-you-get (WYSIWYG) form of word processors as we know them today became commonplace. Now, with online applications such as Google Docs, users can even collab-orate on a single text document synchronously or asynchronously with ease. Wikipedia is an example of a new type of collaborative document that became possible through the development of online, collaborative text editors.
Similar to text documents, better interfaces can make it easier for users to author, edit, navigate and collaborate on audiovisual media. Improved efficiency can also lead to greater expressivity and even new types of media. This dissertation takes a step towards this goal by exploring several approaches to designing effective interfaces for audiovisual media.
1.3 OPPORTUNITIES FOR MULTIMEDIA INTERFACES
Previously, we argued that the complex combination of multiple modal-ities make multimedia especially difficult to navigate and manipulate. Yet, the same multimodal quality can be turned into opportunities for
designing effective user interfaces for multimedia. The specific design strategy for an interface depends on the media as well as the interac-tion that the interface is trying to support (e.g., authoring, editing or browsing). Here, we outline several broad principles that emerged through our work on several different applications.
Principle i. Harness spatial and temporal structure:
The different components of multimedia are tightly associated with each other in time and space. For instance, video frames that are ad-jacent in time are likely to have similar content. Simultaneous audio and visuals are also closely related to each other. Even within a single image or a slide, spatial layout can reveal meaningful patterns about the content.
Inferring the spatial and temporal structure embedded in the me-dia can help design effective interactions. For one, explicitly visual-izing the structure can help viewers navigate the media efficiently. In addition, interfaces can facilitate editing by keeping track of and maintaining meaningful structure, for instance, the synchronization between different components.
Principle 2. Exploit different modalities tofacilitate various types of
interac-tion:
Each of the modalities that composes audiovisual media lends itself more naturally to different types of user interaction or user tasks. For example, during navigation, text is easier to skim or search, whereas audio is more effective in conveying tonal nuances or flow. During authoring, speaking is faster than writing, but editing audio is gener-ally more time consuming than editing text.
Interfaces for audiovisual media can take advantage of different modalities or representations to facilitate different parts of user tasks. For example, in Chapter 3, we propose an interface for authoring voice recordings, which supports both authoring and editing via speech and text. A key challenge in designing such multimodal interfaces is to enable seamless interaction between the different modalities. That is, edits in one modality should be translatable into meaningful oper-ations in other modalities.
Principle 3. Support direct manipulation with automation:
Hybrid approaches that combine direct manipulation with automatic algorithms have been proposed and successfully implemented in many
application domains, including authoring of 3D models [45, 101],
ani-mations [12], and illustrations [26]. Automatic algorithms can greatly simplify tedious tasks and allow users to focus on the creative part of the workflow.
In light of the previous two principles, automatic algorithms can also take advantage of the inherent structure of the media or char-acteristics of different modalities. For example, in Chapter 2, we use an automatic algorithm to extract a set of static images from a video by analyzing the spatial and temporal structure of the visuals drawn continuously in the video. In Chapter 3, we take advantage of text-a discrete modality that is easier to process automatically-in order to compare and align audio. Finally, in Chapter 4, we use pre-authored digital slides to achieve, among other things, real-time beautification effects of hand-drawn strokes.
As the following chapters will illustrate, these principles are instan-tiated for each application through a combination of interface design, visualization, algorithms and data structures.
1.4 OVERVIEW
This dissertation is about designing effective interfaces to support the authoring and navigation of multimedia. We explore a range of appli-cations - navigating lecture videos, authoring speech recordings and delivering slide presentations. We originally considered these appli-cations in separate publiappli-cations, presented to different communities in computer graphics and human computer interaction. The goal of this text is to distill the common themes across these applications and present them in a unified way, along with insights gained over the course of our work. Subsequent chapters are organized by appli-cation domain:
Navigating Lecture Videos (Chapter 2):
Lecture videos are widely used for learning, but existing video player interfaces are poorly equipped to support frequent learner tasks. For example, it is difficult to search or skim the content, or view the lec-ture material at one's own pace. For these and other reasons, some people prefer to read lecture notes than to watch videos.
To facilitate learning with videos, we propose VisualTranscript, a readable and skimmable interface for lecture videos. VisualTran-script transforms blackboard-style lecture videos into interactive lec-ture notes, interleaving static figures with hierarchically organized paragraphs of text. The interface serves as a short summary of the
video as well as a convenient interface to browse or search through the lecture.
We describe automatic algorithms to (1) extract a discrete set of key illustrations from the video frames, and (2) to analyze the audio con-tent and classify sentences into two categorizes: depictive sentences that verbalize what the illustrations depict, and explanatory sentences that provide additional information not directly represented by the il-lustrations. Both algorithms take advantage of spatial and temporal structures inferred from the video.
We compare VisualTranscript with a standard video player, and a state-of-the-art interface designed specifically for blackboard-style lecture videos. User evaluation suggests that users prefer VisualTran-script for learning and that VisualTranVisualTran-script is effective in helping them browse or search through lecture videos.
Authoring Speech Recordings (Chapter 3):
Speech recordings are central to modern media from podcasts to audio books to e-lectures and voice-overs. Authoring these record-ings involves an iterative back-and-forth process between script writ-ing/editing and audio recordwrit-ing/editing. Unfortunately, most exist-ing tools treat the script and the audio separately, makexist-ing the iterative workflow very tedious.
We present VoiceScript, an interface to support a dynamic work-flow for script writing, audio recording and audio editing. VoiceScript integrates the script with the audio such that, as the user writes the script or records speech, edits to the script are translated to the audio and vice versa.
Through informal user studies, we demonstrate that VoiceScript greatly facilitates the audio authoring process in various scenarios.
Delivering Slide Presentations(Chapter 4):
Presentations are an important component of both classroom and on-line instruction, and presentation tools have a significant impact on how we teach and learn. Electronic slides, the dominant type of pre-sentation technology today, have several shortcomings. Pre-authored slides take a long time to prepare and restrict how their contents are presented. There is little flexibility on the order and granularity of how information is displayed during the presentation.
We introduce Aparecium, a presentation interface that helps pre-senters deliver flexible and engaging presentations by combining the aesthetics and organization of electronic slides with the spontaneity of inking. In Aparecium, presenters use inking interactions to de-liver slide presentations. With inking, presenters can (1) reveal pre-authored content to the audience, (2) make annotations on top of the slide, and (3) adjust the slide layout to create blank space. Pre-authored slides help improve the visual aesthetics and organization of the slides, while inking enables presenters to have flexibility and fine-grained control over the content and pace of the presentation.
In a user study comparing Aparecium with baseline presentation tools, we found that our interface generally improves presentation quality without increasing the burden on the presenter at author-ing or presentation time. Especially for text-centered or step-by-step process-driven content, both audiences and presenters preferred pre-sentations delivered using Aparecium.
Finally, Chapter 5 reviews our contributions and discusses insights gained from our work. The remainder of this chapter offers a brief overview of related work on multimedia interfaces.
1.5 RELATED WORK
Not surprisingly, interfaces for multimedia is a very broad subject that touches many fields of research, including human-computer in-teraction, computer vision, and computer graphics. Instead of attempt-ing to compile a comprehensive summary of the subject, we broadly categorize previous research according to different phases of users' workflows-browsing, authoring and delivery-and briefly review work that is closely related to the applications we present in this disserta-tion. The works cited are not intended to be an exhaustive list, but rather serve as an illustrative guide to various topics.
1.5.1 Browsing
A main purpose of media browsing interfaces is to improve the user's efficiency by making it easier to find and absorb useful information-in short, to reduce the browsinformation-ing time. Although specific techniques vary by media type and content, there are common strategies that ap-ply across different media.
Displaying Compact Visual Representation:
Skimming and browsing are inherently visual tasks, and we perform them instinctively, for example, while we read or window-shop. Com-pact visual representations of media can facilitate navigation by tak-ing advantage of our natural visual capacity.
Visual abstractions of a video can take many forms such as shorter video skims [32, 81], keyframes [67,68], montages [114], collages [119] and panoramas [28, 8o]. They can combine static images or videos with text [96]. Static representations can also take advantage of spatial layout to expose the structure of the video. For example, Boreczky et al. arrange selected keyframes into a comic style layout, representing important segments with larger frames [171 .Interactive techniques can enhance the summary, for example by allowing users to explore the video by zooming in to expose fine-scale temporal details [13].
Unlike video, audio is a medium that does not have a natural visual representation. Nevertheless, from early on graphical representations have been used to facilitate visual scanning and searching of audio, and in particular, speech [37, 109]. It has been shown that transcript texts are highly effective as an interface to support browsing [109,
122]. In some applications, accompanying visual media such as hand-written notes [113, 121] or video [55, 651 are also used to index audio.
Analyzing and Exposing Structure within Media:
In order to construct an effective visual representation, it is usually necessary to infer some type of structure from the media. For ex-ample, videos are summarized by extracting highlight scenes [23,
43], topical themes [125], or repetitive segments [31, 129]. Similarly, speech browsing interfaces take advantage of inferred speaker turns [124], emphasis [8] or pauses [9]. This information can be inferred from the main modality itself (e.g., extracting repetitive structure in music from its signal
[33]),
from accompanying modalities (e.g., extracting highlights of baseball games from audio [107]), or from additional sources (e.g., using the screenplay to infer the scene hierarchy of a movie [34, 98]). They can be computed automatically[33,
98, 107] orwith the help of manual annotation [27, 97].
1.5.2 Authoring
Authoring covers a wide range of tasks from capturing and browsing the source to drafting and editing the final product. An important objective of authoring interfaces is to make this workflow from the
initial source to the final output as fluid as possible. There are many considerations that go into supporting this goal. Here, we consider two themes that arise commonly across applications.
Translating between Modalities:
The modality of the final output is not necessarily the most conve-nient modality to interact with during the authoring process. Many studies attempt to facilitate authoring by enabling easier, less formal input modalities such as text, pen-interactions or gestures, and trans-lating them into appropriate operations on the final product. For ex-ample, transcript texts are used to edit videos [15, 21] or audio record-ings [105], hand-drawn sketches are translated into informal presenta-tions [76] or website designs [79], and physical gestures are captured to create cartoons [90] or 3D animations
[57]-The increasing availability of various types of interactive devices is also encouraging research in multimodal interfaces that support a combination of input modalities. For example, MultiPoint uses speech and pen to author presentation slides [1 12], while PixelTone combines speech and direct manipulation to edit photos
[73].
These interfaces aim to support a more human way of interacting with digital media similar to our day-to-day communication methods. Recent survey pa-pers [39, 117] provide a comprehensive review of this subject.Analyzing and Exploiting Relationship between Media:
It is common to combine multiple raw sources (e.g., video footage, audio tracks) to compose a single output media. Similar to browsing that takes advantage of inherent structures within a single medium, editing can exploit inherent relationships between multiple streams of media. For example, Arev et al. infer the 3D spatial relationship be-tween multiple cameras capturing a social event in order to produce a coherent cut video of the event [7]. Bryan et al. synchronize multiple-camera videos of a same event using audio features [19]. QuickCut facilitates editing of narrated videos by aligning audio narration with semantically relevant video segments by taking advantage of user an-notations and the narration transcript [115]. Li et al. present a method to synchronize slideshows of paintings to accompanying music by an-alyzing their common emotional features
[75].
Unlike work on video or audio summarization, these works deal with relational structures across multiple input sources.1.5.3 Delivery
Once authored, most media is delivered as-is to the consumer in a static format. However, some media such as presentations involve a dynamic aspect in which the media can be delivered interactively in a live setting. Improving flexibility for live performance is a key focus in this area.
Supporting Flexible Modes of Interaction:
One strategy to improve flexibility during performance is to support flexible modes of interaction to control the media. For example, in-stead of predetermined linear presentations, Palette provides random access to slides using physical cards [92]. Similarly, zooming user in-terfaces allow flexible presentation paths through spatial navigation of slides [149, 77]. Baudel and Beaudouin-Lafon propose hand gestures as an intuitive mode to control slides [14]. Other work enable presen-ters to add improvised content by inking [6, 48]. A common concern across these work is providing an intuitive interaction mode that does not further burden the presenter at performance time.
Each of our works focuses on a different medium and a different part of the users' workflow. However, they are inspired by many of the same principles that we observe in previous work. In each chapter, we also include a review of work that is more directly related to the application being discussed.
NAVIGATING LECTURE VIDEOS
The day is coming when the work done
by correspondence will be greater in amount
than that done in the classroom of our academies and colleges. - William Rainey Harper
[54]
How viewers watch videos depends on the content of the video and the viewers' needs. For example, watching a film in a theater is a very different experience from watching a video tutorial on YouTube about how to cook brussel sprouts. Even for the same video, someone who is watching it for the first time may have a different approach from someone who has seen the video previously and is watching it again only to review. In this chapter, we focus on the scenario of watching lecture videos.
Lecture videos are growing in popularity, especially through Mas-sive Open Online Courses (MOOCs) and flipped classroom models. However, learning with these videos using existing video player inter-faces can be challenging. Viewers cannot digest the lecture material at their own pace, and it is also difficult to search or skim the con-tent. For these and other reasons, some viewers prefer lecture notes or textbooks to videos.
This chapter introduces VisualTranscript, a readable interface for lecture videos, that was designed to address some of these limitations. VisualTranscript resembles lecture notes combining figures and text. To generate VisualTranscripts, we take advantage of the spatial and temporal structures embedded in lecture videos. First, we segment the visual content of a lecture into a set of discrete illustrations that correspond to equations, figures, or lines of text. Then, we analyze the temporal correspondence between the transcript and the visuals to determine their relationships. Finally, based on the inferred rela-tionships, we arrange the text and figures into a hierarchical and lin-ear layout.
We compare VisualTranscript with a standard video player, and a state-of-the-art interface designed specifically for lecture videos. User evaluation suggests that users prefer VisualTranscript for the task of learning and that VisualTranscript facilitates browsing and searching in lecture videos.
Fundamental theorem of calculus
Khan Academy
And I have these brackets here, so it also includes a and b in the interval. So let me graph this just so we get sense of what I'm talking about.
A
Now our lower endpoint is a, so that's a right over there.
Our upper boundary is b. Let me make that clear.
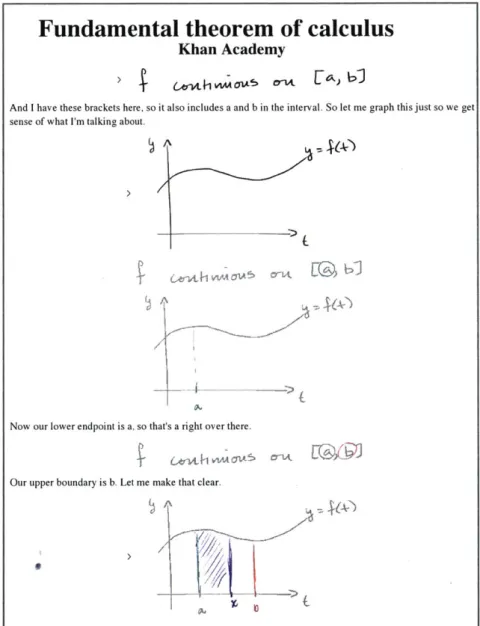
Figure 5: Example of a VisualTranscript output from the Khan Academy video on
the 'Fundamental theorem of calculus.' Visual Transcript interleaves figures with short
paragraphs of text, making it easy to skim or search through the lecture.
2.1 INTRODUCTION
Despite the increasingly important and broad role of lecture videos in education, learning from such videos poses some challenges. It is difficult for viewers to consume video content at their own pace [26]. To skip quickly through familiar concepts or slowly review more diffi-cult material, the viewer must interrupt playback and scrub back-and-forth in the timeline. It is also difficult to find specific information in a video. While scrubbing allows users to browse the visual information in the lecture, it is not effective for skimming the audio content, which
often includes critical explanations and context that accompany the visuals. As an alternative, some platforms (e.g., Khan Academy and YouTube) provide synchronized transcripts that allow users to click on a phrase and play the video at that location. However, skimming the transcript for relevant content can also be challenging since the text is not structured, and viewers must click on various parts of the text to see the corresponding visuals. Finally, it is hard to get a quick overview of the lecture content without watching the entire video. For these and other reasons, some people prefer static learning materials such as textbooks or printed lecture notes over videos.
Inspired by lecture notes, we present VisualTranscript, a readable interface for both the visual and audio content of a lecture video that facilitates reviewing, browsing and navigation. We focus on blackboard-style lectures. Here, we use the term blackboard-blackboard-style to refer to lectures that are recorded on a tablet which show a possibly infinite black-board (or whiteblack-board) where the instructor writes down by hand the content of the lecture. VisualTranscripts aggregate the full lec-ture content in a struclec-tured format where visual information is seg-mented and grouped with the corresponding narration text. For ex-ample, Figure 5 shows our automatically generated output for a math lecture that interleaves verbal explanations with corresponding equa-tions written on the board. By default, VisualTranscripts hide redun-dant information to show a compact representation of the content that viewers can expand interactively to show relevant details. Presenting video content in this manner allows users to review the lecture at their own pace while getting both the visual and textual information in a readable, skimmable format. VisualTranscripts is also linked to the video such that clicking on the text or the visuals plays the video from the corresponding location. In this respect, VisualTranscripts of-fer many of the benefits of traditional static media, such as textbooks and lecture notes, while also giving viewers direct access to the video content.
There are two main challenges in transforming a video and its tran-scribed audio into a VisualTranscript: (1) visuals, which are drawn progressively on the board, must be discretized into a set of mean-ingful figures, and (2) such figures and text representing the audio content must be organized into a compact, structured format that emphasizes the relationships between the two channels of informa-tion. To segment the visuals into meaningful figures, we propose a dynamic programming approach that takes into account both the spa-tial layout of strokes and the time when they were drawn. We further time-align the transcript with the audio and use this alignment to es-tablish correspondences between the visuals and the text. Finally, we use the visual-text correspondence to detect redundant information
and arrange the content in a compact, sequential layout where the text is organized into readable paragraphs.
We evaluate our approach with a user study that compares Visu-alTranscript with a standard video player with an interactive tran-script, and an existing state-of-the-art visual-based video player de-veloped by Monserrat et al [86]. We measure performance on summa-rization and search tasks, and observe how the participants interact with the interfaces. Evaluation results suggest that VisualTranscript is indeed an effective interface for studying lecture videos. Specifi-cally, users performed best using VisualTranscript for search tasks involving text. Users noted that VisualTranscript helped them to get a quick overview of the video including the details conveyed only through the text, and to efficiently focus on parts of interest. They also found the structured text easier to read and connect to relevant visuals than the baseline text-only transcript. In a post-study survey, users strongly preferred our interface for learning over the other two interfaces.
2.2 PREVIOUS WORK
2.2.1 Video Visualization
There is a large body of work that aims to automatically summarize videos to facilitate navigation and browsing, but most research fo-cuses on live action footage which is very different from educational videos. Recent survey papers [18, 116] comprehensively review these techniques, which can be broadly divided into two classes according to their output: video skims and still-image abstracts.
Video skims [40,56, 81, 93] summarize a longer video with a shorter video, usually consisting of segments extracted from the original video. These skims retain audio and motion elements and are especially use-ful for understanding dynamic scenes, but they are less suitable for conveying the dense, static information of blackboard-style lectures.
Still-image based methods [13, 17, 62, 118] primarily focus on con-veying the visual content of a video in static form through a collection of salient images extracted from the video. [30] and [99] developed a still-image based method specific to news stories that combines text and images into summaries.
Most relevant to our work is [28], which summarizes blackboard-style lectures by creating a panoramic frame of the board. In addition to the visual content presented on the board, our interface includes
the audio content and therefore maintains the sequence of the lecture and makes textual content also directly accessible.
2.2.2 Tools for Online Lecture Videos
Kim et al. use interaction data collected from MOOC platforms to introduce a set of techniques that augment existing video interface widgets [69]. For lecture videos based on slides, Li et al. use sepa-rate slides to automatically genesepa-rate table-of-content overviews [69]. These works annotate the original video with useful data to facilitate navigation, but do not reformat the video content. Pavel et al. provide a tool to create video digests, structured summaries of informational videos organized into chapters and sections [97] .They use only the transcript to segment and summarize the video, whereas we leverage both the visual and audio content.
Most closely related to our work is Monserrat et al.'s interface [86], which presents a summary image of blackboard-style lecture videos. Their image is composed of click-able visual links to support spatial and temporal navigation. Although they provide a search box for the transcript, text is not included as part of their summary display.
2.3 DESIGN PRINCIPLES
The design of VisualTranscript is informed by the following key char-acteristics of blackboard-style lectures:
Lectures present information progressively.
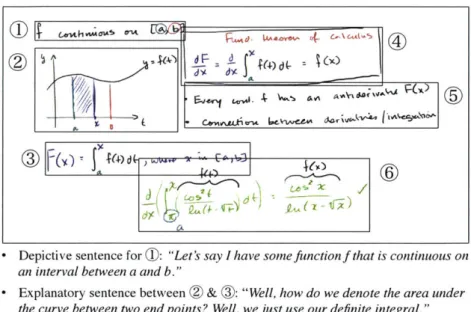
Most lectures convey concepts in a progressive manner where each new piece of information builds on the previously presented content. For example, Figure 6 (top) shows a panoramic image of the board for an entire lecture, where the labels show the order in which the contents were presented. Understanding the lecture often requires knowing this order. To emphasize presentation order, our VisualTran-script arranges all the content within the video in a top-to-bottom linear format.
Visuals are organized into discrete entities.
The visual content of a lecture is typically organized into well-defined entities (e.g., a line of text, an equation, an explanatory figure) that correspond to the set of presented concepts. For example, Figure 6
en-*De pictive sentence for 0:"Let's say I have some function f that is continuous on an interval between a and b."
- Ex planator y sentence between ®& 0: "Well, how do we denote the area under
the curve between two end points? Well, we just use our definite integral."
Figure 6: (top) Lectures convey concepts progressively. Here, the labels (i through 6) show the order in which concepts were presented. They also organize visuals into discrete entities (outlined in this visualization with bounding boxes). (bottom) Verbal explanations during lectures are either depictive or explanatory.
tity consists of strokes that are close together in either space or time. Moreover, since people are accustomed to parsing visual information line-by-line, from top to bottom, and left to right, visual entities are often laid out in the same manner. Building on this observation, our system segments drawings on the board into visual entities based on their spatial alignment and temporal proximity.
Audio content complements visuals.
In our analysis of lecture videos, we found that verbal explanations tend to serve one of two broad objectives. Explanations given while the instructor is not drawing are often explanatory, providing addi-tional information not directly represented in the visuals or mak-ing connections between drawmak-ings. On the other hand, explanations
given while the instructor is drawing are typically more depictive, re-peating or reading aloud the visual information (Figure 6, bottom). While depictive explanations can help viewers follow along with the video, they often result in long, repetitive transcript text that is cum-bersome to read or skim through. This problem is exacerbated by the fact that spoken explanations are usually colloquial.
Our interface automatically categorizes transcript text as either ex-planatory or depictive. In the default view, we hide depictive sen-tences and only show explanatory text interspersed with the set of visual entities extracted from the video. Large et al. [74] and Christel
and Warmak [29] have shown that such combinations of pictures and
captions aid recall and comprehension as well as navigation of video material. Our design gives the viewer relevant context for understand-ing the visual information without clutterunderstand-ing the output with redun-dant text. Users can click on a visual entity to see the corresponding depictive sentences.
2.4 THE VISUALTRANSCRIPT INTERFACE
Indefinite integrals of x raised to a power Khan Academy
Amd we -a .e goin i f I- ls-o d oegiM 1. erbease wed div ding wewanal by 0. thns Wn- Ae-A, ..presn-n 16Al be defined. c de d e'e . h a loorat . maua. doll .- .S" dos $,- ash e de n -Civ bferehn -adti s eygnrltrs s qa oat i .S gvnta.wa ste
amtiderivati-- 1. me -wirh -oe he- what is he :nidrdvtiv - of s to IhM .?
---
i
So ple or -AmplefeS so p l Ia. a. or the mAti-power rl.
What is IMhe in al-v If 11t the MW h Well. all we have to ay,,s. well. look. the 5 taequal 1, me I
- - 9
%m isalbal, 1-nraeesetteepotem by 1
Fundamental theorem of calculus
Khan Academy
And I Is- "-h se rackess bee..s it 1ls" imchaden a ad It in do, isturnal. So let mr graph this just so ins Bet
sof what rn talking about.
-A
4---NA urAlowermadpAii a, so that's ariAht overtheare.
Our upper boundary in b. We m make that I-ea
-/7
K. >
.tAroy-t lyh~ d[INAUDAtoLEIfft,*4..y If
And I.. Ce or.is a, I guess Mecold Call i0 dhs M4,ipower ruke. so this as going Wo be equal Wo 5 uime, X Wo
the regati . power plus I over the ngmtIr 2 P.we Plot I Plus terme Wosn right ome her".
And then if wn amt. we can distribute dhe 5.
Nowa e -ud-wiepla 5 turne -menb olthit isjus we arbitrary coatat. Se thi, is sillpj.ta
arbiM*raryonstalSom=yt wecCouild [LNAUD'BLE) this.
tf you watit .sdew 1h.t W d ife-I consuant. n u syia 1h. 1.L Yon nalopl, 5 nier, .yp.
We anrbhe -rumta.
5
And oneagain. all of these. try ea lure, The dertause. .and pan will we that you art tho, hum-u righl user
Well. howdo we denote the Alaunder the curve between two Cndpoine9 W41 wayjatAeourdefinitqaintrl
It'smm.mmea re ay tha nghtnew befort, saom, up with tend-ionthis video. it
rcAllyj..prN, wthrun lrthe b i s ighl erhA. Se-can soy i~da
ddia. intval from .A of f dl
So 1l far and Sued Upp-r Rx i s ation If you lgy v .. an x alu. lthn' between .A Itd .ill Wlyou
..e -n order Iow.-an ftt) benaaeen a and x Now the woal prt, the fundamenmul thorem of Calculus. The
food-ent] the- aC call .t.l -- let write this dow- bec- eh,, .h. big deal
d-A A WAdy .ly..A-l - AAiWA
Well, it sell. .s that for any aaoneao function f. if I deFine . functio. that ithe araunder the ours. benween .
and .nsh. over here hte dr n vod-u-o that funCo, tS gugtbe So le me ken d ce
No. Ce see it It. .C-1ecin to darilati e. Well how -ould you actaly -s the fundomenual theorem of
AcleA? Wdl. maybe in thAnt of a eadulus Clam And w'l do the intention for why this happens or why
this i read maybe A proof in later videme B.t how would you tacually apply this right over Isrm? Well, lee',
uay sm n told you that they want to ind the derisarive ,at me do dhis in A new wiworj-s to show thotoi ant
marmpl,
And notion. it doosn fnatar what the towar boundary of a wottaly in You dourt hIsm anything on the right hand
aide tha in in _." wy dependent on I. Anyway. hope you caljoyed that And in the next few videe., we'll think
w.A dAhotteitiin And d mo f dA S kigu th fudmna hormo acl
Figure 7: Examples of two VisualTranscript outputs from Khan Academy Videos.
(Top)'Indefinite integrals of x raised to a power' and (Bottom)'Fundamental theorem of
calculus. Users can click on a figure to expand step-by-step details. For example, the
Based on these observations, we designed VisualTranscript, a read-able and printread-able interface that presents both the visual and audio content of a lecture video. Since VisualTranscript contains all of the vi-sual and audio information from the original video, it can be used by itself to study the content. Alternatively, it can be linked to the origi-nal lecture video to function as an interactive navigation aid. Similar to Monserrat et al's interface [86], clicking on a visual entity or a tran-script sentence plays the original video at that point in time. As the video is playing the corresponding visual entity and transcript sen-tence are highlighted.
Figure 7 shows two examples of VisualTranscript created from Khan Academy videos. Please visit https : //people. csail .mit .edu/hishin/ p rojects/visualt ransc ripts/abst ract. html for the interactive ver-sion of these examples. Given an input video and its transcript, we generate VisualTranscript automatically using the algorithms described in the next section. To test the robustness of our method, we gener-ated VisualTranscripts of 20 lecture videos from 11 different instruc-tors. Please view the appendix for all the results. Here we highlight some of the key features of VisualTranscript.
2.4.0.1 Linear format highlights lecture progression.
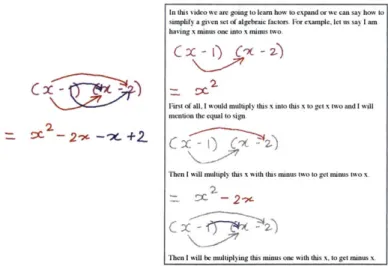
The layout of text and visual entities in VisualTranscript often empha-sizes the instructor's thought process and clarifies the intermediate steps that lead to a result. Figure 8 compares equations in the final view of the blackboard at the end of the lecture with a VisualTran-script output.
In this video we are going to learn how to expand or we can say how to simplify a given set of algebraic factors. For example, let us say I am having x minus one into x minus two.
First of all, I would multiply this x into this x to get x two and I will
mention the equal to sign.
Then I wilt multiply this x with this minus two to get minus two x.
Dr -~
-2-Then I will be multiplying this minus one with this x, to get minus x.
Figure 8: (Right) VisualTranscript shows the step-by-step progression of an equation which is not apparent in the (left) final view of the board.
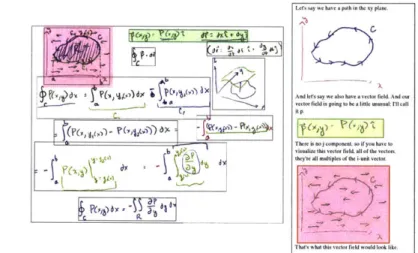
Les sy m we have a path in the xy plane.
lu sttry e a lso hef a vector field n l t
Tha whct.,i vc field on wod be a likte.
Fig re : ig t)Intrs ersngtex w th sa6 s herei s nohe compnntion baet wenh
Compare with the (left) final view of the original board.
Although both views show the same set of equations, in the black-board view (left) it is difficult to infer how the equations relate to and build upon each other. In contrast, the VisualTranscript output (right) shows a step-by-step progression of the visual content.
2.4.0.2 Interspersing text with visuals clarifies connections.
A purely visual summary of the video omits verbal explanations, whereas a purely textual summary (i.e., transcript) can be confus-ing without the correspondconfus-ing visuals. Instead, VisualTranscript inter-leaves explanatory text and visual entities. This makes it easy to see the connection between illustrations, or the context of an illustration. For instance, compare the final view of the blackboard (Figure 9 left) and the VisualTranscript for the same video (Figure 9 right). In the former, it is difficult to see the connection between the illustration (pink highlight) and the equation to its right (green highlight) with-out listening to the lecture. In the latter, the text in-between explains clearly that the equation represents the vector field depicted in the illustration.
2.4.0.3 Hierarchical organization show different levels of detail.
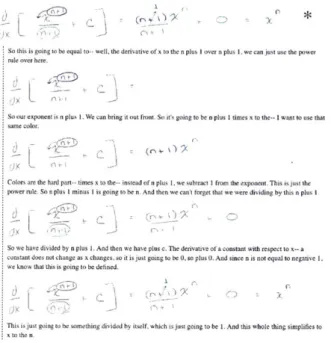
By default, VisualTranscript hides redundant depictive text that just describes the corresponding visuals. Users can click on a visual entity to reveal the corresponding hidden text and read the details. In the case of a long equation or a complicated illustration, the expanded view breaks up the visual and textual information into easy-to-read blocks (Figure to).
So this is going to be equal to-- well, the derivative of x to the n plus I over n plus 1. we can just use the power
rule over hero.
So our exponent is n plus 1. We can bring it out front. So it's going to be a plus I times x to the-- I want to use that
same color.
Colors are the hard part- times x to the-- instead of n plus 1. we subtract I from the exponent. This isjust the
power rule. So n plus I minus I is going to be n. And then we can't forget that we were dividing by this n plus 1.
So we have divided by a plus 1. And then we have plus c. ne derivative of a constant with respect to x-- a constant does not change as x changes, so it is just going to be 0, so plus 0. And since n is not equal to negative 1. we know that this is going to be defined.
Mis is just going to be something divided by itself, which is just going to be 1. And this whole thing simplihes to
x to the n.
Figure io: VisualTranscriptis organized hierarchically. The default view hides descriptive details to present a compact summary (Figure 7*). Users can click on a higher-level figure to expand its detailed description and step-by-step derivation.
2.5 ALGORITHMS
There are three main steps to create VisualTranscript. First, we seg-ment the visual content of a lecture into visual entities using a dy-namic programming approach (2-5.2). Then, we structure the tran-script content by computing temporal correspondences between vi-sual entities and transcript sentences (2.5-3). Finally, we generate a VisualTranscript by interleaving visual entities with transcript text (2.5-4). The rest of this section describes each of these steps in detail.
2.5.1 Pre-processing
First, we use a simple intensity threshold to separate the foreground (ink) and background (board) pixels. The visual content in blackboard-style lectures consists of strokes, the set of foreground pixels generated during one continuous drawing action. In the context of a graphics tablet, a stroke corresponds to the continuous path of a pen while maintaining contact with the writing surface. Since our input is a recorded video and we do not have the vector information of the strokes, instead we extract individual strokes from the video frames using a method similar to [86]. We detect the start and end time of each drawing action by comparing the number of foreground pixels in consecutive frames. A large increase marks the start of an action, while no change marks the end. The difference image between the
end and start frames gives an image of the stroke drawn during that period. The manual steps involved in this process are (1) identifying the cursor image, which is automatically removed from all frames, (2)
setting a threshold for foreground/background separation, and (3) setting a smoothing window to get rid of the noise in the foreground pixel count. Depending on the instructor's writing speed, a typical stroke comprises several characters to several words, or it can also be a part of an illustration or a graph (Figure 11).
~
(T= -rTa ft LeIleak SOiFigure ii: Examples of strokes (marked by black bounding boxes) extracted from video frames.
In addition to the visuals, lecture videos include an audio track with the instructor's spoken explanations. Several on-line video lec-ture platforms (e.g. Khan Academy, YouTube) provide transcripts of the audio. We assume such transcripts and we use an online audio transcription service (castingwo rds . com) if they are not available.
2.5.2 Segmenting Visual Content
One straightforward strategy for grouping strokes into visual entities is to process strokes in the order they are drawn and decide whether each stroke represents the start of a new visual entity or is part of an existing visual entity formed by previous strokes [88]. While this sim-ple, greedy approach works in some cases, there are many scenarios where it leads to poor segmentations. For example, in Figure 13, there is a large space between the first stroke ( @(x, (0) and the second stroke (dx, (j)). Without considering the semantics of these symbols, they appear to be separate equations. However, once we consider the subsequent set of red strokes(()) it becomes clear that this is not the best segmentation. In general, computing good stroke segmentations requires considering the global configuration of strokes in both space and time.
In this respect, the problem of segmenting strokes into visual enti-ties is analogous to the line-breaking problem, i.e., arranging the words of a paragraph into lines. In both cases, we want to segment a se-quence of elements (strokes or words) into an optimal set of groups
(0
D ,
0
--
C
Figure 13: Without considering the semantics of these symbols and before the last stroke ( d-y) is inserted, the firsttwo strokes (-
f'
and dx) appear like two separate equations with a large space between them.
(visual entities or lines) defined by some scoring function over can-didate entities or lines. An important difference is that in the tradi-tional line-breaking problem, only a contiguous set of words can be put on the same line. In our case, strokes in one visual entity can be interspersed by strokes in a different visual entity. For example, the instructor may go back and forth between two lines of equations, or between a graph and an equation (Figure 14).
2 4C6 8,
) _%40
e -- +
Figure 14: The instructor goes back and forth between writing two lines, e 1 and e2.
The order of strokes 1-9 is as indicated.
Given these observations, we propose a heuristic inspired by the dynamic programming approach based on the classic optimal line-breaking algorithm [70]. Unlike the classic approach, our algorithm
handles non-contiguous grouping of elements. Here, we describe the high-level structure of the algorithm, and in the next section we define the scoring function in detail.
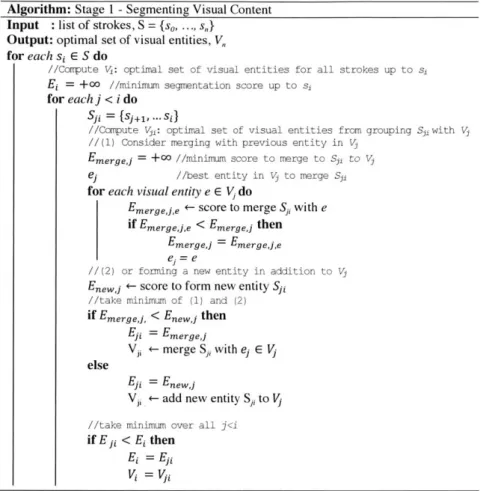
2.5.2.1 Algorithm Overview
Figure 15 gives a detailed pseudo-code of our segmentation
algo-rithm.
Given a sequence of n strokes S = {so,..., s_ I} ordered by when they appear in the video, we find the optimal set of inter-stroke boundaries that segment the strokes into visual entities. We refer to the boundary between si and s + I as b1. Our algorithm processes the strokes in order and for each si computes and records the optimal set of visual entities Vj formed by all strokes up to bi, along with the total score E (Vj) of this partial solution. To determine the optimal partial solution for stroke si, we consider each previous boundary bj where j<i, and evaluate two possible ways of grouping the set of strokes Sj, = {sj+,,...,s1}: 1) merging Sj, with one of the existing
entities in Vj, or 2) forming a new entity with Sjj. Allowing Sjj to be merged with existing entities enables our algorithm to support non-contiguous stroke groupings. We take the better (lower) of the two scores for Sj, and add it to E(Vj) to obtain the total score for the proposed segmentation. After considering all candidate boundaries
Algorithm: Stage 1 -Segmenting Visual Content Input : list of strokes, S = {so, ... , s,}
Output: optimal set of visual entities, V, for each si E S do
//Compute VX: optimal set of visual entities for all strokes up to si
Ej = +oo //minimum segmentation score up to si for each j < i do
Sii = {Sj+, ... si}
//Compute V1: optimal set of visual entities from grouping Sj with V
//(l) Consider merging with previous entity in Vj
Emergej = +0 //minimum score to merge to Sj1 to V
e //best entity in Vj to merge Sj
for each visual entity e E V, do
Emerge,,e +- score to merge Sj, with e if Emergeje < Emergej then
Emergej = Emergeje
ej= e
//(2) or fonning a new entity in addition to V
Enewj -score to form new entity Sji //take minimum of (1) and (2)
if Emergej, < Enew,j then
Ei =Emergej
V -merge Sji with ej E V else
Eji =Enewj
Vi1 4- add new entity S, to V I/take minimum over all j<i if Eji < Ei then
Ei = Eji
Vi = V i
Figure 15: We use a variation of dynamic programming to segment strokes into an optimal set of visual entities. For each stroke, si, the algorithm considers all previous partial solutions, V <j and Sj,1 = {sj +,. si}. For each Vj, it considers
two possibilities: merging Sjj with an existing entity or forming a new entity.
score and record the corresponding set of entities as Vi and the score as E(Vj). Once the algorithm iterates through all strokes, V_,I gives
the optimal set of visual entities for the entire lecture.
Note that unlike the classic line-breaking algorithm, our problem does not have a optimal substructure property. We merely use over-lapping subproblems to approximate the solution. Our algorithm does not guarantee an optimal solution, but in practice we found the seg-mentation outputs to be reasonably effective across different videos.
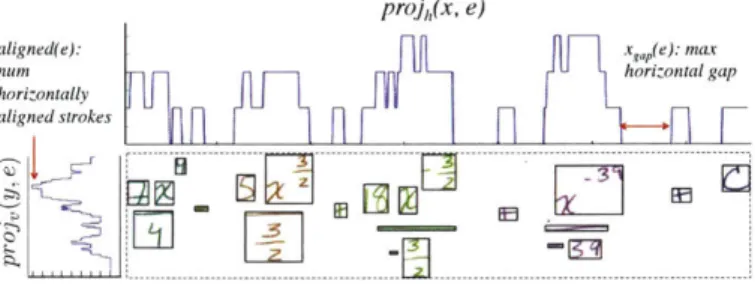
2-5.2.2 Scoring Function
The heuristic algorithm described above requires a scoring function that evaluates the goodness of candidate visual entities formed by sets of strokes. We define this scoring function based on several ob-servations: Strokes within a visual entity are (:) compactly arranged