Development of an Intracoronary Raman Spectroscopy
System
by
Alexandra H. Chau
S.B., Massachusetts Institute of Technology (2002)
S.M., Massachusetts Institute of Technology (2004)
Submitted to the Department of Mechanical Engineering
in partial fulfillment of the requirements for the degree of
Doctor of Philosophy in Mechanical Engineering
at the
MASSACHUSETTS INSTITUTE OF TECHNOLOGY
June 2009
@
Massachusetts Institute of Technology 2009. All rights reserved.
- g A
Author ...
Department of Mechanical Engineering
May 18, 2009
N A A A.Certified by...
Certified by...
. .. . . . . .. . . .. . . . . . . . .. . . .. . . . . . . .. . .Guillermo J. Tearney
Associate Professor of Pat
gy, Harvard Medical School
S
/
Thesis Supervisor
Peter T. So
Professor of Mechanical and Biological Engineering
Thesis Supervisor
le)
Accepted by ...
David E. Hardt
Chairman, Committee on Graduate Students
ARCHES
MASSACHUSETTS INSTITTE OF TECHNOLOGYJUN
16 2009
LIBRARIES
~PDevelopment of an Intracoronary Raman Spectroscopy System
by
Alexandra H. Chau
Submitted to the Department of Mechanical Engineering on May 18, 2009, in partial fulfillment of the
requirements for the degree of
Doctor of Philosophy in Mechanical Engineering
Abstract
Atherosclerosis is a leading cause of death in the United States, with 1 in 5 deaths (500,000 annually) attributable to coronary artery disease alone. While the disease processes are not completely understood, it is believed that patient risk depends on a variety of factors including lesion structure, biomechanical behavior, and morphological and chemical compo-sition. Raman spectroscopy, based on spectral analysis of inelastically scattered photons, is a nondestructive technique that yields detailed information about the chemical composition of the sample being interrogated. Intracoronary Raman spectroscopy can be performed via the use of a flexible, small diameter (< 2 mm) optical fiber probe to guide light to and from the arterial wall in situ. The fact that Raman scattering has inherently low signal intensity, combined with the need for a small diameter probe, makes it difficult to develop a probe with sufficient signal-to-noise for robust plaque diagnosis. This thesis addresses two approaches for increasing SNR: increasing Raman signal intensity and optimizing probe design.
While most biological applications of Raman spectroscopy have been performed in the "fingerprint" region (Raman shifts between 400 and 1800 cm-1), the high wavenumber re-gion (2700 - 3100 cm- 1) offers distinct technical advantages, including increased Raman signal relative to the fluorescent background and potentially less fiber background. How-ever, the high wavenumber region may yield different molecular information and thus have different diagnostic capability. In this thesis, we develop a benchtop Raman system capable of acquiring Raman spectra in both wavenumber regions. In contrast to previous work, which focused on plaque characterization based on the Raman spectrum from a single site within the plaque, our system utilizes a line imaging paradigm, in which we acquire Raman spectra at fixed intervals across the full cross-section of the plaque, creating a Raman line image. We use this benchtop system to acquire a database of Raman line images and cor-responding histology for over sixty plaque specimens. Using this database, we compare the diagnostic capability of fingerprint and high wavenumber Raman spectroscopy for plaque characterization.
Because of the small size requirement for an intracoronary probe, it is important to optimize the optical probe design to maximize collection efficiency and thus increase SNR. We develop and experimentally validate a simulation technique for modeling Raman probe performance (collection efficiency and sampling volume), as an aid to optimizing probe design. We also fabricate a 1.5 mm diameter probe and demonstrate it in vivo, using a human-swine xenograft model, in which diseased human coronary arteries are grafted onto a living swine heart. The results of this thesis provide insight on two approaches toward achieving a clinically viable intracoronary Raman spectroscopy system.
Thesis Supervisor: Guillermo J. Tearney
Title: Associate Professor of Pathology, Harvard Medical School
Thesis Supervisor: Peter T. So
Acknowledgments
The road to completing a PhD is generally long and fraught with challenges, but I am grateful that my road has not been solitary. I am indebted to my advisors Prof. Guillermo
J. Tearney and Prof. Brett E. Bouma for providing excellent guidance and for always pushing me to exceed my expectations. I am lucky to have stumbled into their lab at the Wellman Center for Photomedicine as an undergraduate so many years ago. Prof. Tearney
and Prof. Bouma have created an environment that is impressive for both the quality of the research and the quality of the researchers. In this nurturing environment, overflowing with both hard work and heart, I feel I have grown from a naive undergraduate to a competent
researcher.
The work presented in this thesis forms a subset of a larger Raman program, overseen by Dr. Joseph Gardecki, and in the early years, Dr. Jason Motz, both of whom gave me
daily mentorship and friendship for years. I am especially grateful to Joe for always making himself available to help with anything, big or small, and for our long discussions filled with advice on research and advice on life.
I could not have completed this thesis without technical contributions from additional colleagues, and I thank Bill Farinelli, Prof. Seemantini Nadkarni, and Dr. Milen Shishkov, who have provided relatively small (to them) but key (to me) contributions to my thesis research project, in moments of crisis.
Within the lab, I have found that I can learn something from everybody, and I thank Dr. Alberto Bilenca, Dr. Nicusor Iftimia, Priyanka Jillella, Dr. DongKyun Kang, Dr. Linbo Liu, Dr. Hyle Park, Dr. Leilei Peng, Dr. Wang-Yuhl Oh, Dr. Melissa Suter, Prof.
Ben Vakoc, and Dr. Hongki Yoo, for enlightening me in technical discussions, for being my friends, and for making me laugh. I also thank my SM thesis mentor, Dr. Raymond Chan, from whom I learned a lot of about research, life, and MATLAB. In addition, I am grateful
to my fellow graduate students in the lab, Brian Goldberg and Dr. Caroline Boudoux, for their commiseration on the challenges of being a graduate student off-campus.
I also thank my thesis committee members Prof. Peter T.C. So and Prof. Forbes Dewey for their support and research advice.
I believe that teaching is an important part of the graduate student experience, and I am grateful to Prof. George C. Verghese and Prof. Franz X. Kaertner for giving me
the opportunity to see what classes are like from the other side, as a grader and a teaching
assistant. I especially thank Prof. Kaertner for giving me the opportunity to teach tutorials as a teaching assistant for Fundamentals of Photonics, and for his supportive feedback to help improve my teaching skills.
Finally, I thank my family and friends. I am eternally grateful for the love and support of my parents, Peter C. Chau and Kim Q. Chau, who have always put my education first, and who have always strived to instill in me the confidence and the work ethic needed to succeed. In their continual study of their personal hobbies, they provide daily examples of
how nothing comes easy without careful study, practice and attention to detail, not even whitewater kayaking or painting. In addition, my brother, Phu H. Chau has motivated me throughout my education. I give thanks to Dr. Jennifer J. Yu, who has been one of my
best friends since we started at MIT together as freshmen back in 1998 and with whom I have shared a lot of laughter and (not so many) tears.
My graduate years at MIT have been more enjoyable and more memorable for being shared with my fiance, Dr. Baris I. Erkmen. He has helped me grow professionally through
technical discussions about our research, and personally, with his unflagging confidence in me and his continual encouragement and support. I am grateful to him for all the giggles and the sense of calm that he brings, and I thank him for sharing my life.
This work has been supported by an NIH Kirschstein NRSA Predoctoral Fellowship
(1F31EB007169), an NIH Research Project Grant (NIH R01HL093717), and Prescient Med-ical, Inc.
Contents
1 Introduction 1.1 Atherosclerosis ... 1.1.1 Pathogenesis ... 1.1.2 Stages of atherosclerosis ... 1.1.3 Plaque stability ...1.1.4 Diagnostic modalities for atherosclerosis . ... 1.2 Raman spectroscopy ...
1.2.1 Biomedical Raman spectroscopy . ... 1.2.2 Raman for atherosclerosis . ... 1.2.3 Catheter-based Raman spectroscopy for atherosclerosis 1.3 Toward an intracoronary Raman system . ...
2 Ex Vivo Raman Database
2.1 Data acquisition ... 2.1.1 Experimental setup . ...
2.1.2 Spectral and histological data acquisition 2.1.3 Histological processing ...
2.2 Data processing . ... 2.2.1 Spectral processing . ... 2.2.2 Spectra-histology registration ... 2.3 Verification and validation . ... 2.4 Pathological diagnosis . ... 2.5 Creation of the ex vivo Raman database ... 2.6 Visualization . ...
2.7 Conclusions ...
3 Ex Vivo Lesion Characterization 3.1 Spectral modeling ...
3.1.1 Physical basis spectra model ... 3.1.2 Spectral decomposition ... 3.1.3 Discussion . ...
3.2 Plaque characterization based on single site spectra 3.2.1 Histo-pathological classification ...
3.2.2 Fingerprint Raman classification ... 3.2.3 High wavenumber Raman classification 3.2.4 Discussion . ...
3.3 Raman-histology spatial correlations ... 3.3.1 Discussion . ... 3.4 Discussion . ... 3.5 Conclusions . ...
4 Raman Probe
4.1 Design and fabrication ... 4.1.1 Fiber bundle ... 4.1.2 Optical filter ... 4.1.3 Probe assembly ...
4.1.4 Coupling to the Raman system . . . . 4.1.5 Benchmarks . . ...
4.2 Raman probe performance with distance . . . . 4.3 Discussion . . . ...
4.4 Conclusion . . ...
5 Raman Catheter in a Xenograft Model
5.1 Raman catheter . . ... 5.2 Xenograft procedure . ...
5.2.1 The xenograft model . ... 5.2.2 Data acquisition ... 89 89 89 90 92 93 93 96 100 101 103 103 104 104 107 : : : I I :
5.3 5.4 5.5 Results ... ... ... Discussion ... Conclusions ...
6 Optical Modeling for Catheter Design
6.1 Monte Carlo Modeling . . . . ...
6.1.1 Standard Monte Carlo Model .. ... ... 6.1.2 Incorporating Raman scattering into the Monte Carlo model . 6.1.3 Convolution model for efficient Raman Monte Carlo simulations 6.2 Simulating Sampling Volume . . . . .
6.2.1 Implementation ...
6.2.2 Monte Carlo for Multi-Layered 6.2.3 Zemax ... 6.2.4 MATLAB... 6.3 Validation ... 6.3.1 Experimental setup ... 6.3.2 Experimental procedure . ... 6.3.3 Simulation procedure . . . . . 6.3.4 Zemax model . ... 6.4 Results ... ... 6.4.1 Simulation results . . . . 6.4.2 Experimental results ... 6.5 6.6 . . . . . . . . . . media (MCML) . . . . . . . . . . . . . . . . . . . . . S . . . . . . .. . . . . . . . . . . .
6.4.3 Comparison between simulation and experiment Discussion ... Conclusion . . . ... . . . . . . 121 . . . . . . 122 . . . . . 124 . . . . . . 125 . . . ... 125 . . . . .. . 125 . . . . . 126 . . . . . . 129 . . . . . . 131 . . . . . . 132 . . . ... 136 . . . . . . 136 . . . . . 137 . . . . . 148 . . . ... 148 . . . . . 151
7 Conclusions and Future Directions A Photoresponse Non-Uniformity 153 159 108 109 110 113 114 114 118 120
List of Figures
1-1 Cellular processes in the development of atherosclerosis . ... 18
1-2 Stages of atherosclerosis ... ... . 21
1-3 Raman system schematic ... ... 26
1-4 Optical filtering of the Raman probe ... ... 27
1-5 Catheter-based Raman schematic ... ... 31
2-1 Creating the ex vivo Raman database ... .. 38
2-2 Benchtop Raman line imaging system ... .. 39
2-3 Temperature-controlled specimen mount . ... . 41
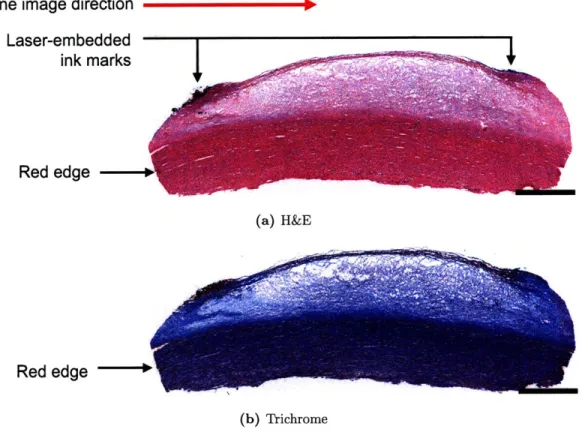
2-4 Registration marks in gross pathology ... .. 44
2-5 Registration marks in histology ... ... ... 45
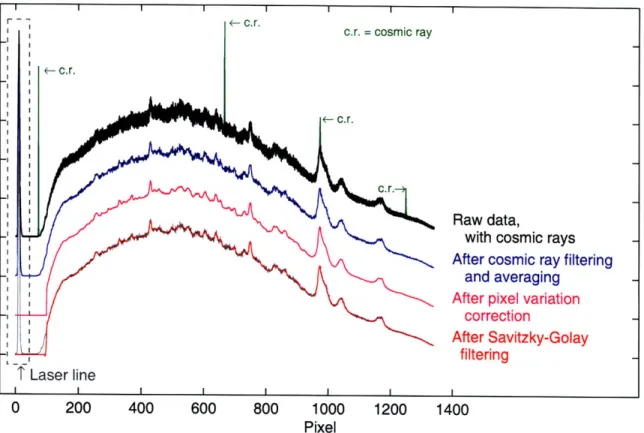
2-6 Raman spectra preprocessing ... ... 46
2-7 Wavenumber calibration ... ... . 48
2-8 Background signals from ex vivo tissue ... .. 50
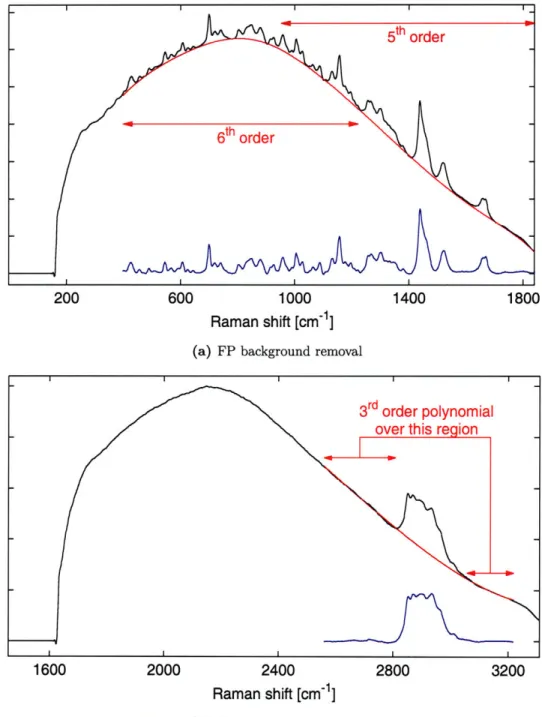
2-9 Background removal ... ... 51
2-10 Spectra-histology registration ... ... ... 52
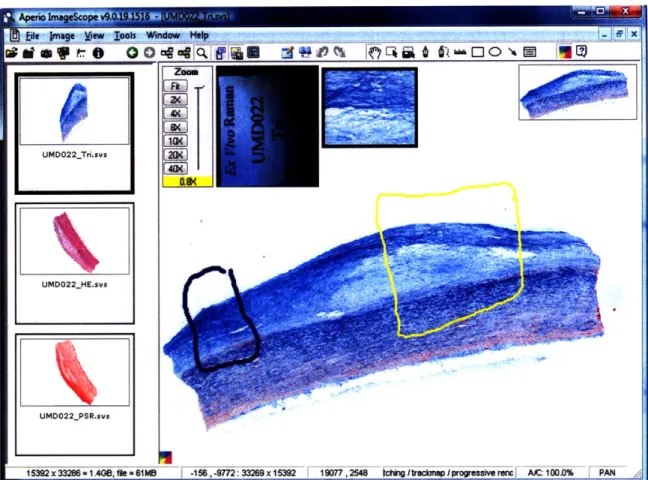
2-11 Histology annotations in ImageScope software . ... 55
2-12 Graphical User Interface for viewing database specimens . ... 57
3-1 Chemical basis spectra ... . . ... . 62
3-2 Basis spectra fit to fibrous plaque spectrum (UMD016) . ... 68
3-3 Basis spectra fit to calcified spectrum (UMD045) . ... 69
3-4 Basis spectra fit to necrotic core spectrum (UMD087) . ... 70
3-5 Normalized fit coefficient profiles for a heterogeneous lesion (UMD016) . . . 73
3-7 FP single site diagnostic for lipid-rich plaques . ... 3-8 HW single site diagnostic for lipid-rich plaques . ...
3-9 Normalized fit coefficient profiles for a PIT lesion (UMD016) . . . . . 3-10 Normalized fit coefficient profiles for a calcified lesion (UMD045) . . . 3-11 Normalized fit coefficient profiles for a necrotic core lesion
3-12 Normalized fit coefficient profiles for a PIT (UMD089) . .
(UMD087)
Patterned filter for the Raman probe . . . . Prototype Raman probe . ...
Coupling the Raman probe to the spectrometer Raman probe background signal . . . .. Raman probe acetaminophen spectra . . . . An improperly filtered Raman probe . . . . Raman probe performance through saline . . . Raman probe performance through blood . . .
First generation Raman catheter . . . .. Raman catheter background . . . .... Raman catheter in xenograft model in vivo . .
... . . . . . 9 1 ... . . . . . 92 . . . . 94 ... . . . . . 9 5 ... . . . . . 96 .. . . . . 97 .. . . . . . . 98 .. . . . . . 99 ... . 105 ... . 106 ... ... . 108 4-1 4-2 4-3 4-4 4-5 4-6 4-7 4-8 5-1 5-2 5-3 6-1 6-2 6-3 6-4 6-5 6-6 6-7 6-8 6-9 6-10 6-11 6-12 6-13 S. . 76 S. . 77 S. . 79 S. . 80 . . . 81 . . . 84
Block diagram of the basic Monte Carlo simulation method ... . 115
Monte Carlo simulation geometry ... ... 116
Combined Monte Carlo/Zemax optical modeling . ... 123
Raman spectrum of single crystal diamond . ... 126
Sampling volume experiment schematic ... . 127
Diamond chip mounted on a hypodermic needle . ... 130
Data processing for diamond sampling volume experiments . ... 132
Zemax probe geometry for sampling volume experiments . ... 132
Mie and Henyey-Greenstein phase function .. ... 134
Simulated sampling volume for /, = 200 cm-1 (Henyey-Greenstein) . . 138
Simulated sampling volume for ps = 100 cm-1 (Henyey-Greenstein) . . . . 139
Simulated sampling volume for ps = 200 cm- 1 (Mie) . ... 140
6-14 Experimental sampling volume for ps = 200 cm- 1 . . . 142
6-15 Experimental sampling volume for Ps = 100 cm- 1 . . . 143
6-16 Comparison of experimental and simulated sampling volumes for As = 200 cm- 1 (Henyey-Greenstein) ... ... 144
6-17 Comparison of experimental and simulated sampling volumes for Ps = 100 cm- 1 (Henyey-Greenstein) ... ... 145
6-18 Comparison of experimental and simulated sampling volumes for ps = 200 cm- 1 (Mie) ... ... . ... 146
6-19 Comparison of experimental and simulated sampling volumes for s, = 100 cm- 1 (Mie) ... ... 147
6-20 Comparison of experimental and simulated sampling volumes (Mie, renor-malized) ... ... 149
A-1 White light spectra with varying spectral features . ... 160
A-2 Estimating So(w) ... ... 162
A-3 i) for the ex vivo database data ... ... 163
A-4 Example of PRNU correction on database data (UMD019) . ... 164
A-5 Example of PRNU correction on database data (UMD020) . ... 164
List of Tables
1.1 Summary of published Raman diagnostic studies . ... 29
1.2 Summary of published Raman probes for atherosclerosis . ... 33
2.1 Histological classification scheme ... .. . . 54
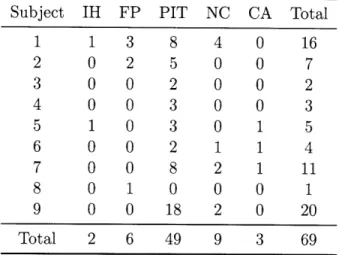
2.2 Ex vivo Raman database disease distribution . ... 56
3.1 Basis spectra orthogonality ... ... 65
6.1 Optical properties used for sampling volume experiments . ... 128
Chapter 1
Introduction
Over 16 million Americans are afflicted with coronary heart disease (CHD), and approxi-mately one of every five deaths in the United States is caused by CHD, or -500,000 deaths
annually [1]. In the United States, the total economic burden of CHD is -$165 billion per
year in direct and indirect costs. Atherosclerosis is a complex disease, characterized by the development of atheromatous plaques within the arterial wall. When a plaque is dis-rupted, thrombogenic factors in the atheroma come into contact with the blood, initiating the clotting cascade. The resulting thrombus can occlude flow, cause ischemia, and may ultimately result in myocardial infarction and stroke [2]. The mechanism behind plaque progression and disruption and how it relates to patient risk is not well understood, but le-sion structure, molecular and chemical composition, biomechanical behavior, and functional state are believed to be important. There is a growing need for diagnostic technologies that can study these factors, including their clinical significance and temporal evolution, to gain understanding of the disease processes and to assess treatment efficacy.
1.1
Atherosclerosis
The normal human coronary artery is composed of three layers, the intima, media, and adventitia (Figures 1-1 and 1-2). Endothelial cells line the lumenal surface of the intima, where they regulate the passage of molecules between the blood and the arterial wall. The intima is a thin layer of connective tissue, primarily collagen and elastin, with a small number of smooth muscle cells. A layer of elastic tissue, the internal elastic lamina, serves as a barrier between the intima and the media. The media contains tightly packed layers
Process Endothelial Endothelial Matrix
dysfunction activation Inflammation proteolysis Apoptosis Thrombosis
Internal elastic lamina
A Apoptotic cell /(*) Collagen fibril 0 Endothelial cell % Fibrin Macrophage 0 Platelet
&
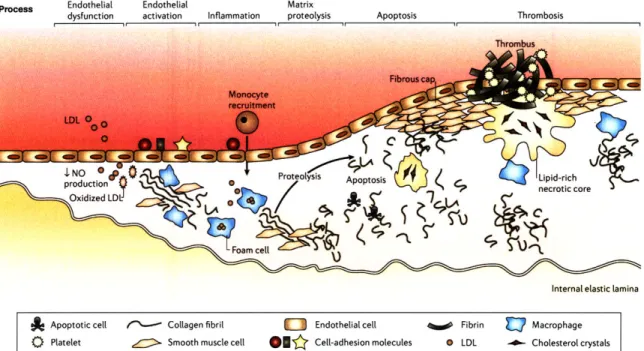
Smooth muscle cell Oflj Cell-adhesion molecules 0 LDL - Cholesterol crystalsFigure 1-1: Cellular processes in the development of an atherosclerotic lesion. Reprinted by permission from Macmillan Publishers Ltd: Nature Reviews Genetics [5],
©
2006.of smooth muscle cells, embedded in a matrix of elastin and collagen. The outermost layer is the adventitia, consisting of mostly collagen [3].
1.1.1 Pathogenesis
Atherosclerosis is characterized by an accumulation of lipid and fibrous tissue in the arterial wall. The cellular processes involved in the development of an atherosclerotic lesion are illustrated in Figure 1-1. Normal endothelium is resistant to adhesion by leukocytes, but triggered by risk factors such as smoking, poor diet, hypertension, hyperglycemia, and obesity, endothelial dysfunction may occur, in which endothelial cells allow low density lipoprotein to enter into the intima. This in turn stimulates cell-adhesion molecules, which recruit monocytes to adhere to the endothelial wall and migrate into the intima [3-5].
Inside the intima, monocytes mature into macrophages and begin to engulf modified lipoproteins. Lipid droplets, primarily cholesterol esters, accumulate in the cytoplasm, and the lipid-laden macrophage is then termed a "foam cell", due to its foamy appearance when viewed under a microscope [3,4]. This type of lesion is called a fatty streak, and is characterized by the presence of macrophage foam cells, lipid droplets in the smooth muscle cells, and T lymphocytes [4, 6].
Macrophages in the fatty streak release growth factors that stimulate migration and proliferation of smooth muscle cells into the lesion. As these smooth muscle cells accumu-late in the plaque, they synthesize extracellular matrix, leading to the development of a fibrous cap [7]. At this point, lesion progression is largely regulated by inflammatory pro-cesses. Inflammatory cytokines can induce macrophages to undergo apoptosis, creating the cellular debris that forms part of the necrotic core characteristic of more advanced lesions. Mediated by the inflammation response, lipid infiltration and macrophage accumulation continue, contributing to the soft lipid in the necrotic core. These macrophages express proteolytic enzymes that break down the fibrous cap. This process can ultimately lead to the development of a lesion consisting of a lipid-rich necrotic core covered by a thin fibrous cap [2].
Alternatively, clinical observations have shown that atherosclerotic lesions develop dis-continuously [8]. It is thought physical disruption of a plaque and the resulting thrombosis leads to a sudden expansion of the lesion. Three mechanisms for plaque disruption have been identified: superficial erosion of endothelial cells, microhemorrhaging within the plaque, and fracture of the plaque cap [9].
Superficial erosion is characterized by microscopic areas that lack functional endothe-lium. This exposes subendothelial collagen and von Willebrand factor, and ultimately leads to thrombus formation. Superficial erosion occurs commonly and is usually asymptotic [3]. Disruption of microvessels in the atheromatous lesion may also contribute to plaque progression. Lesions may develop microvascular channels as a result of neoangiogenesis. These microvessels are fragile and prone to microhemorrhage, which leads to thrombosis in
situ. This, in turn, leads to thrombin generation, which can stimulate smooth muscle cell
migration and proliferation. Additionally, activated platelets release growth factors that stimulate more collagen synthesis by smooth muscle cells, potentially leading to a growth spurt of the plaque [3].
The most common mechanism for plaque disruption is fracture of the fibrous cap. Ac-tivated macrophages within the lesion can produce proteolytic enzymes that degrade the collagen in the fibrous cap, which then weakens and becomes susceptible to rupture. Fis-sure of the cap allows thrombogenic materials in the lipid core to come into contact with coagulation factors in the blood, resulting in thrombus formation [4].
1.1.2
Stages of atherosclerosis
Once the initial atherosclerotic lesion has developed, it can progress discontinuously to several different stages (Figure 1-2). In an early atheroma, the intima is thickened by a lipid core covered by a fibrous cap. Often in these lesions, the vessel has expanded outward to maintain a relatively constant diameter lumen. Through a combination of the processes described in Section 1.1.1, this lesion can become a 'stabilized' plaque, with a small lipid pool and a thick fibrous cap. Alternatively, the early atheroma can progress to a 'vulnerable' plaque, characterized by a large lipid core, a thin fibrous cap, and inflammatory cells [3,5]. Rupture of the vulnerable plaque may lead to thrombosis and subsequent healing, creating a thickened fibrous intima with a narrow lumen. Rupture may alternatively lead to occlusive thrombosis, resulting in myocardial infarction.
1.1.3
Plaque stability
Our understanding of human coronary artery disease is in part derived from autopsy studies of coronary plaques from patients who have died of heart attacks [10]. These studies have reported evidence suggesting correlations between a plaque's histologic features and the presence of thrombosis. Tissue sections obtained at culprit coronary thrombi show three types of lesions: 1) the thin-capped fibroatheroma (TCFA), comprising a macrophage-rich, thin fibrous cap overlying a core of necrotic debris [11,12], 2) the endothelial erosion [10,13, 14], which may be more common in younger patients, lacks functional endothelium, and may contain higher concentrations of certain proteoglycans [15], and 3) the superficial calcific nodule [10]. The distribution of the different types of plaques implicated in myocardial infarction ranges from approximately 55-60% for TCFAs, 30-35% for erosions, and 3-7% for calcific nodules [10].
Due to its relatively high prevalence, we focus on the TCFA, the most common of these vulnerable plaques [16]. TCFAs exhibit a thin fibrous cap (< 65 - 150 tm) that contains smooth muscle cells in a collagenous-proteoglycan matrix, infiltrated by macrophages and lymphocytes. The fibrous cap overlies a lipid-rich core, comprised of large amounts of extracellular lipid, cholesterol crystals, and necrotic debris. It is hypothesized that thin, mechanically unstable fibrous caps may rupture when exposed to biomechanical stress, exposing the large lipid-rich core to blood. Conversely, stable plaques exhibit thicker, more
Normal artery Endothelium Intima Media Adventitia Smooth muscle cells Fibrous cap Early atheroma 'Stabilized' plaque J 'Vulnerable' plaque * Thin fibrous cap * Large lipid pool
* Many inflammatory cells
Plaque rupture and thrombosis Healed ruptured plaque; progressive vessel stenosis and angina
Right coronary artery
Figure 1-2: Stages of atherosclerosis. Reprinted by permission from Macmillan Publishers Ltd: Nature Reviews Genetics [5],
@
2006.robust fibrous caps and a high density of collagen and smooth muscle cells [11].
Although these autopsy studies have been valuable for determining histopathologic plaque types associated with coronary thrombosis, it is not well understood which plaques cause coronary events, why these plaques cause events, or when. For instance, TCFAs are a frequent autopsy finding in aysmptomatic or stable patients and are found with equal frequency in culprit and non-culprit arteries in acute coronary syndromes [17]. Moreover, disrupted TCFAs have been found in 10% of non-cardiac deaths [17]. Recent findings of mul-tiple ruptured plaques [18] and increased systemic inflammation in acute patients [19] has challenged the notion of a single plaque type as the precursor for acute myocardial infarction (AMI) [20,21]. The role of erosions is also somewhat controversial, with some believing that reports on the relatively high prevalence of erosive plaques is a result of study population bias, and differing opinions on the inflammatory nature of these lesions [13, 15, 22].
While vulnerable plaque remains an important hypothesis for explaining the pathogen-esis of acute coronary thrombosis, it is clear that there is much we still do not understand. For instance, in a single patient, many nonfatal plaque ruptures can occur without caus-ing death or even symptoms [17]. Additionally, in one study of patients who experienced sudden coronary death, only 60% had lesions with plaque rupture; the remaining 40% showed superficial erosion [13]. High levels of C-reactive protein found in patients with acute coronary events suggest that systemic and multi-focal arterial inflammation may be as important as focal, vulnerable plaque features [23]. A body of evidence is growing to suggest that plaque risk is multifactorial [21]. Lesion microstructure, molecular and chemi-cal composition, biomechanichemi-cal properties, and functional state are now all considered to be important [2,3, 7, 9, 24, 25]. Unfortunately, these factors have been difficult to prospectively study due to a lack of appropriate technologies for investigating them in patients. The development of diagnostic technologies for studying these factors, including their clinical significance and temporal evolution, is therefore merited.
1.1.4 Diagnostic modalities for atherosclerosis
Many technologies have been developed for examining atherosclerotic lesions [26,27]. While non-invasive imaging methods, such as computed tomography (CT) [28-30] and magnetic resonance imaging (MRI) [31,32] are continually improving, their resolution and capability to determine plaque composition is limited. Angiography, the current gold standard in
clinical care, can measure lumen diameter, area, and flow resistance, but is insensitive to changes in plaque burden that are masked by arterial remodeling [26]. Angioscopy, which uses a white light endoscope to view the surface of the artery, enables detection of plaque surface features such as color, but is unable to give any information about plaque composition [33]. Cardiac magnetic resonance (CMR) non-invasively measures plaque area and volume but has limited spatial resolution [26, 27]. Intravascular ultrasound (IVUS) allows structural interrogation of the arterial wall at a resolution of about 100 jIm [26, 27]. Elastography is an image processing technique based on IVUS that provides a map of the mechanical strain behavior of a lesion [34]. Electron beam computed tomography (EBCT) measures calcium content [27]. Thermography measures temperature variations at the surface of the arterial wall, under the hypothesis that heat from inflammatory cells increases temperature locally at areas of vulnerable plaques [35]. Intravascular ultrasound (IVUS) [36-39] and its more recent incarnation, Virtual Histology [40], can identify the presence of calcium. However, their capability to reliably identify lipid pools is currently under debate. Molecular contrast agents for MRI [41-44] and IVUS [45,46] are on the horizon, but progress towards clinical studies with these techniques is encumbered by the lengthy approval process associated with new exogenous diagnostic agents.
Optical coherence tomography (OCT) is conceptually similar to IVUS, but it utilizes infrared light, which enables higher resolution images (-10 jtm) of the arterial wall [47]. Extensive ex vivo validation studies have shown that OCT can be used to determine the presence of fibrous, lipid-rich, and calcified plaques [47-49]. OCT's strength is that it can obtain microscopic images of the arterial wall, which provides the opportunity to visualize structural features thought to be associated with high-risk plaques, such as macrophages, thin fibrous caps, and lipid pools [47, 49-52]. While OCT is excellent for characterizing plaque structure, it does not offer much direct compositional information.
The capability of investigating coronary plaques on the chemical and molecular level is needed to gain a deeper understand of CHD. Spectroscopic techniques are attractive because they have the ability to identify specific chemicals in vivo via optical fiber probes. Molec-ular imaging using fluorescent labels is a very promising technique [42, 53, 54] but faces the challenge of obtaining regulatory approval for new optical contrast agents. Autofluorescence spectroscopy and time-resolved lifetime fluorescence spectroscopy are sensitive to the pres-ence of naturally occurring fluorophores in the artery, such as elastin, collagen, NADH, and
ceroid, but are limited by the small number of fluorophores in the artery and strong absorp-tion in blood, which distorts the fluorescence spectrum [55-60]. Reflectance spectroscopy is sensitive to chromophores in the arterial wall, such as hemoglobin and p-carotene [61], providing the basis for "yellow plaques" seen during angioscopy [62-64]. Vibrational spec-troscopy techniques provide a means of probing the detailed energy levels of molecules in the arterial wall. One such technique, near-infrared (NIR) spectroscopy analyzes absorption to determine the chemical composition of the artery. Near infrared absorption spectroscopy (NIR) has been demonstrated in vivo, but the broad nature of its spectroscopic features currently limits its detection to lipid-containing regions within the intima [65].
Raman spectroscopy is based on spectral analysis of inelastically scattered photons [66]. Raman spectroscopy has several advantages over NIR absorption spectroscopy. Raman spectra contain very sharp, distinct peaks compared to the broad peaks characteristic of NIR spectra. As explained above, evidence suggests that important factors for studying atherosclerosis are the presence of a fibrous cap (collagen, macrophages, lymphocytes), necrotic core (extracellular lipid, cholesterol crystals, necrotic debris), smooth muscle cells, and calcifications. It has been demonstrated that Raman spectroscopy is highly sensitive to detecting the majority of these components [67-70]. Raman spectroscopy may be an ideal tool for improving our understanding of coronary atherosclerosis, as it may provide more information about different plaque constituents than any other diagnostic modalities proposed to date.
1.2
Raman spectroscopy
When a photon interacts with a molecule it may either be absorbed, elastically scattered, or inelastically scattered. Raman scattering is inelastic; the incident photon transfers energy to the molecule, raising the molecule from its ground state to an intermediate virtual level. As the molecule relaxes to a vibrational level with higher energy than the ground state, a photon is emitted with less energy than the incident photon. This energy difference is called the Raman shift, and it is traditionally expressed in units of wavenumber (cm-1). Every molecule has several unique vibrational states, resulting in scattering of photons at several different Raman shifts; thus the spectral features of the Raman scattered light can be used to identify molecules with high specificity. Furthermore, the Raman spectrum of a
heterogeneous sample composed of several chemicals is simply a linear combination of each component chemical's Raman spectrum, with relative weighting coefficients determined by concentration and Raman scattering cross section (probability for Raman scattering)
[68,71].
Spontaneous Raman scattering is very weak - for a typical sample, about 1 in 1010 incident photons are Raman scattered [72]. Because inelastic scattering is a low probability event, Raman photons comprise only a small portion of the light remitted from the sam-ple, as compared to elastically scattered light and fluorescence. In human tissue, accurate chemical characterization is challenging as the inherently low Raman signal is buried in the background of these competing signals.
1.2.1 Biomedical Raman spectroscopy
Raman spectroscopy probes the vibrational modes of a sample, which depend on both the molecular composition and molecular structure of the sample. Thus, Raman spectroscopy may be sensitive to disease induced changes in biological tissue, even before such changes are histologically discernible.
As a nondestructive optical technique, Raman spectroscopy requires minimal sample preparation - the only requirement is to bring the sample close enough to the optical apparatus. The use of optical fiber probes makes it possible to conduct Raman spectroscopy on many biological tissues in situ, and for some tissues, non-invasively. Because of these advantages, Raman spectroscopy has been studied for the detection and diagnosis of many diseases [73], including skin cancer [74], breast cancer [75], cervical cancer [76,77], Barrett's esophagus [78], bladder and prostate cancer [79], brain tumors [80], and atherosclerosis
[69,70, 81-85].
Instrumentation
In a typical dispersive Raman system (Figure 1-3), near-infrared laser light is focused onto the tissue. Remitted light is collected by the focusing optics and filtered to remove the elastically scattered light. The resulting autofluorescence and Raman scattered light is directed into a spectrometer, where it is dispersed onto a CCD, and the spectrum is recorded. Because the energy shift associated with Raman scattering is independent of the wave-length of the excitation light, it is possible to choose an excitation wavewave-length that produces
CC["'~" ( ) V ( Sample Filter
Figure 1-3: In a typical benchtop Raman system, laser illumination is reflected off a longpass optical filter and focused onto the sample. Remitted light propagates through the lens to the filter, which blocks the elastically scattered light from propagating to the spectrometer.
less fluorescence, maximizes tissue penetration, and minimizes tissue damage. Autofluores-cence from the tissue can be orders of magnitude higher than the Raman signal. Near IR excitation can minimize autofluorescence, so biological Raman spectroscopy is often performed using excitation in the 700 - 900 nm range.
Raman shifts are typically measured in the wavenumber region from 400 to 1800 cm- 1
[68, 69, 81, 83, 86, 87], which is termed the "fingerprint" (FP) region because of its high sensitivity for biologically relevant molecules. There has been recent interest in Raman spectroscopy based on the "high wavenumber" (HW) region, from 2400 to 3800 cm- 1, which
may contain less molecular information but offers significant technical advantages [88].
Optical fiber Raman probes
Conducting biological Raman spectroscopy in situ often requires a Raman probe. A Raman probe consists of one or more optical fibers, which guide excitation light from the laser to the tissue and deliver Raman scattered light from the tissue to the spectrometer. The distal tip of the optical fiber probe may contain optical elements that filter, focus, and collect the light from the tissue.
A typical FP Raman probe utilizes separate excitation and collection fibers to avoid generating a competing Raman background signal from within the fibers (Figure 1-4). Laser light propagating through a fused silica excitation fiber generates a large Raman background signal, so that both excitation light and fiber Raman are incident on the tissue. The tissue then remits the tissue Raman photons, the elastically scattered excitation photons, and the
elastically scattered fiber Raman photons. As these three signals propagate through the collection fiber, an additional fiber Raman component is generated. At the spectrometer input, the elastically scattered excitation photons can be filtered out, but the fiber and tissue Raman signals occupy the same wavelength range, and thus both contribute to the overall measured Raman signal. The fiber Raman signal often has spectral features that overlap with the tissue Raman signal, and in most cases the fiber Raman signal is much higher in magnitude than the tissue Raman signal.
This background can be avoided by placing optical filters at the distal end of the fibers [86,89,90]. On the excitation fiber(s), a narrow bandpass or shortpass filter is used to block the fiber Raman signal from entering the tissue, so that only excitation light impinges on the tissue sample. A longpass filter is placed on the collection fiber(s) to block elastically scattered light remitted from the sample, allowing only Raman scattered light from the tissue to propagate through the fiber(s) to the spectrometer.
Fiber
background
i\
tiTissue
0X
o xI
sample
sample
Figure 1-4: Raman probes for the fingerprint region require optical filtering to avoid con-founding the biological Raman signal with the Raman signal generated within the fiber.
Tissue
signal
Excitation
laser
0 XW
'i I.x
'lI!!
i
3
75
Data analysis and classification
Biomedical Raman spectroscopy applications have primarily been focused on disease diag-nosis, which requires the development of a diagnostic algorithm. The algorithm provides a mapping from the multi-dimensional Raman spectrum to one of a small number (< 10) of distinct classes, or diagnoses. Raman spectroscopy diagnostic algorithms are often per-formed in two steps: dimension reduction and classification.
The measured Raman spectrum may consist of
l1000
data points (corresponding to the number of CCD pixels), so for further analysis it is convenient to reduce the dimension of the data to a tractable number of parameters. Simple examples of dimension reduction techniques include extracting the intensities of a carefully chosen subset of Raman bands, or calculating ratios of specific Raman bands [77]. Another method of dimension reduction is to model the Raman spectrum as a linear combination of a limited number of basis spectra. The set of bases used in the model can be physically motivated, such that they correspond to spectra of specific chemical [68, 70] or morphological constituents [83,91], or they may be a numerically derived set of orthogonal bases, as in principal components analysis [81,92, 93]. When using physical bases, the weighting coefficients are found using a fitting algorithm (typically a least squares algorithm), but for orthogonal bases, weighting coefficients are found by simply computing the dot product of each basis with the spectrum.Next, the output parameters from the dimension reduction step are used as the input to a classification algorithm. Supervised classification is often used, requiring a training set consisting of Raman spectra and corresponding disease diagnoses. Examples of classification algorithms that have been previously demonstrated with Raman spectroscopy are linear discriminant analysis [93], logistic regression [69, 70,81], and artificial neural nets [92].
1.2.2 Raman for atherosclerosis
Several researchers have investigated the use of Raman spectroscopy for diagnosing athero-sclerosis [68-70, 81-87, 91,92]. Two physically motivated spectral models have been devel-oped. The first model utilized basis spectra measured from purified chemicals found in the artery, including delipidized artery (primarily collagen and elastin), free cholesterol, choles-terol ester, triglycerides, calcification, and -carotene [68]. For the second spectral model, a confocal Raman setup was used to acquire basis spectra of morphological structures found
Table 1.1: Several studies utilizing Raman spectroscopy for diagnosis of atherosclerotic plaque have been reported. Raman spectra are modeled as a linear combination of chemical bases (chem.) [68], morphological bases (morph.) [91], or principal components (PCA), or reduced using the discrete wavelet transform (DWT). Where available, the number of specimens and classification accuracy for the training and prospective data sets is given.
Author Romer [70] Deinum [81] Buschman [69] Salenius [82]
Motz
[83]
Silveira [84] Nogueira [85] de Paula [92] Artery coronary coronary coronary carotid/femoral carotid/femoral coronary carotid coronary Model chem. PCA morph. chem. morph. PCA PCA PCA DWT Training set N Accuracy 97 98% 97 94% 97 98% 167 -a 34 82% 60 88% 75 94% > 93% 40 > 91% Prospective set N Accuracy 68 94% 68 90% 68 94%0
-0 51 82% 0 > 92% 20 > 89% aThe authors do not report overall accuracy. The sensitivity and specificitylipid was 92% and 53%, and for detecting calcium salts, 100% and 88%.
for detecting
in the artery, including internal elastic lamina, collagen fibers, smooth muscle cells, adventi-tial fat, foam cells, cholesterol crystals, carotene containing crystals, and calcifications [91]. These models, in addition to models numerically derived using principal component analysis (PCA), have been used to diagnose atherosclerotic lesions via Raman spectroscopy (Table 1.1).
In three related studies, a single dataset was analyzed using all three spectral models. Fingerprint Raman spectra were acquired from a single site on 165 ex vivo coronary lesions using a benchtop configuration. Lesions were irradiated with 350 mW of 830 nm laser light, and Raman spectra were collected for between 10 to 100 seconds. The spectral acquisition site was marked with ink and submitted for histological processing. Each specimen was histologically classified into one of three general categories: nonatherosclerotic plaque (73 specimens in the training set and 26 in the prospective set), noncalcified atherosclerosis (9 in training set and 16 in prospective set), and calcified atherosclerotic plaque (15 in training set and 26 in prospective set).
Based on this dataset, Romer et al. fit the spectra to the purified chemical based spectral model, and using the resulting fit coefficients, diagnosed the lesions using logistic
regression. They report 98% accuracy in the training dataset and 94% accuracy in the prospective dataset [70]. Deinum et al. used the same data set to derive basis spectra using PCA. Fit coefficients for two principal components served as the input to logistic regression, which yielded accuracy of 94% and 90% for the training and prospective datasets, respectively [81]. Buschman et al. fit the dataset to the morphological spectral model and used the fit coefficients with logistic regression to acheive accuracy of 98% and 94% for the training and prospective datasets.
In a separate study, Salenius et al. acquired spectra of 167 carotid and femoral artery lesions. After fitting the spectra to the chemical spectral model, the presence of diseased levels of cholesterol and calcium salts were detecting using threshold tests on the fit coef-ficients. They reported 92% sensitivity and 53% specificity for detecting lipid, and 100% sensitivity and 88% specificity for detecting calcium salts [82].
Motz et al. performed Raman spectroscopy in vivo, acquiring 34 spectra during carotid endarterectomy and femoral bypass surgeries. The spectra were fit to the morphological model, and logistic regression was used to classify plaques as vulnerable or stable. Histolog-ically, vulnerability was assessed using a scheme proposed by the authors, in which a vulner-ability score was assigned based on histologic features such as the presence of thrombosis, ulceration, and hemorrhage, the thickness of the fibrous cap, the diameter of the necrotic core, and the presence and depth of foam cells. Using leave-one-out cross-validation, the authors report sensitivity and specificity of 79% and 85% for detecting vulnerable plaque, with an overall accuracy of 82% [83].
Silveira et al. acquired Raman spectra at single sites of 111 coronary artery specimens and histologically classified the specimens into three categories: nonatherosclerotic, non-calcified, and calcified. They derived a spectral model using PCA, and using discriminant analysis based on the Mahalanobis distance, two principal components were used to classify the specimens, with an overall accuracy of 88% in the training set and 82% in the prospec-tive set. They report sensitivity and specificity of 90% and 83% for prospecprospec-tively detecting lipid rich, noncalcified plaques (n = 21) [84].
Nogueira et al. performed a similar study, acquiring spectra at single sites of 75 carotid artery specimens and histologicaly classifying the specimens into the same three categories. Again, two principal components were used to classify plaques using discriminant analysis based on the Mahalanobis distance. They report overall accuracy of 94%, with sensitivity
and specificity of 89% and 96% for detecting lipid rich, noncalcified plaques (n = 19) [85]. de Paula Jr. and Sokki acquired Raman spectra at single sites of 60 coronary artery spec-imens, which were histologically diagnosed into three categories: atheroma, non-pathologic tissue, and calcified tissue. The authors compared two dimension reduction techniques, the discrete wavelet transform (DWT) and PCA. Between 10 and 19 coefficients were used to train and validate artificial neural networks, with overall accuracy of greater than 90% for both DWT and PCA [92].
1.2.3
Catheter-based Raman spectroscopy for atherosclerosis
Conducting intracoronary Raman spectroscopy in vivo requires a catheter, consisting of an optical probe placed inside a sheath that can be safely maneuvered inside the coronary artery tree Figure 1-5). The optical probe itself is made up of one or more bundled optical fibers that guide light to and from the distal optical elements that filter, focus, and collect the light from the tissue. Towards the proximal end of the catheter, the fiber bundle is split into excitation and collection fibers. The excitation fiber is coupled to the laser and the collection fibers are coupled into the input of the spectrometer.
Laser Artery
Spectrometer/ Catheter
CCD
Distal
optics
Figure 1-5: A Raman catheter consists of one or more optical fibers to: 1) deliver laser light to the artery, 2) collect emitted Raman light, potentially using distal optics, and 3) deliver the collected Raman light to the spectrometer.
Several FP Raman probes have been developed for Raman spectroscopy of arterial tissue (Table 1.2) [86, 94, 95]. All of these probes consist of a central excitation fiber surrounded by a ring of collection fibers, with separate filters used for excitation and collection. The fibers used are generally multimode fused silica fibers.
Shim et al. demonstrated a 1.5 mm diameter probe consisting of seven collection fibers (300 gm core diameter) arranged around a single excitation fiber (400 gm core). Each fiber was internally filtered with an individual filter placed 2.5 cm from the distal tip of the probe. The collection fibers were beveled and coated with a reflective layer to increase
the overlap between the excitation and collection light cones. This forward-viewing probe was demonstrated on rabbit aorta ex vivo [94]. A side-viewing version of this probe was made, without beveled fibers, by incorporating a gold plated mirror oriented at 450 from the optical axis. Raman spectra were acquired with the side-viewing probe in vivo in sheep
aorta [87].
Motz et al. fabricated a 2 mm diameter Raman probe consisting of 15 collection fibers arranged around a single excitation fiber. All fibers had 200 gm core diameter. Two separate optical filters were epoxied to the distal tip of the fibers: a central cylindrical shortpass filter for the excitation fiber and an annular longpass filter for the collection fiber. A 2 mm diameter ball lens was incorporated at the distal tip to maximize overlap of the excitation and collection light cones [86]. This forward-looking probe was used in in vivo during carotid endarterectomy and femoral bypass surgeries [83].
Komachi et al. fabricated a 0.6 mm diameter Raman probe consisting of 9 fibers with 114 jim core diameter, with 8 collection fibers arranged around a single excitation fiber. Similar to the probe demonstrated by Motz et al., one cylindrical and one annular filter were epoxied to the optical fibers. No modifications were made at the distal end of the probe to modify the excitation or collection light cones. The forward looking probe was demonstrated on rabbit aorta ex vivo [95]. Using a 450 mirror, the Raman probe was incorporated into a 2 mm diameter side-viewing catheter, which was used to measure Raman spectra of a lesion-mimicking phantom [96]. They have recently reported a modified probe, incorporating a lens with a hole drilled through the center, providing for lensing over the the collection fibers only [97]. To date, this 0.7 mm diameter probe has not been demonstrated on arterial tissue.
1.3
Toward an intracoronary Raman system
A successful in vivo Raman spectroscopy system must achieve sufficient signal-to-noise ratio (SNR) for accurate data analysis and classification while utilizing a small (-1 mm) diameter catheter. It must also have the ability to screen a large area of the coronary at high speeds (< 1 s per point), be portable, and meet patient safety standards. The SNR is defined as the ratio of the mean of a particular Raman band to its standard deviation, and is both sample and system dependent. SNR is affected by 1) the magnitude of the Raman
Table 1.2: Several optical fiber Raman Shim [94]
7 around 1 Fibers (400 gm core ex.
300 gm core coll.) Filter Lensing Outer diameter Applications
1 filter per fiber
beveled collection fiber tips 1.5 mm In vivo sheep aorta [87] 830 nm, 100 mW 30s
probes for arterial Motz [86] 15 around 1 (200 jim core) 1 central filter 1 annular filter ball lens 2 mm In vivo human
femoral and carotid (surgical field) [83] 830 nm, 100 mW, Is
tissue have been reported. Komachi [95] 8 around 1 (114 gm core) 1 central filter 1 annular filter none 0.6 mm Ex vivo rabbit aorta [95] 720 nm, 7 mW, -20 s
signal, 2) the collection efficiency of the optical fiber probe, 3) the magnitude of the Raman background generated in the probe, and 4) the presence of shot noise due to the relatively large fluorescence signal generated in the sample. Increasing the laser power or exposure time will increase the total laser energy incident on the sample, with a corresponding increase in the Raman signal. However there is an upper limit to the amount of energy than can be safely delivered to the patient.
High wavenumber Raman
Several of these challenges may be addressed by implementing a significant change in the ba-sic Raman system. In this thesis, we investigate Raman spectroscopy in the high wavenum-ber (HW) region, which provides three important advantages. First, Raman signals in the HW region are roughly three times greater than those in the FP region [88]. Second, very little fluorescence is generated in this region, reducing the overall shot noise. Finally, fused silica does not have Raman bands in the HW region. As a result, fiber background is minimal and filters are not needed, simplifying catheter fabrication [88,98].
These factors indicate that HW Raman may result in increased SNR, allowing for faster data acquisition. However, HW Raman spectroscopy detects different molecular vibrational states than are seen in the FP region. An unpublished proof-of-principle study of HW
Ra-man in five coronary artery samples found that while calcification cannot be seen in the HW region (2700 to 3100 cm- 1), there is high sensitivity to triglycerides, cholesterol, cholesterol
esters, and proteins [88]. Due to the significant technical advantages of HW Raman spec-troscopy, a comprehensive investigation of its capabilities for chemical characterization is merited.
One of the goals of this thesis is to develop a database of FP and HW Raman spectra with correlated histology. In Chapter 2 we describe the methods used to create this database, and in Chapter 3 we compare the diagnostic capability of Raman spectroscopy in the fingerprint and high wavenumber regions.
Raman line imaging
Previously published work on Raman spectroscopy for atherosclerosis has concentrated on assigning a diagnosis based on the Raman spectrum taken from a single site within a lesion. However, this approach is limited because atherosclerotic lesions are complex and heterogeneous, and a single site spectrum may not capture enough chemical information to fully characterize the lesion. For this reason, we investigate a Raman line imaging procedure, in which multiple Raman spectra are acquired, at fixed intervals, across the full cross-section of the lesion. This line imaging paradigm is analogous to the way we expect data will be taken with the intracoronary cathether.
By acquiring localized data across a larger area of the plaque than is traditionally used, the data from the line imaging paradigm may enhance plaque classification algorithms. In particular, it may become possible to extend the traditional 3-category classification scheme to a more sophisticated scheme, based on the chemical content and spatial extent of the entire lesion. For example, the ability to subdivide the "non-calcified plaque" category into
"necrotic core" and "non-necrotic core" plaques would be clinically relevant.
We have used the Raman line imaging paradigm on all of the specimens in the combined FP/HW ex vivo Raman database. This paradigm has added new challenges in managing the data. We describe the line scanning methods in Chapter 2.
Optical probe design
A key component of the intracoronary Raman system is the intracoronary catheter. In this thesis we explore optimization of the optical probe design to increase collection efficiency.
Building on prior work in the field, we fabricate and characterize a prototype Raman probe in Chapter 4. In Chapter 5, we convert the forward-viewing Raman probe to a side-viewing catheter and demonstrate it in an in vivo xenograft model, in which human coronary arteries extracted from a cadaver are grafted onto the heart of a living swine. In Chapter 6, we describe an optical modeling technique for simulating probe sampling volume and collection efficiency, which can be used for optimizing Raman catheter design.
Chapter 2
Ex Vivo Raman Database
In this chapter we describe the ex vivo Raman database, a database of Raman spectra and coresponding histology for over sixty atherosclerotic plaque specimens obtained from human aorta. Generating the database is a multiple step process that includes acquisition and processing of Raman spectra and histological images, verification and validation of the data, and pathological diagnosis (Figure 2-1). In this chapter, we describe the methods used to build and visualize the database. Data analysis will be discussed in Chapter 3.
2.1
Data acquisition
2.1.1 Experimental setup
We have developed a benchtop Raman system that implements both high wavenumber Raman spectroscopy and line imaging. Using a single fixed-grating spectrometer and CCD, the system is capable of acquiring Raman spectra in both the fingerprint (FP) (600 - 1800 cm- 1) and high wavenumber (HW) (2600 - 3100 cm-1) regions by sequentially illuminating
the sample with two separate laser sources. The system also incorporates line scanning, physiological temperature control and automated depth focusing.
The Raman line imaging system is shown in Figure 2-2. The Raman spectra are detected by a fixed-grating spectrometer (Holospec f/1.8, Kaiser Optical Systems; Ann Arbor, MI) and a deep-depleted, back illuminated CCD (Pixis 400:BR, Princeton Instruments; Trenton, NJ); this combination acquires spectra in the wavelength range of 830 to 1000 nm. When illuminating the samples with an 830 nm diode laser (Process Insruments Inc.; Salt Lake
Pathology
diagnosis
Data acquisition
Data
processing
Vi
Verification &
validation
+
/7
Spectral
and histological
database
Visualization &
analysis
Diagnostic
ch
Lesion
algorithms
characterization
sample
Figure 2-2: Benchtop Raman line imaging system.
City, UT), the system measures Raman spectra in the FP region (400 - 1800 cm-'), and when illuminating with a 740 nm diode laser (Innovative Photonics Solutions; Monmouth Junction, NJ), HW spectra are measured (1600 - 3300 cm-1).
Light from the two fiber-coupled diode lasers was collimated, combined into a single beam path using a dichroic mirror, and focused into a 100 tm core, multimode fiber with 0.26 NA (Polymicro Technologies; Phoenix, AZ). Two computer-controlled high speed me-chanical shutters (Uniblitz, Vincent Associates; Rochester, NY) were placed before the dichroic mirror to rapidly switch between the two excitation wavelengths. Light exiting the common fiber was collimated and any Raman or fluorescence generated within the fiber was removed using a laser line bandpass filter (Semrock LL01-830; Rochester, NY) at 830 nm, or a longpass filter (CVI) for the 740 excitation beam. The laser light was then reflected off a longpass filter (Semrock LP02-830RU) at a -10' incidence angle and focused on the sam-ple using a f/2 calcium fluoride lens. Light returning from the samsam-ple was directed toward the longpass filter by the same f/2 lens. The longer wavelength Raman signal and tissue fluorescence passed through the longpass filter and were focused into the spectrometer. The Holospec spectrometer had a 100 gm internal slit resulting in an average spectral resolution
of 8 cm- 1.
Temperature control
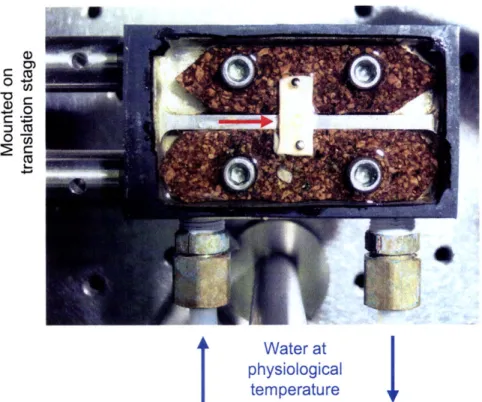
The aortic specimen was mounted on a custom-made specimen mount, designed to main-tain the specimen at a physiological temperature of 370 C (Figure2-3). Temperature was maintained by flowing water through the mount from a thermostated water bath (NesLab, Thermo-Fisher Scientific; Waltham, MA). Prior to line imaging, each specimen was pinned to cork inserts to prevent movement during the scan, and the specimen was immersed in a phosphate-buffered saline solution to prevent dehydration.
Raman line imaging
Line imaging of each aortic lesion was implemented by securing the specimen mount to a computer controlled 3-axis translation stage. Each translation stage axis was equipped with a linear actuator (LTA-HL, Newport; Irvine, CA) driven by a computer interfaced controller (Newport ESP3000). Spectral line images were acquired in one direction (Figure 2-3). Raman spectra were acquired at discrete locations on the specimen, with a fixed
O V
(UL
Water at
physiological
temperature
Figure 2-3: Temperature-controlled specimen mount.
interval of 200 - 250 pm.
Automated depth focusing
The tissue surface height of an aortic lesion is typically nonuniform, so we have implemented automatic z-focusing to ensure that all spectra are taken with the same distance between the tissue surface and focusing lens, thus maintaining a constant beam diameter at the surface. Depth focusing was implemented by maximizing the amount of specularly reflected excitation light collected from the tissue surface (Figure 2-2).
The excitation light returning from the tissue was collected by the f/2 lens, collimated, and reflected off the longpass filter, back into the incoming beam path (dashed line in Figure 2-2). Since the returning excitation light is made up of diffusely and specularly reflected components, an aperture was placed in the beam path to remove some of the diffuse reflectance. The remaining light was directed toward a photodetector and focused into a 100 gm pinhole via an achromatic f/2 lens. A LabView routine adjusted the focus
![Figure 1-2: Stages of atherosclerosis. Reprinted by permission from Macmillan Publishers Ltd: Nature Reviews Genetics [5], @ 2006.](https://thumb-eu.123doks.com/thumbv2/123doknet/14733412.573549/21.918.159.757.143.1013/figure-atherosclerosis-reprinted-permission-macmillan-publishers-reviews-genetics.webp)

![Table 2.1: Histological classification scheme used for the database. This scheme is adapted from [11].](https://thumb-eu.123doks.com/thumbv2/123doknet/14733412.573549/54.918.150.808.395.739/table-histological-classification-scheme-used-database-scheme-adapted.webp)