LABORATORY INVESTIGATION
Structural alterations of the erythrocyte membrane proteins
in diabetic retinopathy
Ioannis K. Petropoulos&Panagiotis I. Margetis&
Marianna H. Antonelou&John X. Koliopoulos&
Sotirios P. Gartaganis&Lukas H. Margaritis&
Issidora S. Papassideri
Received: 28 July 2006 / Revised: 12 November 2006 / Accepted: 13 November 2006 / Published online: 12 January 2007 # Springer-Verlag 2007
Abstract
Background Several rheological disorders of the erythro-cytes, such as increased aggregation and decreased deform-ability, have been observed in diabetes mellitus and have been implicated in the development of diabetic microangiopathy. Structural alterations of the erythrocyte membrane proteins caused by the diabetic process may be at the origin of those observations. In the present study, we searched for erythrocyte membrane protein alterations in diabetic retinopathy. Methods We examined peripheral blood samples from 40 type-2 diabetic patients with diabetic retinopathy of variable severity (19 males and 21 females, mean age 66.8 years, Group A) and we compared them with samples from 19 type-2 diabetic patients without diabetic retinop-athy (13 males and six females, mean age 66.5 years, Group B) and 16 healthy volunteers (eight males and eight females, mean age 65.6 years, Group C). Erythrocyte
membrane ghosts from all samples were subjected to SDS-PAGE, and the electrophoretic pattern of transmem-brane and cytoskeletal proteins was analysed for each sample. The protein quantification of each electrophoretic band was accomplished through scanning densitometry. Results No significant deviations from normal electrophore-sis were observed in Groups B and C, apart from an increase in band 8 in two samples from Group B (11%). In contrast, in 14 samples from Group A (35%) we detected increases in protein band 8 and/or membrane-bound haemoglobin along with a decrease in spectrin. Moreover, increased mobility of band 3, an aberrant high molecular weight (MW) (>255 kDa) band and a low MW (42 kDa) band were evident in ten samples from Group A (25%). Glycophorins were altered in 46% of Group-A patients versus 38% of Group-B patients. Females and patients with long duration of diabetes presented more electrophoretic abnormalities.
Conclusions Structural alterations of the erythrocyte mem-brane proteins are shown for the first time in association with diabetic retinopathy. Their detection may serve as a blood marker for the development of diabetic microangiopathy. Further studies are needed to assess whether pharmaceutical intervention to the rheology of erythrocytes can prevent or alleviate microvascular diabetic complications.
Keywords Diabetes mellitus . Diabetic retinopathy . Erythrocyte membrane proteins . Transmembrane proteins . Cytoskeletal proteins . Electrophoresis . Rheology
Introduction
Diabetic retinopathy constitutes a major social problem, as it is present in nearly 100% of patients who have had type 1 diabetes mellitus for 20 years and in nearly 80% of those with type 2 diabetes of this duration [14]. Furthermore,
I.K. Petropoulos and P.I. Margetis are equal first authors.
Part of the present study was presented at the 5th European Congress of Endocrinology, June 2001, Turin, Italy; at the 15th International Congress of Eye Research, October 2002, Geneva, Switzerland; and at the Winter Meeting 2004 of the Swiss Society of Ophthalmology, March 2004, Interlaken, Switzerland.
I. K. Petropoulos (*)
Department of Ophthalmology, University Hospitals of Geneva, 22 Alcide-Jentzer Street,
1211 Geneva 14, Switzerland e-mail: [email protected]
P. I. Margetis
:
M. H. Antonelou:
L. H. Margaritis:
I. S. Papassideri
Department of Cell Biology and Biophysics, Faculty of Biology, University of Athens,
Athens, Greece
J. X. Koliopoulos
:
S. P. GartaganisDepartment of Ophthalmology, University of Patras, Patras, Greece
diabetic retinopathy is the leading cause of blindness in working-age individuals in the industrialised world [33]. Non-proliferative diabetic retinopathy begins with basement membrane thickening and loss of capillary pericytes and endothelial cells [23], progressively leading to microaneur-ysms, retinal haemorrhages, venous beading, leakage, and macular oedema. In later stages, capillary closure causes retinal ischemia, which is followed by retinal neovasculari-zation, the hallmark of proliferative diabetic retinopathy, thus increasing the probability of severe visual impairment.
Multiple pathophysiological disorders have been impli-cated in the development of diabetic microangiopathy, including increased plasma and whole blood viscosity [19] as well as rheological disorders of the erythrocytes, namely increased erythrocyte microviscosity, aggregation, and adhesiveness, and decreased erythrocyte deformability [38]. Rheological disorders of the erythrocytes may be related to specific changes of the mechanical properties of the erythrocyte membrane, potentially associated with structural alterations of membrane lipids or proteins occur-ring in diabetes of long duration.
The isolation of erythrocyte membrane‘ghosts’ free of haemoglobin and cytoplasm [10] enabled the study of the erythrocyte membrane in detail. The erythrocyte membrane is composed of a lipid bilayer, penetrated by the trans-membrane proteins, and of the trans-membrane skeleton, formed by the peripheral or cytoskeletal proteins. The membrane skeleton is a bidimensional network that laminates and supports the inner surface of the bilayer. Skeleton proteins are connected to transmembrane ones through anchoring proteins, particularly ankyrin and protein 4.1. The trans-membrane proteins include mainly the anion transport
protein band 3 and the glycophorins, while the cytoskeletal proteins comprise mainly spectrin and actin [8].
A number of hereditary haemolytic anaemias, often associated with erythrocyte shape and deformability abnor-malities, derive from mutations affecting genes that encode erythrocyte transmembrane, cytoskeletal, or anchoring proteins [8]. If rheological disorders of the erythrocytes indeed participate in the pathogenesis of diabetic micro-angiopathy, this may well reflect corresponding erythrocyte membrane protein abnormalities. Thus, in the present study we searched for possible structural alterations of the erythrocyte membrane proteins in diabetic retinopathy, as well as for a potential link of such alterations to the severity of retinopathy.
Materials and methods
Three groups of subjects were studied: (1) type-2 diabetic patients with diabetic retinopathy of variable severity (Group A, n=40); (2) type-2 diabetic patients without diabetic retinopathy (Group B, n=19); and (3) healthy non-diabetic age-matched volunteers, who served as controls (Group C, n=16). The main demographic characteristics of those three groups are presented in Table 1. The study gained approval from the local ethics committee at the University Hospital of Patras, Greece, and informed consent was obtained from all subjects. The investigations were carried out in accordance with the principles of the Declaration of Helsinki. All subjects were offered a thorough eye examination, including visual acuity mea-surement, slit-lamp examination, tonometry, dilated
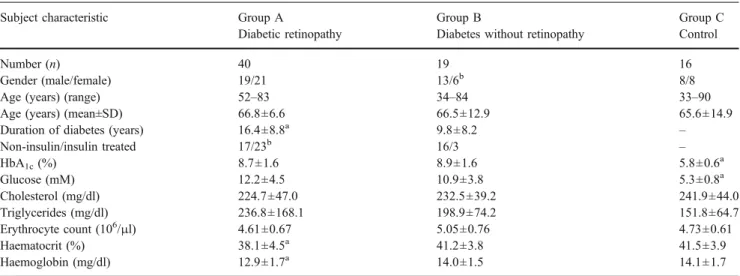
oph-Table 1 Demographic, clinical, and laboratory characteristics of patients (values are expressed as the mean±SD)
Subject characteristic Group A Group B Group C
Diabetic retinopathy Diabetes without retinopathy Control
Number (n) 40 19 16
Gender (male/female) 19/21 13/6b 8/8
Age (years) (range) 52–83 34–84 33–90
Age (years) (mean±SD) 66.8±6.6 66.5±12.9 65.6±14.9
Duration of diabetes (years) 16.4±8.8a 9.8±8.2 –
Non-insulin/insulin treated 17/23b 16/3 – HbA1c(%) 8.7±1.6 8.9±1.6 5.8±0.6a Glucose (mM) 12.2±4.5 10.9±3.8 5.3±0.8a Cholesterol (mg/dl) 224.7±47.0 232.5±39.2 241.9±44.0 Triglycerides (mg/dl) 236.8±168.1 198.9±74.2 151.8±64.7 Erythrocyte count (106/μl) 4.61±0.67 5.05±0.76 4.73±0.61 Haematocrit (%) 38.1±4.5a 41.2±3.8 41.5±3.9 Haemoglobin (mg/dl) 12.9±1.7a 14.0±1.5 14.1±1.7 a
Statistically significant difference versus the other two groups (unpaired Student’s t-test, P<0.05)
b
Statistically significant difference versus the other two groups (chi-square test, P<0.05) All other differences were not statistically significant
thalmoscopy with stereoscopic colour photos, and fluores-cein angiography. The degree of diabetic retinopathy was defined according to the Early Treatment Diabetic Retinop-athy Study (ETDRS) guidelines [9,12] in the most severely affected eye (Table2).
After overnight fasting, peripheral venous blood was collected from all subjects into acid citrate EDTA tubes. Serum glucose, cholesterol, and triglycerides, as well as erythrocyte count, haematocrit, haemoglobin, and HbA1c
were measured. The erythrocytes were separated from plasma by centrifugation at 3,000 rpm for 10 min. Membrane ghosts were prepared by hypotonic lysis of erythrocytes in phosphate buffer at 4°C as described by Dodge et al. [10], with the addition of 0.3 mmol/l phenyl-methyl-sulfonyl-fluoride to the lysis buffer to inhibit protease activity. Total protein concentration of each sample was determined using the Bradford protein assay reagent, with bovine serum albumin (Bio-Rad Laboratories, UK) serving as standard. The protein components of each sample were determined by one-dimensional sodium dodecylsulfate-polyacrylamide gel electrophoresis (SDS-PAGE) under reducing conditions using the discontinuous buffer system of Laemmli [27] and homogeneous or 5–15% linear acrylamide gradient. The gels were stained either with Coomassie blue R-250 for protein staining, or with Periodic Acid-Schiff (PAS) reagent for carbohydrate
stain-ing and visualization of glycophorins, as described by Fairbanks et al. [13].
Individual membrane proteins were identified and quantified, as required, by lengthwise scanning densitom-etry of either Coomassie blue- or PAS-stained SDS-PAGE gels, using the Gel Analyzer v. 1.0 image-processing program (Biosure, Athens, Greece). The molecular weight (MW) definition of aberrant bands was compared with a lane of MW protein standards. Each sample was analysed in triplicate gels alongside with numerous reference samples (from healthy subjects or patients’ control group). The relative amount of each major protein band was expressed as a percentage of total bands measured (namely, spectrin, band 3, 4.1, 4.2, 5, 6, 7, 8, and globin) upon the densitometric scanning of each track. The mean values presented by the studied patient groups (A and B) were compared between them and with those presented by the healthy controls (Group C). Regarding the quantification of the glycophorins, the results were reported as the ratio of each PAS-stained band to the sum of the main bands revealed in each track after double staining of the gel with PAS reagent and (subsequently) Coomassie blue. Protein deficiency/excess was considered significant whenever the mean density of that protein was lower/higher than the mean density minus/plus 2× standard deviation (SD) presented by the reference samples for the same protein. Hence, any value being out of the described range (i.e. mean density in samples from normal reference people ±2 SDs) was defined as pathological.
Each value was expressed as the mean±SD. The unpaired Student’s t-test and the chi-square test were used to compare mean values and frequencies between groups, respectively. In each case, a level of P < 0.05 was considered statistically significant.
Results
The main clinical characteristics of the studied groups are presented in Table 1. Mean age was similar among the groups, whereas the duration of diabetes was significantly longer in Group A (diabetic retinopathy) than in Group B (diabetes without diabetic retinopathy). Also, as expected, the proportion of insulin-treated patients was significantly higher in Group A compared with Group B.
According to the ETDRS classification (Table 2), 18 patients (45%) of Group A were diagnosed with non-proliferative diabetic retinopathy, whereas 22 patients (55%) had already developed proliferative diabetic retinop-athy (Table 3). Sixteen patients (40%) of Group A presented high-risk proliferative diabetic retinopathy (Fig. 1).
Table 2 Severity levels of diabetic retinopathy (based on the Abbreviated Summary of the ETDRS Final Scale of Diabetic
Retinopathy Severity for Individual Eyes [7]). NPDR non-proliferative
diabetic retinopathy, PDR proliferative diabetic retinopathy, IRMA intraretinal microvascular abnormalities, NVE new vessels elsewhere, NVD new vessels on or within one disc diameter of optic disc Severity level
of DR
Definition
No retinopathy Absence of diabetic lesions
Mild NPDR Microaneurysms only, or microaneurysms plus
hard exudates, soft exudates (cotton-wool spots) and/or mild retinal hemorrhages
Moderate NPDR Microaneurysms plus mild or moderate IRMA,
moderate or severe retinal hemorrhages, or venous beading in one quadrant only
Severe NPDR Severe retinal hemorrhages in four quadrants, or
venous beading in at least two quadrants, or severe IRMA in at least one quadrant
Mild PDR NVE less than half of disc area in one or more
quadrants
Moderate PDR NVE greater or equal to half of disc area in one or
more quadrants, or NVD less than a quarter to a third of disc area
High-risk PDR NVD greater or equal to a quarter to a third of
The results of laboratory parameters are also shown in Table 1. Serum glucose and HbA1c were significantly
higher in Groups A and B compared with controls.
Moreover, Group A presented significantly lower haema-tocrit and haemoglobin compared with the other groups.
Concerning the SDS-PAGE results, there were no significant deviations from normal Coomassie-blue stained electrophoresis of total membrane proteins observed in Groups B (diabetes without diabetic retinopathy) and C (healthy controls), apart from an increase in protein band 8 shown in two samples (11%) from Group B, 120% and 150% above normal values, respectively. In contrast, in 14 samples (35%) from Group A (diabetic retinopathy) we detected deviations concerning increases in protein band 8 (100% to 200% above normal values) and/or membrane-bound haemoglobin (100% to 340% above normal values) along with a decrease in the major skeletal protein spectrin (20% below normal values). The increase in protein band
Table 3 Distribution of abnormal SDS-PAGE samples upon the degrees of diabetic retinopathy
Severity level of DR in worse eye
Number of patients
Number of patients with abnormal electrophoresis Mild NPDR 2 0 (0%) Moderate NPDR 9 5 (56%) Severe NPDR 7 5 (71%) Mild PDR 2 1 (50%) Moderate PDR 4 3 (75%) High-risk PDR 16 10 (63%) Total 40 24 (60%)
Fig. 1 Red-free photograph and late-phase fluorescein angiography of the right eye in a 52-year-old male patient with high-risk proliferative diabetic retinopathy according to the ETDRS classification guidelines, as new vessels cover one half of the disc area. Areas of capillary non-perfusion can also be observed in the retinal periphery. Duration of diabetes was 10 years. The patient was under insulin treatment. This patient had abnormal electrophoresis with increased mobility of protein band 3
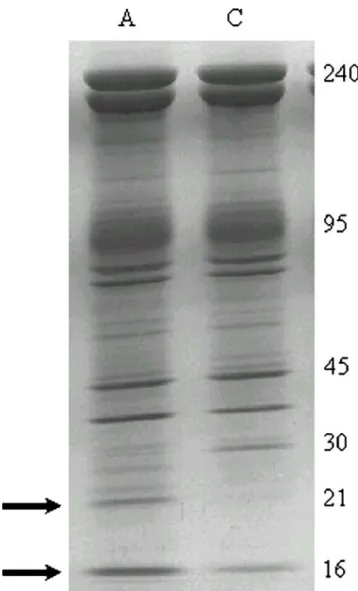
Fig. 2 SDS-PAGE (Laemmli 5–15% linear gradient) of 15 μg ghosts
after staining with Coomassie blue. The arrows show the increase of protein band 8 (21 kDa) and membrane-bound haemoglobin (16 kDa) in a representative sample from a patient with diabetic retinopathy (A) in comparison with a control sample (C). The right column shows MW in kDa
8 was the most common encountered deviation (70% of the disturbed ghosts), followed by those of membrane-bound haemoglobin and spectrin (40% and 20% of the disturbed ghosts, respectively). In some cases the ghosts were characterized by combined deviations concerning band 8 and haemoglobin (Fig.2), or band 8, haemoglobin and spectrin.
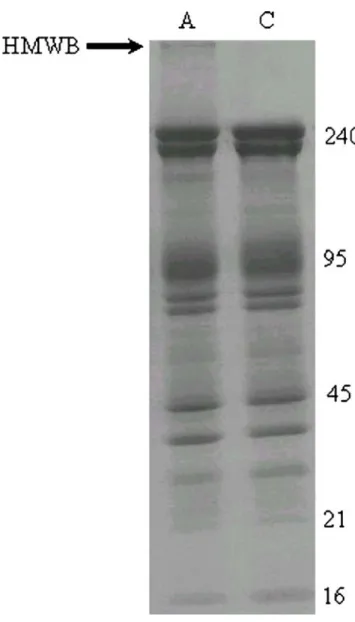
Furthermore, increased electrophoretic mobility of pro-tein band 3 (Fig.3), as well as an aberrant high MW (above 255 kDa) electrophoretic band and a low MW band of
42 kDa (Fig. 4) were evident in ten samples (25%) from patients with diabetic retinopathy (Group A).
The distribution of those Coomassie-blue stained electro-phoretic abnormalities upon the degrees of diabetic retinop-athy is given in Table3. While ten patients with high-risk proliferative diabetic retinopathy (63%) had abnormal electrophoresis (Fig. 1), no direct correlation of the latter with the severity of retinopathy was evident (Table3).
Subsequent staining of the SDS-PAGE gels with the PAS reagent for the detection of membrane glycophorins revealed a deficiency in one or more sialic acid-positive bands in 46% versus 38% of the patients of Groups A and B, respectively. This difference was statistically significant (chi-square test, P<0.001). Notably, in Group-B membrane
Fig. 3 SDS-PAGE (Laemmli 5–15% linear gradient) of 15 μg ghosts
after staining with Coomassie blue. The arrow shows the increased electrophoretic mobility of protein band 3 in a representative sample from a patient with diabetic retinopathy (A) in comparison with a control sample (C). The right column shows MW in kDa
Fig. 4 SDS-PAGE (Laemmli 5–15% linear gradient) of 15 μg ghosts
after staining with Coomassie blue. The arrow shows the aberrant high MW (above 255 kDa) electrophoretic band in a representative sample from a patient with diabetic retinopathy (A) in comparison with a control sample (C). The right column shows MW in kDa. HMWB high molecular weight band
ghosts the deficiencies predominantly concerned glyco-phorins B2, A, or C (83% of the aberrations), whereas in Group A the deficiencies predominantly concerned the band of glycophorin A dimers (55% of the aberrations). Furthermore, Group-A membrane ghosts were commonly characterized by generalized reductions in almost all glycophorin bands (20% of the samples). In 12% of both
groups, a band with MW close to that of glycophorin A dimers was observed (Fig. 5, upper image), whereas in some patients with diabetic retinopathy (Group A) more than one aberrant sialoglycoprotein bands appeared with MW of 70 and 55 kDa (Fig. 5, lower image), probably having arisen from the original glycophorin A and B homo-and hetero-dimer bhomo-ands, respectively.
Females and patients with long duration of diabetes presented more frequent electrophoretic abnormalities. Abnormal electrophoresis was observed in 14/21 females (67%) versus 10/19 males (53%) of Group A (chi-square test, P<0.001). Moreover, duration of diabetes was 21.4± 8.5 years in patients of Group A with abnormal electropho-resis, whereas it was 14.9±8.4 years in patients of Group A with normal electrophoresis (unpaired Student’s t-test, P < 0.001). On the other hand, no correlation of abnormal electrophoresis was observed with any of the following parameters: age, insulin treatment, HbA1c, glucose,
cholesterol, triglycerides, erythrocyte count, haematocrit, and haemoglobin.
Discussion
In the present study we demonstrate for the first time the existence of structural alterations of the erythrocyte mem-brane proteins in diabetic patients that have already developed diabetic retinopathy. Abnormal Coomassie-blue stained electrophoresis of erythrocyte ghost membranes was revealed in more than half of the examined patients with diabetic retinopathy, in all severity grades except mild non-proliferative diabetic retinopathy. In contrast, only 11% of diabetic patients without retinopathy and, as expected, no healthy control subject manifested Coomassie-blue stained electrophoretic abnormalities. In addition, glycophorins were altered in 46% of Group-A patients versus 38% of Group-B patients. Furthermore, long duration of diabetes, which is a more common characteristic in vascular complications of diabetes, seemed to correlate also with abnormal electrophoretic patterns of the erythrocyte mem-brane proteins.
Fig. 5 SDS-PAGE (Laemmli 12% linear gradient) of 80 μg ghostsafter staining with PAS reagent for the detection of glycophorins. The right column shows MW in kDa. Upper image: The arrowheads show a band with MW close to that of glycophorin A dimers (approximately 80 kDa) in representative samples from a patient with diabetic retinopathy (A) and a patient with diabetes mellitus without diabetic retinopathy (B). Two normal control samples (C1 and C2) are also shown for comparison. Lower image: The arrowheads show two aberrant sialoglycoprotein bands with MWs of approximately 70 and 55 kDa in a representative sample from a patient with diabetic retinopathy (A). Two normal samples are also shown for comparison, belonging to a patient with diabetes mellitus but no diabetic retinopathy (B) and to a patient of the control group (C), respectively
Hyperglycaemia resulting from uncontrolled glucose regulation is widely recognised as a causal link between diabetes and diabetic complications [37]. Chronic hyper-glycaemia causes oxidation and non-enzymatic glycosyla-tion (Maillard reacglycosyla-tion) of proteins and this applies on the erythrocyte membrane proteins too [31,45]. Slow turnover of the erythrocyte membrane proteins makes them partic-ularly susceptible to hyperglycaemia [31]. Erythrocyte membrane glycosylation reduces the negative surface electric charge [4, 34] due to cleavage of terminal sialic acid components of glycophorin A, leading to accelerated aging of erythrocytes [28]. It also increases erythrocyte aggregation [36] and accumulates advanced glycation end-products (AGEs), which have been associated with eryth-rocyte deformability defects [6] and with microvascular complications of diabetes [7]. Crossline, a special AGE in the erythrocyte membrane is elevated in diabetic retinopa-thy [47]. In the present study, we were able to show some of the erythrocyte membrane protein alterations that may ensue from altered glucose metabolism to produce diabetic retinopathy.
Erythrocyte membrane proteins serve specific functions. Band 3, for instance, which is the most abundant erythrocyte transmembrane protein and which presented altered mobility in ten samples of Group A in our study, is responsible for anion exchange at the level of plasma membrane [24]. Other transmembrane proteins serve as pumps or channels for the movement of ions and the transport of glucose and other small molecules. In addition, cytoskeletal proteins are important for the maintenance of the biconcave shape and structural integrity of the erythro-cyte. Thus, disorders of the erythrocyte membrane proteins may alter the surface electric charge and the mechanical properties of plasma membrane, namely shape and deform-ability, the latter reflecting the elastic reserve of the erythrocyte when it receives shear stress forces at its passage through small vessels or capillaries. In other words, erythrocyte membrane protein alterations are linked to altered erythrocyte rheology.
There is growing evidence in the literature in favour of the association of haemorrheological abnormalities with diabetes mellitus [5,11,19,30, 38,48]. Those abnormal-ities are more and more thought to participate in the pathogenesis of diabetic microangiopathy. In that context, altered rheology of erythrocytes can lead to increased aggregation, endothelial damage, and capillary closure. This particularly applies on diabetic retinopathy, the most common of diabetic vascular microangiopathies [23]. Characteristically, Vekasi et al. [43] found pathological plasma and whole blood viscosity with concomitant increased red blood cell aggregation in patients with diabetic retinopathy compared with controls. Moreover, Goldstein et al. [17] have recently reported differences in
the mechanical properties of red blood cells between non-proliferative and non-proliferative diabetic retinopathy. Our results support those findings by casting light on the pathogenic mechanisms linking erythrocyte membrane protein alterations to subsequent altered erythrocyte rheol-ogy and to the development of diabetic retinopathy.
There have been several reports in the literature describing a variety of erythrocyte membrane protein alterations in diabetic humans or animals. Schwartz et al. [38] demonstrated oxidation of spectrin in diabetic eryth-rocytes. Adewoye et al. [1] reported absent spectrin in insulin-dependent diabetes mellitus, and increased ankyrin and band 6 in both insulin- and non-insulin-dependent diabetes mellitus. Also, Kaymaz et al. [25] showed weaker actin (band 5), absent band 4.5 (related to glycophorins), and absent band 4.9 (dematin) in diabetic cats. However, in those studies most often no data is given about the presence of diabetic microangiopathy. In the present study, we showed that electrophoretic alterations of the erythrocyte membrane proteins were most frequently manifested in the presence of diabetic retinopathy. We therefore believe that the detection of such alterations may help to clarify the pathogenic steps that contribute to the development of diabetic retinopathy, but it may also serve as a blood marker for the existence of diabetic microangiopathy or as a sign of increased risk to develop diabetic microangiopathy.
In agreement to the latter, red blood cell ultrastructure alterations have recently been proposed as a possible progression marker in non-insulin-dependent diabetes mel-litus [42]. Interestingly, not only the erythrocytes but also the leukocytes seem to play a role in the pathogenesis and/ or progression of diabetic retinopathy. More specifically, integrins are believed to increase leukocyte adhesion to the retinal endothelium. Elevated levels of integrin CD18 (a transmembrane receptor) on the neutrophils were indicated in a late report as a potential severity marker of diabetic retinopathy in type 2 diabetic patients [41]. Nevertheless, only clinical practice will show whether the above possible severity markers of diabetic retinopathy will assume any utility in the future.
Several possible interpretations to those alterations can be drawn from the literature. Accelerated aging of eryth-rocytes in diabetes is one of them [28], consisting of the labelling of erythrocytes with the senescent cell antigen, where an IgG antibody adheres and induces erythrocyte disruption by macrophages [24]. The reported relation of AGEs with macrophages [44], with chemotactic behaviour to human blood monocytes [26], and with increased macrophage colony stimulating factor [46] in diabetic microangiopathy supports this mechanism. Interestingly, it has been reported that different chemical insults within the erythrocyte can result in a common ‘message’ on the outside of the cell, such that the cell appears‘prematurely’
aged [21]. Other possible mechanisms include increased susceptibility of the erythrocyte membrane proteins to lysis by endogenous enzymes reported in diabetes [16, 22], as well as an up-regulation of glucose transporters in the erythrocytes of subjects with chronic hyperglycaemia described by Harik et al. [18]. Increased protein lysis by endogenous enzymes in diabetes is more frequent in females [16], and this gender predilection was expressed in altered electrophoresis in our results. The above mechanisms may account for altered bands or the emer-gence of new bands in erythrocyte membrane electropho-resis seen in the present study.
Protein band 8 was increased in 11% of diabetic patients without diabetic retinopathy and in 35% of patients with diabetic retinopathy, while it was the most common encountered electrophoretic deviation in affected ghosts. Band 8 has not been characterized, but it has been shown in combination with increased proportion of membrane-bound haemoglobin in erythrocytes from anaemic patients [3]. Increased amounts of band 8 have also been reported by other groups in the membranes of metabolically stressed red blood cells [32].
Increased membrane-bound haemoglobin was found only in diabetic retinopathy samples in our study. Previous studies have shown increased proportion of membrane-bound haemoglobin in a variety of stressed erythrocytes, like in in vivo [35] or in vitro senescent normal eryth-rocytes, in erythrocytes with defective haemoglobin [2,3], and in erythrocytes oxidatively stressed in vitro by various haemolytic agents [29]. In addition, thalassaemic mem-branes are generally characterized by an increased binding of cytoplasmic proteins like haemoglobin and catalase [2]. The concomitant decrease in spectrin observed in diabetic retinopathy samples is probably indicative of increased susceptibility of membrane proteins to endog-enous proteolysis, previously shown in diabetes mellitus [16,22].
Furthermore, increased mobility of band 3 and aberrant electrophoretic bands with MWs of 42 kDa and above 255 kDa were found only in diabetic retinopathy samples in the present study. A similar shift in the apparent molecular mass of band 3 glycoprotein has been detected in all type II congenital dyserythropoietic anaemias (CDA II, HEMPAS) due to underglycosylation of the protein [15]. However, at present we are not able to know whether the increased electrophoretic mobility of band 3 in patients with diabetic retinopathy is attributed to a glycosylation defect or to increased proteolysis.
As for the aberrant low MW bands, they probably arise from increased proteolysis of original membrane proteins. The high MW band of above 255 kDa has previously been found in membranes of oxidatively stressed erythrocytes as a crosslinkage event between spectrin and haemoglobin.
The formation of spectrin-haemoglobin crosslinking repre-sents a well-known oxidant damage of the senescent erythrocyte membrane [40]. Its reproduction in vitro by hydrogen peroxide treatment is associated with echinocyte transformation, membrane rigidity, adherence and phago-cytosis [39].
Finally, regarding PAS staining results of the present study, a deficiency in PAS-positive bands was significantly more frequent in diabetic retinopathy (Group A) samples (46%) compared with that of Group B samples (38%). This may constitute evidence of more advanced glycosylation of the erythrocyte membrane proteins in diabetic retinopathy. Of interest, there was a different specificity regarding the sialoglycoproteins affected in Group A and B samples, with the deficiency of glycophorin A dimers and total glyco-phorin bands being dominant in Group A samples. Future research may reveal the biochemical basis of this distinction and, possibly, its clinical importance.
From a clinical point of view, the results of our study raise also the issue of a possible preventive or therapeutic intervention to erythrocyte rheology in diabetic retinopathy. The reported increased erythrocyte deformability in type 2 diabetic patients with retinopathy by Ginkgo biloba extract 761 [20] is an example of that trend, yet more literature data are required. As AGEs are irreversibly attached to macro-molecules and their levels do not decline when glucose levels are corrected, inhibition of AGE formation could be combined with agents that enhance erythrocyte flexibility and improve blood rheology. Prevention of diabetic retinopathy could therefore be directed onto the inhibition of erythrocyte membrane protein glycosylation, the en-hancement of erythrocyte deformability, and the reduction of erythrocyte aggregation.
In conclusion, structural alterations of the erythrocyte membrane proteins, which probably derive from oxida-tion and nonenzymatic glycosylaoxida-tion of those proteins in chronic diabetes and which can affect the erythrocyte rheology, may be associated with the development of microvascular complications of diabetes, in particular diabetic retinopathy. A lot of such protein alterations are shown exclusively in association with diabetic retinopathy in the present study. Their detection may serve as a blood marker for the development of diabetic microangiopathy or as a sign of increased risk to develop diabetic microangiopathy. Further studies are needed to assess whether pharmaceutical intervention to the rheol-ogy of erythrocytes can prevent or alleviate microvascu-lar diabetic complications.
Acknowledgements This study was supported by the General
Secretariat of Research and Technology, Ministry of Development, Greece (PENED/1999 program no. 5060 to I.S. Papassideri). The authors thank Alexandros N. Stangos, MD, for a constructive reading of the manuscript and useful suggestions.
References
1. Adewoye EO, Akinlade KS, Olorunsogo OO (2001) Erythrocyte
membrane protein alteration in diabetics. East Afr Med J 78:438–
440
2. Advani R, Sorenson S, Shinar E, Lande W, Rachmilewitz E, Schrier SL (1992) Characterization and comparison of the red blood cell membrane damage in severe human alpha- and
beta-thalassemia. Blood 79:1058–1063
3. Antonelou MH, Papassideri IS, Karababa FJ, Stravopodis DJ, Loutradi A, Margaritis LH (2003) Defective organization of the erythroid cell membrane in a novel case of congenital anemia.
Blood Cells Mol Dis 30:43–54
4. Baba Y, Kai M, Setoyama S, Otsuji S (1978) The lower levels of erythrocyte surface electric charge in diabetes mellitus. Clin Chim Acta 84:247–249
5. Babu N, Singh M (2004) Influence of hyperglycemia on aggregation, deformability and shape parameters of erythrocytes. Clin Hemorheol Microcirc 31:273–280
6. Brown CD, Zhao ZH, De Alvaro F, Chan S, Friedman EA (1993) Correction of erythrocyte deformability defect in ALX-induced diabetic rabbits after treatment with aminoguanidine. Diabetes
42:590–593
7. Brownlee M, Cerami A, Vlassara H (1988) Advanced glycosyl-ation end products in tissue and the biochemical basis of diabetic
complications. N Engl J Med 318:1315–1321
8. Delaunay J (1998) Disorders of the red cell membrane. In: Lameson JL (ed) Principles of molecular medicine. Humana
Press, Totowa, pp 191–195
9. Diabetes Control and Complications Trial Research Group (1995) Progression of retinopathy with intensive versus conventional treatment in the diabetes control and complications trial. Ophthalmology 102:647–661
10. Dodge JT, Mitchell C, Hanathan DJ (1963) The preparation and chemical characteristics of hemoglobin-free ghosts of human erythrocytes. Arch Biochem Biophys 100:119–130
11. Ernst E, Matrai A (1986) Altered red and white blood cell
rheology in type II diabetes. Diabetes 35:1412–1415
12. Early Treatment Diabetic Retinopathy Study Research Group (1991) Grading diabetic retinopathy from stereoscopic color fundus photographs - an extension of the modified Airlie House
classification. ETDRS report number 10. Ophthalmology 98:786–
806
13. Fairbanks G, Steck TL, Wallach DFH (1971) Electrophoretic analysis of the major polypeptides of the human erythrocyte
membrane. Biochemistry 10:2606–2617
14. Frank RN (2004) Diabetic retinopathy. N Engl J Med 350:48–58
15. Fukuda MN (1999) HEMPAS. Hereditary erythroblastic multi-nuclearity with positive acidified serum lysis test. Biochim
Biophys Acta 1455:231–239
16. Gaczynska M, Judkiewicz L, Szosland K (1993) Abnormal degradation of red cell membrane proteins in diabetes. Cytobios 75:7–11
17. Goldstein M, Leibovitch I, Levin S, Alster Y, Loewenstein A, Malkin G, Korenstein R (2004) Red blood cell membrane mechanical fluctuations in non-proliferative and proliferative diabetic retinopathy. Graefes Arch Clin Exp Ophthalmol
242:937–943
18. Harik SI, Behmand RA, Arafah BM (1991) Chronic hyperglyce-mia increases the density of glucose transporters in human
erythrocyte membranes. J Clin Endocrinol Metab 72:814–818
19. Hoare EM, Barnes AJ, Dormandy JA (1976) Abnormal blood
viscosity in diabetes mellitus and retinopathy. Biorheology 13:21–25
20. Huang SY, Jeng C, Kao SC, Yu JJ, Liu DZ (2004) Improved haemorrheological properties by Ginkgo biloba extract (Egb 761)
in type 2 diabetes mellitus complicated with retinopathy. Clin Nutr
23:615–621
21. Jollow DJ, McMillan DC (2001) Oxidative stress, glucose-6-phosphate dehydrogenase and the red cell. Adv Exp Med Biol
500:595–605
22. Jones GL (1984) Red cell membrane proteins in insulin-dependent diabetes: differential effects of treatment with calcium and various
proteases. Biochem Med 32:398–403
23. Joussen AM, Fauser S, Krohne TU, Lemmen KD, Lang GE, Kirchhof B (2003) Diabetische Retinopathie. Pathophysiologie und Therapie einer hypoxieinduzierten Entzündung. Ophthalmologe
100:363–370
24. Kay MM (1991) Band 3 in aging and neurological disease. Ann N Y Acad Sci 621:179–204
25. Kaymaz AA, Tamer S, Albeniz I, Cefle K, Palanduz S, Ozturk S, Salmayenli N (2005) Alterations in rheological properties and erythrocyte membrane proteins in cats with diabetes mellitus. Clin
Hemorheol Microcirc 33:81–88
26. Kirstein M, Brett J, Dadoff S, Ogawa S, Stern D, Vlassara H (1990) Advanced protein glycosylation induces transendothelial human monocyte chemotaxis and secretion of platelet-derived growth factor: role in vascular disease of diabetes and aging. Proc
Natl Acad Sci USA 87:9010–9014
27. Laemmli UK (1970) Cleavage of structural proteins during the
assembly of the head of bacteriophage T4. Nature 227:680–685
28. Mazzanti L, Faloia E, Rabini RA, Staffolani R, Kantar A, Fiorini R, Swoboda B, De Pirro R, Bertoli E (1992) Diabetes mellitus induces red blood cell plasma membrane alterations possibly
affecting the aging process. Clin Biochem 25:41–46
29. McMillan DC, Powell CL, Bowman ZS, Morrow JD, Jollow DJ (2005) Lipids versus proteins as major targets of pro-oxidant, direct-acting hemolytic agents. Toxicol Sci 88:274–283
30. McMillan DE, Utterback NG, La Puma J (1978) Reduced erythrocyte deformability in diabetes. Diabetes 27:895–901 31. Miller JA, Gravallese E, Bunn HF (1980) Nonenzymatic
glycosylation of erythrocyte membrane proteins. Relevance to
diabetes. J Clin Invest 65:896–901
32. Palek J, Liu SC, Snyder LM (1978) Metabolic dependence of protein arrangement in human erythrocyte membranes. I. Analysis of spectrin-rich complexes in ATP-depleted red cells. Blood
51:385–395
33. Patz A, Smith RE (1991) The ETDRS and Diabetes 2000.
Ophthalmology 98:739–740
34. Raz I, Havivi Y, Yarom R (1998) Reduced negative surface charge
on arterial endothelium of diabetic rats. Diabetologia 31:618–620
35. Rettig MP, Low PS, Gimm JA, Mohandas N, Wang J, Christian JA (1999) Evaluation of biochemical changes during in vivo
erythrocyte senescence in the dog. Blood 93:376–384
36. Rogers ME, Williams DT, Niththyananthan R, Rampling MW, Heslop KE, Johnston DG (1992) Decrease in erythrocyte glycophorin sialic acid content is associated with increased
erythrocyte aggregation in human diabetes. Clin Sci 82:309–313
37. Rolo AP, Palmeira CM (2006) Diabetes and mitochondrial function: role of hyperglycemia and oxidative stress. Toxicol Appl Pharmacol 212:167–178
38. Schwartz RS, Madsen JW, Rybicki AC, Nagel RL (1991) Oxidation of spectrin and deformability defects in diabetic
erythrocytes. Diabetes 40:701–708
39. Snyder LM, Fortier NL, Trainor J, Jacobs J, Leb L, Lubin B, Chiu D, Shohet S, Mohandas N (1985) Effect of hydrogen peroxide exposure on normal human erythrocyte deformability, morpholo-gy, surface characteristics, and spectrin-hemoglobin cross-linking.
J Clin Invest 76:1971–1977
40. Snyder LM, Leb L, Piotrowski J, Sauberman N, Liu SC, Fortier NL (1983) Irreversible spectrin-haemoglobin crosslinking in vivo:
41. Song H, Wang L, Hui Y (2006) Expression of CD18 on the neutrophils of patients with diabetic retinopathy. Graefes Arch
Clin Exp Ophthalmol. DOI10.1007/s00417-006-0379-2
42. Straface E, Rivabene R, Masella R, Santulli M, Paganelli R, Malorni W (2002) Structural changes of the erythrocyte as a marker of non-insulin-dependent diabetes: protective effects of N-acetylcysteine. Biochem Biophys Res Commun 290:1393–1398 43. Vekasi J, Marton ZS, Kesmarky G, Cser A, Russai R, Horvath B
(2001) Hemorheological alterations in patients with diabetic
retinopathy. Clin Hemorheol Microcirc 24:59–64
44. Vlassara H, Valinsky J, Brownlee M, Cerami C, Nishimoto S, Cerami A (1987) Advanced glycosylation endproducts on erythrocyte cell surface induce receptor-mediated phagocytosis by macrophages. A model for turnover of aging cells. J Exp Med
166:539–549
45. Watala C, Witas H, Olszowska L, Piasecki W (1992) The association between erythrocyte internal viscosity, protein
non-enzymatic glycosylation and erythrocyte membrane dynamic
properties in juvenile diabetes mellitus. Int J Exp Pathol 73:655–
663
46. Wautier MP, Boulanger E, Guillausseau PJ, Massin P, Wautier JL (2004) AGEs, macrophage colony stimulating factor and vascular adhesion molecule blood levels are increased in patients with diabetic microangiopathy. Thromb Haemost 91:879–885 47. Yamaguchi M, Nakamura N, Nakano K, Kitagawa Y, Shigeta H,
Hasegawa G, Ienaga K, Nakamura K, Nakazawa Y, Fukui I, Obayashi H, Kondo M (1998) Immunochemical quantification of crossline as a fluorescent advanced glycation endproduct in erythrocyte membrane proteins from diabetic patients with or
without retinopathy. Diabet Med 15:458–462
48. Yamamoto T, Kamei M, Yokoi N, Yasuhara T, Tei M, Kinoshita S (2005) Platelet aggregates in various stages of diabetic retinopa-thy: evaluation using the particle-counting light-scattering
![Table 2 Severity levels of diabetic retinopathy (based on the Abbreviated Summary of the ETDRS Final Scale of Diabetic Retinopathy Severity for Individual Eyes [7])](https://thumb-eu.123doks.com/thumbv2/123doknet/14835325.621901/3.892.74.436.724.1067/severity-diabetic-retinopathy-abbreviated-diabetic-retinopathy-severity-individual.webp)