Review ARticle
Received: 22 October 2013 / Accepted: 3 January 2014 / Published online: 15 January 2014 © Springer-Verlag Berlin Heidelberg 2014
Neuroimaging of Epilepsy: Lesions, Networks, Oscillations
E. Abela · C. Rummel · M. Hauf · C. Weisstanner ·K. Schindler · R. Wiest
may help to better understand a range of clinical phenom-ena such as the type of cognitive impairment, the develop-ment of pharmacoresistance, the propagation pathways of seizures, or the success of epilepsy surgery.
Keywords Epilepsy · Networks · Functional neuroimaging Introduction
Epilepsy, one of the most prevalent neurological conditions [1], can be conceptually defined as the (pathological) pro-pensity of the brain to generate seizures, i.e., clinical and electroencephalographic manifestations of paroxysmal neuronal activity [2]. The global burden of disease and the socioeconomic costs afforded by epilepsy are substantial [1, 3], and its consequences on cognitive, psychological, and social functioning of those who are affected are often devastating [4–6]. However, diagnosis and management of epilepsy have been refined considerably over the past two decades, and clinical structural and functional magnetic res-onance imaging (MRI) made important contributions to this development [7]. Novel imaging techniques and the increas-ing availability of high-field MRI, together with the imple-mentation of dedicated epilepsy protocols according to the guidelines of the International league against epilepsy, have improved the sensitivity of structural MRI, even for subtle abnormalities [8]. Overall, the largest consecutive analysis investigating 2,000 patients referred to MRI after a seizure reported abnormalities related to epilepsy in roughly 20 % of the cases [9]. In patients with refractory epilepsy, structural lesions can be depicted in up to 82–86 % of imaging stud-ies by visual inspection [10, 11]. Alternative quantitative postprocessing methods that incorporate different features of high-resolution datasets to integrate abnormalities of
cor-Abstract While analysis and interpretation of structural
epileptogenic lesion is an essential task for the neuroradi-ologist in clinical practice, a substantial body of epilepsy research has shown that focal lesions influence brain ar-eas beyond the epileptogenic lesion, across ensembles of functionally and anatomically connected brain areas. In this review article, we aim to provide an overview about altered network compositions in epilepsy, as measured with current advanced neuroimaging techniques to char-acterize the initiation and spread of epileptic activity in the brain with multimodal noninvasive imaging techniques. We focus on resting-state functional magnetic resonance imaging (MRI) and simultaneous electroencephalography/ fMRI, and oppose the findings in idiopathic generalized versus focal epilepsies. These data indicate that circum-scribed epileptogenic lesions can have extended effects on many brain systems. Although epileptic seizures may in-volve various brain areas, seizure activity does not spread diffusely throughout the brain but propagates along spe-cific anatomic pathways that characterize the underlying epilepsy syndrome. Such a functionally oriented approach
E. Abela, MD () · C. Rummel · M. Hauf · C. Weisstanner · R. Wiest
Support Center for Advanced Neuroimaging (SCAN), University Institute of Diagnostic and Interventional Neuroradiology, Inselspital, University Hospital Bern, University of Bern, Freiburgstrasse 4, 3010 Bern, Switzerland
e-mail: [email protected] E. Abela, MD · K. Schindler
Department of Neurology, Inselspital, University Hospital Bern, University of Bern, Bern, Switzerland
M. Hauf
tical thickness, blurring, and tissue intensity into a single composite map further enhance the sensitivity of structural MRI relative to conventional visual interpretation [12–14].
While lesion analysis and interpretation is the essential task for the neuroradiologist in clinical practice, a substan-tial body of epilepsy research has shown that focal lesions influence brain areas beyond the epileptogenic lesion, across ensembles of functionally and anatomically connected brain areas [15, 16]. This has led to the hypothesis that epilepsy represents fundamentally a disease of neural networks, and that the principal task of the epileptologist should be to indentify and therapeutically modulate the core network components that generate seizures and support epilepsy, especially in pharmacoresistant cases [17]. Also, it has been argued that understanding the alterations in network struc-ture and dynamics could improve diagnostic classification and identify new biomarkers and potential targets for ther-apy [16, 18].
In this review, we present current research on neural net-works in epilepsy, gained through resting-state functional MRI (fMRI) and simultaneous electroencephalography(EEG)/ fMRI. We aim to show how these advanced imaging methods, beyond structural applications, can provide new insights into the neurobiology of epilepsy.
The Network Concept in Epilepsy
From a theoretical perspective, a network consists basically of two elements: discrete units, called “nodes,” linked by a set of connections, or “edges” [19]. Nodes and edges can be defined across different spatial scales, e.g., neurons and axons on the smallest relevant scale or brain areas and white matter tracts on the largest scale, thus providing a concep-tual framework to analyze any network in the micro- to the macroscopic domain [20]. If the connections are physical entities, for instance interconnecting white matter tracts as measured by diffusion tensor and diffusion spectrum imag-ing, it constitutes a network based on structural
connectiv-ity. However, edges do not need to be structural (physical)
connections, but can also be functional associations, i.e., the linear or nonlinear interrelation between the temporal evo-lution of activity at different nodes. Such functional
connec-tivity networks indicate, e.g., whether a set of homologous
brain areas across both hemispheres show correlated activ-ity measured as oscillations during rest or when engaged in a perceptual task. Finally, effective connectivity quantifies the influence of one node on the other [21]. This quantifica-tion can be either performed with direct electrical record-ings in cellular neural networks, or inferred indirectly from time-series data, using complex biophysical models or algo-rithms derived from statistical physics [22, 23].
These different types of connectivity can be analyzed with neuroimaging methods (mentioned later in the text). For functional networks, multivariate methods such as inde-pendent component analysis (ICA) can be applied, using algorithms that detect spatiotemporal patterns from fMRI time-series data [24]. ICA is for the most part user inde-pendent (although choices on preprocessing steps and algo-rithms influence results) and has been, therefore, often used for the discovery of novel functional networks, especially in situations with weak experimental control or when no a priori hypotheses on network topography and/or activ-ity exist. Examples of this include complex naturalistic fMRI tasks such as simulated driving [25, 26], or resting-state fMRI sessions in patients with brain damage [27–30]. Moreover, ICA is also a useful technique to filter out arti-ficial patterns of structured noise in fMRI time series [31]. Another popular approach consists in defining the nodes (or “seeds”) of the network a priori, extract the time series of activity from each node, and compute a matrix of interrela-tions, e.g., using linear or nonlinear measures [32, 33]. Units of parcellations for these matrices can be as small as a voxel [34], or encompass any number of (heuristically defined) macroscopical areas [35]; thus, the spatial resolution of the network is not only limited by the imaging sequence but also by the hypothesis of the researcher and the chosen scale of observation. However, both data-driven and hypothesis-driven functional connectivity networks are similar across studies, indicating that they indeed represent a neurobiolog-cally meaningful construct and not merely an artifact of methodical choices [32].
Functional networks can be characterized by a host of different mathematical measures derived from graph theory; see, e.g., [36] for a nontechnical review. Of special impor-tance are those measures that describe integration versus segregation of function within the network, as the brain is fundamentally organized in locally specialized (segre-gated), but globally connected (integrated), functional mod-ules [37, 38]. An example of an integration measure is the
global efficiency [39], a metric that quantifies the ability of a functional network to transmit information. The global efficiency is the inverse of the average path length in a net-work; the average path length is the mean distance between all nodes [36]. A shorter between-node distance implies that information could be transmitted in a faster, more reliable way from node to node, thus increasing the efficiency of the network. In contrast, an example of a local segregation metric is the clustering coefficient, which indicates the prev-alence of connected clusters in the neighborhood of an indi-vidual node [40]. A high average clustering coefficient of a node indicates that it takes part in a densely interconnected (highly clustered) neighborhood that is segregated from the rest of the network. As a consequence, locally integrated network neighborhoods might be represented by different
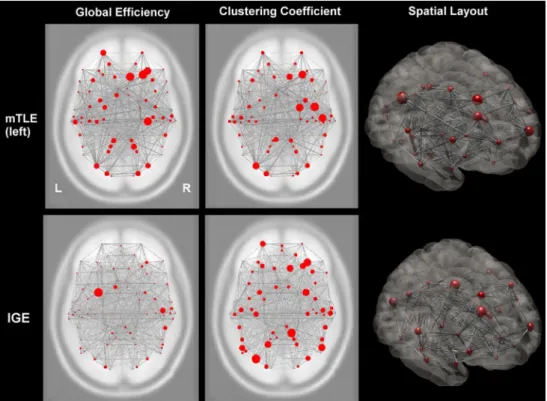
(BOLD) contrast. During a resting-state fMRI experiment, a subject lies in the scanner with eyes closed without fall-ing asleep nor performfall-ing any specific task for a short time, usually 6–20 min ([42], p. 662). In this setting, functional networks are known to show synchronized low-frequency fluctuations (typically < 0.1 Hz). Covariance analysis of these fluctuations, either by ICA or seed-based correlations from neuroanatomically defined regions of interest, deter-mines areas of the brain that form functionally connected cortico-subcortical networks, which can then be character-ized with the network measures mentioned earlier in the text [43, 31]. In Fig. 1, we provide an example of such a network characterization from two small groups of patients (both
n = 5) with idiopathic generalized epilepsy (IGE) and mesial
temporal lobe epilepsy (MTLE) with left-sided hippocam-pal sclerosis. In both patient groups, resting-state fMRI was acquired for 15 min with T2*-weighted EPI sequences using the BOLD contrast at 3 T. BOLD time series were pre-processed as previously described, including motion correc-tion, band-pass filtering, and elimination of physiological confounds [31] using the freely available software SPM8 neuroanatomical subsytems in the brain, e.g., motor, visual,
or attentional networks. If a network is locally highly clus-tered, but distant nodes can still be reached via a small set of long-range connections, it is called a “small-world” net-work, in analogy to the sociological phenomenon that indi-viduals in a population form close peer groups (clusters) but are still interconnected via a small set of distant acquain-tances (connections) [40]. In such a small-world network, local integration is high, while the overall integrity of the network is also maintained, a configuration that seems to be optimal for biological networks like the brain [41].
Resting-State fMRI and Combined EEG/fMRI
One of the simplest ways to record functional connectiv-ity networks, which is comparably easy to implement in clinical routine and imposes minimal requirements on neu-rological patients and MR personnel, is the acquisition of so-called resting-state fMRI runs of echo-planar imaging (EPI) sequences using the blood-oxygen level-dependent
Fig. 1 Cortical functional networks in focal and generalized epilepsy
syndromes. This image shows two (qualitative) applied examples of global integration and local segregation measures to cortical func-tional networks in mesial temporal lobe epilepsy (upper row, MTLE, n = 5) and idiopathic generalized epilepsy (lower row, IGE, n = 5). Red circles indicate anatomical regions (nodes); gray lines indicate the strength of interregional functional correlations (connections). The first column shows the global efficiency, which is markedly reduced over the diseased left hemisphere in MTLE and bilaterally reduced in
IGE, indicating syndrome-specific effects in the ability of the cortical network to transfer information. The second column shows the cluster-ing coefficient. Clustercluster-ing is reduced over the diseased hemisphere in MTLE, probably due to a loss of local functional modules. In contrast, clustering is more symmetrically distributed in IGE, suggesting that the network is fragmented in different regions. The third column illus-trates the three-dimensional spatial layout of the network. Images are in neurological convention (L left, R right)
tive workup of pediatric and adult patients suffering from pharmacoresistant epilepsies [53, 54]. Here, the focus is on localization of the seizure-onset zone, and combined EEG-fMRI has proven especially valuable when no epileptogenic lesion can be identified by structural MRI using dedicated epilepsy protocols [55], or if multifocal generators are sus-pected [56].
Networks Aspects of Idiopathic Generalized Epilepsies
IGEs comprise a group of heterogeneous syndromes in which a strong genetic component is suspected or already identified. These syndromes have been recently reclassified as “genetic epilepsies,” to avoid the ambiguous term “idio-pathic” [2]. We maintain the term IGE for consistency with the fMRI literature to date. IGEs are common and account for ~ 40 % of epilepsy diagnoses. Their hallmarks are gen-eralized spike-wave (GSW) discharges in the EEG, i.e., synchronous, mostly symmetric, bilateral paroxysmal, short (< 200 ms), high-amplitude potentials followed by a slow wave. They can occur in isolation, but classically appear in runs with frequencies of approximately 3–4 Hz [57]. Lon-ger series of GSW discharges impair consciousness for brief periods, leading to the clinical picture of absence seizures. The latter are further characterized by sudden behavioral arrest, unresponsiveness, staring, and sometimes mild oral automatisms and/or bilateral eye blinks, and are a hallmark of AE [58, 59].
GSW in IGE are likely generated within thalamo-corti-cal networks, although the relative contribution of cortithalamo-corti-cal and thalamic sources remains a matter of debate [60–62]. Simultaneous EEG and fMRI were first performed with the goal to map the thalamo-cortical networks associated with GSW, but the findings of these studies have shown that the network changes are far more extended than previously thought. One of the earliest simultaneous EEG-fMRI stud-ies by Archer et al. [63] investigated cortical and subcorti-cal patterns of BOLD signal changes in five patients (four of them suffering from childhood AE) with frequent GSW discharges during rest. Their main finding was a large area of GSW-related BOLD deactivation in the posterior cingu-late (retrosplenial cortex) that was highly consistent across patients, and more variable regions of BOLD activation in the angular gyrus and around the precentral sulcus bilater-ally [63]. Thalamic BOLD activations were only seen in two of five patients and were not significant at the group level, either because of intrinsic variability of the BOLD response in subcortical structures or because of low signal-to-noise ratio at low field strengths. Subsequent studies in adults and children with IGE have reliably indentified thalamic BOLD signal increases, and have also confirmed the high degree of interindividual variability in cortical and subcorti-(http://www.fil.ion.ucl.ac.uk/spm/software/spm8/). A set of
90 cortical regions defined in a publicly available atlas were used as network nodes [44], and node-to-node correlations were used to define the connections in the network. We used the functional connectivity toolbox for SPM8 (http://www. nitrc.org/projects/conn/) to calculate the global efficiency and clustering coefficient of this network in both epilepsy syndromes. Both network measures indicate striking differ-ences between syndromes: the IGE network shows a mark-edly reduced efficiency and increased fragmentation across both hemispheres, whereas in MTLE, only the diseased hemisphere seems to be affected. Here, however, network changes occur not only in the temporal lobe region, but also extend to fronto-parietal areas as well.
In contrast to resting-state fMRI, simultaneous EEG-fMRI makes use of the complementary strengths of a neu-rophysiological and neuroimaging technique, i.e., the high temporal resolution of EEG and the high spatial resolution of BOLD fMRI [45, 46]. EEG-fMRI is technically a much more demanding technique than resting-state fMRI, but has the great advantage of directly relating fMRI responses to epileptic phenomena [47–49]. Interictal discharges, which reflect the irritative zone on the EEG, are identified as intrinsic predictors to estimate the simultaneous hemody-namic responses linked to interictal epileptic discharges (IEDs). This identification is either performed by a spike-based evaluation of EEG-fMRI or by an ICA analysis of the simultaneous EEG, as recently suggested by our institu-tion [45, 50]. The prime justificainstitu-tion for applicainstitu-tion of tem-poral ICA-based techniques for EEG decomposition holds for artifact removal, which can be regarded statistically independent from neuronal activity [51]. In practice, this technique can also be applied to isolate a single or a small number of components (“factors”) containing epileptiform activity that coincides with IEDs, while the remainder does not. ICA separation on EEG recorded during MR scanning turned out insufficient but could be improved considerably after inclusion of EEG recorded outside the scanner [50]. In this way, not only single events but also the continuous dynamics of epileptiform activity can be recovered [52], and used to map the associated functional networks.
The clinical applications of combined EEG-fMRI in human epilepsy can be summarized in two categories. One concerns the investigation of BOLD correlates of epi-leptiform EEG signals in clinically well-defined epilepsy syndromes such as absence epilepsy (AE) or MTLE with hippocampal sclerosis. The aim of this line of investigation is not only to achieve a more complete syndrome descrip-tion, but also to unravel pathophysiological mechanisms that could lead to a deeper understanding of epileptogenesis and perhaps even to a more refined, evidence-based clas-sification of the epilepsies [2]. The second application is the localization of the epileptogenic zone during the
preopera-steps from 6 s before (− 6) to 6 s after (+ 6) the epileptiform activity (for a detailed description of this method, see, e.g., [72]). Early activations of cortico-subcortical networks (hot
colors) and extended late deactivations of the DMN can be
seen in both patients, which might account for the atten-tional deficits often seen in this patient group during IED.
Beyond thalamus and DMN, there is also recent evi-dence showing that GSWs affect a wider range of func-tional networks. Masterton et al. [77] have shown that also the bilateral cortical sensorimotor network (SMN) and the anterior insular network show activity changes associated with GSW. Finally, a very recent study by Zang et al. using resting-state fMRI has found that not only the aforemen-tioned networks but also regions of cognitive and affective networks show altered patterns of functional connectivity compared with healthy controls, especially in those patients with ongoing GSW.
Network Aspects of Temporal Lobe Epilepsies
In healthy individuals, more than 20 independent networks have been identified that correspond to intrinsic and extrin-sic systems, and are associated with internal- and external-oriented processing, respectively [78]. Their interaction, either between modular sensory regions to parallel-orga-nized heteromodal processing systems or the integration between high-cognitive functional networks, is still not fully explored. There is now evidence that temporo-parietal cor-tices subserve as pace areas to maintain control, the default mode, and ventral attention networks [79]. The dorsal pre-cuneus is connected to “task-positive” areas within the cognitive control network, while the ventral precuneus has stronger connections to the medial temporal lobe structures, including the hippocampus. The latter may have implica-tions on seizure propagation in focal epilepsies, especially in the temporal lobe.
cal BOLD patterns [64–67]. The set of symmetrical regions that has been found to be commonly deactivated during GSW in IGE, i.e., precuneus, inferior parietal cortex, and ventral medial prefrontal cortex, are core nodes in the now widely known default-mode network (DMN). The DMN comprises a network that is highly active and functionally strongly interconnected during conscious rest [68, 42], and probably supports attentional and self-referential processes such as autobiographical memory or envisioning the future [69, 70]. Although the role of this GSW-related BOLD sig-nal changes within the DMN is still poorly understood, it is notable that deviations of DMN activity are commonly seen in neurological disorders, e.g., Alzheimer’s disease or traumatic brain injury [69, 71].
Interestingly, recent EEG-fMRI studies have shown that activity fluctuations in the DMN and thalamus can precede EEG and behavioral changes for several seconds. The DMN, together with prefrontal regions, shows BOLD increases between 6 and 14 s before GSW, followed by a strong decrease during GSW that persists 7–20 s afterward [72, 73]. The BOLD signal in the thalamus follows a dif-ferent time course, with a strong increase at GSW onset (not before) that only lasts for 3 s. Of note, interindividual variability in pre- and peri-GSW network fluctuations is high, with some cases showing either very early or very late decreases in the DMN, either short or prolonged increases in the thalamus, and different degree of overlap between acti-vated and deactiacti-vated areas [73]. A recent study using effec-tive connectivity modeling has found that the precuneus might have a gating or facilitatory influence on the thala-mus and thus potentially on GSW generation [74]. In Fig. 2, we provide two examples of the dynamics of IED-related BOLD oscillatory activity in patients with IGE. Both were acquired with a dedicated EEG-fMRI setup at our institu-tion as previously described [75, 76]. The BOLD response was analyzed by first defining the onset of IED in the EEG and then shifting the hemodynamic response function in 1-s
Fig. 2 Network dynamics in idiopathic generalized epilepsies. This
image illustrates the temporal dynamics of networks correlated with interictal epileptiform discharges (IED) in two patients with idiopathic generalized epilepsies (IGE). Zero indicates IED onset; all other num-bers indicate seconds before (−) or after (+) the discharge. Note the
deactivation of the anterior cingulate cortex and the precuneus at time point zero in both patients, the small thalamic activation in the first patient (upper row), and the large pre-IED default mode activation in the second patient (lower row). Images courtesy of Dr. med. O. Schei-degger, Department of Neurology, Inselspital, Bern
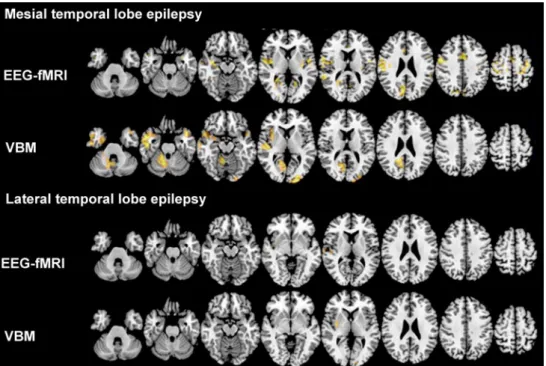
focal epilepsies. Preliminary observations of our own group revealed gray matter loss in the insula, closely related to the piriform cortex in a group of patients with neocortical struc-tural lesions (unpublished data). Our group has furthermore examined the spatial relationship between widespread corti-cal atrophy and functionally connected networks linked to IED, using simultaneous EEG-fMRI in a cohort of patients suffering from MTLE [89]. We detected hemodynamic cor-relates to interictal epileptiform discharges beyond the sei-zure-onset zone in the ipsilateral insula, the temporal pole, and temporo-lateral neocortex; in the cerebellum; along the central sulcus; and bilaterally in the cingulate gyrus. We then used voxel-based morphometry, an objective measure of gray matter structure, to identify the structural network changes associated with IED [89, 90]. Widespread reduc-tions in gray matter volume were detected in the middle and inferior temporal gyrus, the uncus to the hippocampus, the insula, the posterior cingulate, and the anterior lobe of the cerebellum. Our findings indicate a close relationship between gray matter loss and large-scale epileptic activity in MTLE. These networks encompass also the propagation pathways during seizures, as confirmed in a cohort of differ-ent patidiffer-ents with MTLE [91]. These results are illustrated in Fig. 3 and contrasted against results of an identical analysis While graph-theoretical analyses of structural and
func-tional networks reveal a small-world organization of the cerebral cortex in healthy individuals [80], global network organization of patients reveals increased path length in temporal lobe epilepsy (TLE) [81]. Several authors dem-onstrated altered connectivity in patients with MTLE. As a key finding, they reported increased connections within the mesial temporal lobe (higher clustering) and decreased connectivity (longer path length) along extratemporal areas, including contralateral temporal regions [82–84]. Oth-ers suggested altered bitemporal connectivity patterns in patients with MTLE [85]. These findings suggest a delete-rious impact of the epileptic lesion and the epileptogenic zone on the whole brain, potentially impacting multiple cerebral networks [86]. In contrast to TLE, only a few stud-ies addressed functional networks associated with epilepsy syndromes with the seizure-onset zone outside the temporal lobe. One recent study compared patients with TLE versus those with frontal (FLE) and occipital lobe epilepsies [87]. The authors found that all syndromes share the deactivation of the DMN during interictal spikes, and that both FLE and TLE share an activation in the anterior insula/piriform cor-tex. This region has been also indentified by Laufs et al. [88] as a common node of the functional network associated with
Fig. 3 Functional and structural networks in focal epilepsies. This
image illustrates the concordance between functional interictal epi-leptic discharge (IED)-related networks derived from simultaneous electroencephalography and functional magnetic resonance imaging (EEG-fMRI) and structural networks from voxel-based morphom-etry (VBM) in patients with mesial temporal lobe epilepsy (MTLE; n = 10) versus lateral temporal lobe epilepsy (LTLE; n = 10). All af-fected hemispheres are on the left side. Color maps indicate t-values of
significant correlation with IED (EEG-fMRI) or significant gray matter volume reduction (VBM). Threshold for significance was set to t > 3.1. Despite being classified as a focal disease, widespread gray matter vol-ume reductions can be seen in MTLE (upper panel), which overlap with the blood-oxygen level-dependent correlates to IED. This is not the case in LTLE, probably due to the heterogeneity of this syndrome. Images are in neurological convention
of analysis can be used in day-to-day clinical work. While the acquisition of resting-state fMRI data is very simple and robust, any functional connectivity measures derived from such datasets are very susceptible to motion-induced artefacts. Recent studies have shown that systematic func-tional correlations can be induced through subject motion, leading to spurious network characteristics [98]. Appropri-ate measures to reduce the impact of motion artifacts and dedicated quality control is therefore of paramount impor-tance, but there is not yet a consensus on which methods to use [99, 100]. Also, physiological noise, i.e., respiration and pulse-related artifacts, must be accounted for, either by direct measurement [101, 102] or by using signals from the cerebrospinal fluid and white matter [103]. Finally, when “cleaning” and filtering resting-state fMRI data from the confounds mentioned earlier in the text, the order of pro-cessing steps must be taken into careful consideration, as noise might be reintroduced, rather than eliminated [104].
Another critical issue for clinical applications is the reliability of functional network measures and adequate benchmarks against which results of individual patient can be compared. Large-scale validation studies in healthy controls have already been undertaken, and public control fMRI databases have been set up (e.g., the “1000 Func-tional Connectomes Project,” http://www.nitrc.org/projects/ fcon_1000/); thus, normative data are, in principle, already available. Also, there is already broad experience in the use of functional networks with other neurological diseases, in particular Alzheimer’s disease, which indicates in general a good agreement between data acquired at multiple sites. However, scanner-to-scanner variability can be substantial, and there are no acquisition standards. Finally, all studies mentioned earlier in the text have used rather small sample sizes (typically < 30 patients with epilepsy), which lim-its their generalizability. Coordinated multisite efforts are probably needed to resolve these issues.
Conclusions
We have shown, based on current evidence and on a number of illustrative examples from our current work, that neuro-imaging has rapidly become a pivotal tool in the assessment of macroscopical network structure, function, and dynam-ics in epilepsy. Simultaneous EEG-fMRI is unique in this respect, as it can extract information on network topogra-phy and dynamics by using information from both modali-ties. Furthermore, recent EEG-fMRI studies have provided increasing evidence that both focal and generalized inter-ictal epileptiform discharges are correlated with functional activation and deactivation in specific large-scale networks that span a number of cortical and subcortical nodes [16]. These data indicate that circumscribed epileptogenic lesions in patients suffering from lateral TLE (LTLE). There are far
less commonalities between functional and strucutral net-works in LTLE, possibly owing to the heterogeneity of the LTLE syndrome, and also to differences in disease duration, antiseizure medication, and IED frequency, which have not been taken into account in this analysis.
Several studies that investigated alterations of gray mat-ter volume and concentrations using MRI-based automated analysis techniques such as voxel-based morphometry and cortical thickness analysis on a whole-brain level have shown that structural changes in MTLE patients are not restricted to the hippocampus or the elements of the mesial temporal lobe [92], but show widespread abnormalities that extend into the temporal pole, temporolimbic and fronto-central regions [93, 94], and the cerebellum and the thala-mus [95] and longitudinal increases in volume loss [96]. Previous ictal connectivity studies in MTLE exhibited pat-terns of bilateral increases of cerebral blood flow (CBF) in the temporal lobes (predominantly the middle and superior temporal gyrus, including the temporal pole, the posterior temporal lobe, and the cerebellum) and decrease CBF in the inferior temporal gyrus, the inferior parietal lobe, and the posterior cingulate [91]. Of note, there is a tight spa-tial overlap between hemodynamic and atrophy effects along mesolimbic areas, but not in regions beyond the lim-bic network [15]. Clues from morphometric analyses and combined EEG-fMRI recordings implicate that the wide-spread structural damage linked to abnormal hemodynamic responses is suggestive of TLE being a system rather than a focal disorder leading to a disruption of structural networks. Of note, a recent study by Voets et al. [97] investigated the three-way relationship between functional network disrup-tion, white matter disconnecdisrup-tion, and gray matter atrophy in patients with TLE. They found that, compared with con-trols, patients showed altered (typically reduced) functional connectivity between the hippocampus, anterior temporal and precentral cortices, and the default mode and SMNs. Reduced network integration of the hippocampus was explained by variations in gray matter density, while func-tional connectivity of the parahippocampus, and frontal and temporal neocortices, showed atypical associations with white matter coherence within pathways carrying connec-tions of these regions. These studies again underscore the strength of the network concept to bridge not only spatial scales but also imaging modalities.
Translation to Clinical Applications: Methodical Challenges
Network analysis of functional neuroimaging data in epi-lepsy is a fast growing research area, but there are still many methodological issues that must be solved before this type
13. Besson P, Bernasconi N, Colliot O, Evans A, Bernasconi A. Surface-based texture and morphological analysis detects subtle cortical dysplasia. Med Image Comput Comput Assist Interv. 2008;11(Pt 1):645–52.
14. Wagner J, Weber B, Urbach H, Elger CE, Huppertz HJ. Mor-phometric MRI analysis improves detection of focal cortical dys-plasia type II. Brain. 2011;134(Pt 10):2844–54. doi:awr204 [pii] 10.1093/brain/awr204.
15. Engel J Jr, Thompson PM, Stern JM, Staba RJ, Bragin A, Mody I. Connectomics and epilepsy. Current Opin Neurol. 2013;26(2):186–94. doi:10.1097/WCO.0b013e32835ee5b8. 16. Richardson MP. Large scale brain models of epilepsy:
dy-namics meets connectomics. J Neurol Neurosurg Psychiatry. 2012;83(12):1238–48. doi:jnnp-2011-301944 [pii] 10.1136/ jnnp-2011-301944.
17. Spencer SS. Neural networks in human epilepsy: evidence of and implications for treatment. Epilepsia. 2002;43(3):219–27. 18. Engel J Jr, Pitkanen A, Loeb JA, Dudek FE, Bertram EH 3rd,
Cole AJ, et al. Epilepsy biomarkers. Epilepsia. 2013;54(Suppl 4):61–9. doi:10.1111/epi.12299.
19. Sporns O. From simple graphs to the connectome: networks in neuroimaging. NeuroImage. 2012;62(2):881–6. doi:S1053-8119(11)01017-2 [pii] 10.1016/j.neuroimage.2011.08.085. 20. Bullmore E, Sporns O. Complex brain networks: graph
theo-retical analysis of structural and functional systems. Nature Rev Neurosci. 2009;10(3):186–98. doi:nrn2575 [pii] 10.1038/ nrn2575.
21. Friston KJ. Functional and effective connectivity: a review. Brain Connect. 2011;1(1):13–36. doi:10.1089/brain.2011.0008. 22. Friston KJ, Harrison L, Penny W. Dynamic causal modelling.
NeuroImage. 2003;19(4):1273–302.
23. Valdes-Sosa PA, Roebroeck A, Daunizeau J, Friston K. Ef-fective connectivity: influence, causality and biophysical modeling. NeuroImage. 2011;58(2):339–61. doi:10.1016/j. neuroimage.2011.03.058.
24. Calhoun VD, Liu J, Adali T. A review of group ICA for fMRI data and ICA for joint inference of imaging, genetic, and ERP data. NeuroImage. 2009;45(1 Suppl):S163–72. doi:10.1016/j. neuroimage.2008.10.057.
25. Calhoun VD, Pekar JJ, McGinty VB, Adali T, Watson TD, Pearl-son GD. Different activation dynamics in multiple neural systems during simulated driving. Hum Brain Mapp. 2002;16(3):158–67. doi:10.1002/hbm.10032.
26. Rzepecki-Smith CI, Meda SA, Calhoun VD, Stevens MC, Jafri MJ, Astur RS, et al. Disruptions in functional net-work connectivity during alcohol intoxicated driving. Alco-hol Clin Exp Res. 2010;34(3):479–87. doi:ACER1112 [pii] 10.1111/j.1530-0277.2009.01112.x.
27. Carter AR, Astafiev SV, Lang CE, Connor LT, Rengachary J, Str-ube MJ, et al. Resting interhemispheric functional magnetic reso-nance imaging connectivity predicts performance after stroke. Ann Neurol. 2010;67(3):365–75. doi:10.1002/ana.21905. 28. Sours C, Zhuo J, Janowich J, Aarabi B, Shanmuganathan K,
Gullapalli RP. Default mode network interference in mild traumatic brain injury—a pilot resting state study. Brain Res. 2013;1537:201–15. doi:S0006-8993(13)01171-2 [pii] 10.1016/j. brainres.2013.08.034.
29. Zhou Y, Milham MP, Lui YW, Miles L, Reaume J, Sodickson DK, et al. Default-mode network disruption in mild traumatic brain injury. Radiology. 2012;265(3):882–92. doi:265/3/882 [pii] 10.1148/radiol.12120748.
30. Sandrone S, Bacigaluppi M. Learning from default mode net-work: the predictive value of resting state in traumatic brain inju-ry. J Neurosci. 2012;32(6):1915–7. doi:32/6/1915 [pii] 10.1523/ JNEUROSCI.5637-11.2012.
can have extended effects on many brain systems. This might help to explain a range of clinical phenomena such as the type of cognitive impairment, the development of pharmacoresistance, the propagation pathways of seizures, or the effect of resective operations [7, 105]. Thus, better understanding of altered network characteristics in epilepsy may pave a novel way for the development of biomarkers for many aspects of epilepsy and its pathophysiology [18]. Further work is needed to integrate network aspects into clinical algorithms from which patients can benefit directly.
Conflict of Interest None.
References
1. Bell GS, Sander JW. The epidemiology of epilepsy: the size of the problem. Seizure. 2002;11(Suppl A):306–14. (Quiz 15–6). 2. Berg AT, Berkovic SF, Brodie MJ, Buchhalter J, Cross JH, van
Emde Boas W, et al. Revised terminology and concepts for orga-nization of seizures and epilepsies: report of the ILAE Commis-sion on Classification and Terminology, 2005–2009. Epilepsia. 2010;51(4):676–85. doi:10.1111/j.1528-1167.2010.02522.x. 3. Begley CE, Famulari M, Annegers JF, Lairson DR, Reynolds TF,
Coan S, et al. The cost of epilepsy in the United States: an esti-mate from population-based clinical and survey data. Epilepsia. 2000;41(3):342–51.
4. Gaitatzis A, Sander JW. The mortality of epilepsy revisited. Epi-leptic Disord. 2004;6(1):3–13.
5. Gaitatzis A, Sisodiya SM, Sander JW. The somatic comorbidity of epilepsy: a weighty but often unrecognized burden. Epilepsia. 2012;53(8):1282–93. doi:10.1111/j.1528-1167.2012.03528.x. 6. Gilliam F, Hecimovic H, Sheline Y. Psychiatric comorbidity,
health, and function in epilepsy. Epilepsy Behav. 2003;4(Suppl 4):S26–30. doi:S1525505003002828 [pii].
7. Richardson M. Current themes in neuroimaging of epilepsy: brain networks, dynamic phenomena, and clinical relevance. Clinical Neurophysiol. 2010;121(8):1153–75. doi:10.1016/j. clinph.2010.01.004.
8. Recommendations for neuroimaging of patients with epilepsy. Commission on Neuroimaging of the International League Against Epilepsy. Epilepsia. 1997;38(11):1255–6.
9. Craven IJ, Griffiths PD, Bhattacharyya D, Grunewald RA, Hodgson T, Connolly DJ, et al. 3.0 T MRI of 2000 con-secutive patients with localisation-related epilepsy. Br J Ra-diol. 2012;85(1017):1236–42. doi:30177037 [pii] 10.1259/ bjr/30177037.
10. Scott CA, Fish DR, Smith SJ, Free SL, Stevens JM, Thompson PJ, et al. Presurgical evaluation of patients with epilepsy and nor-mal MRI: role of scalp video-EEG telemetry. J Neurol Neurosurg Psychiatry. 1999;66(1):69–71.
11. Bronen RA, Fulbright RK, Spencer DD, Spencer SS, Kim JH, Lange RC, et al. Refractory epilepsy: comparison of MR imag-ing, CT, and histopathologic findings in 117 patients. Radiology. 1996;201(1):97–105.
12. Bernasconi A, Antel SB, Collins DL, Bernasconi N, Olivier A, Dubeau F, et al. Texture analysis and morphological processing of magnetic resonance imaging assist detection of focal corti-cal dysplasia in extra-temporal partial epilepsy. Ann Neurol. 2001;49(6):770–5.
49. LeVan P, Tyvaert L, Moeller F, Gotman J. Independent component analysis reveals dynamic ictal BOLD responses in EEG-fMRI data from focal epilepsy patients. NeuroImage. 2010;49(1):366– 78. doi:10.1016/j.neuroimage.2009.07.064.
50. Jann K, Wiest R, Hauf M, Meyer K, Boesch C, Mathis J, et al. BOLD correlates of continuously fluctuating epileptic activ-ity isolated by independent component analysis. Neuroimage. 2008;42(2):635–48. doi:S1053-8119(08)00612-5 [pii] 10.1016/j. neuroimage.2008.05.001.
51. Delorme A, Sejnowski T, Makeig S. Enhanced detection of artifacts in EEG data using higher-order statistics and independent com-ponent analysis. NeuroImage. 2007;34(4):1443–9. doi:S1053-8119(06)01109-8 [pii] 10.1016/j.neuroimage.2006.11.004. 52. Onton J, Makeig S. Information-based modeling of event-related
brain dynamics. Prog Brain Res. 2006;159:99–120. doi:S0079-6123(06)59007-7 [pii] 10.1016/S0079-doi:S0079-6123(06)59007-7. 53. De Tiege X, Laufs H, Clark CA, et al. EEG-fMRI in children with
pharmacoresistant focal epilepsy. Epilepsia. 2007;48(2):385–9. doi:EPI951 [pii] 10.1111/j.1528-1167.2006.00951.x.
54. Salek-Haddadi A, Diehl B, Hamandi K, Merschhemke M, Liston A, Friston K, et al. Hemodynamic correlates of epileptiform dis-charges: an EEG-fMRI study of 63 patients with focal epilepsy. Brain Res. 2006;1088(1):148–66. doi:S0006-8993(06)00524-5 [pii] 10.1016/j.brainres.2006.02.098.
55. Moeller F, Tyvaert L, Nguyen DK, LeVan P, Bouthillier A, Ko-bayashi E, et al. EEG-fMRI: adding to standard evaluations of patients with nonlesional frontal lobe epilepsy. Neurology. 2009;73(23):2023–30. doi:10.1212/WNL.0b013e3181c55d17. 56. Zijlmans M, Huiskamp G, Hersevoort M, Seppenwoolde JH,
van Huffelen AC, Leijten FS. EEG-fMRI in the preoperative work-up for epilepsy surgery. Brain. 2007;130(Pt 9):2343–53. doi:10.1093/brain/awm141.
57. Weir B. The morphology of the spike-wave complex. Electroen-cephalogr Clin Neurophysiol. 1965;19(3):284–90.
58. Panayiotopoulos CP, Chroni E, Daskalopoulos C, Baker A,
Row-linson S, Walsh P. Typical absence seizures in adults: clinical, EEG, video-EEG findings and diagnostic/syndromic consider-ations. J Neurol Neurosurg Psychiatry. 1992;55(11):1002–8. 59. Holmes GL, McKeever M, Adamson M. Absence seizures in
children: clinical and electroencephalographic features. Ann Neurol. 1987;21(3):268–73. doi:10.1002/ana.410210308. 60. Gloor P. Generalized cortico-reticular epilepsies. Some
consider-ations on the pathophysiology of generalized bilaterally synchro-nous spike and wave discharge. Epilepsia. 1968;9(3):249–63. 61. Meeren H, van Luijtelaar G, Lopes da Silva F, Coenen A.
Evolv-ing concepts on the pathophysiology of absence seizures: the cor-tical focus theory. Arch Neurol. 2005;62(3):371–6. doi:62/3/371 [pii] 10.1001/archneur.62.3.371.
62. Blumenfeld H, McCormick DA. Corticothalamic inputs control the pattern of activity generated in thalamocortical networks. J Neurosci. 2000;20(13):5153–62. doi:20/13/5153 [pii].
63. Archer JS, Abbott DF, Waites AB, Jackson GD. fMRI “deacti-vation” of the posterior cingulate during generalized spike and wave. NeuroImage. 2003;20(4):1915–22.
64. Aghakhani Y, Bagshaw AP, Benar CG, Hawco C, Andermann F, Dubeau F, et al. fMRI activation during spike and wave dis-charges in idiopathic generalized epilepsy. Brain. 2004;127(Pt 5):1127–44. doi:10.1093/brain/awh136.
65. Hamandi K, Salek-Haddadi A, Laufs H, Liston A, Friston K, Fish DR, et al. EEG-fMRI of idiopathic and secondarily generalized epilepsies. NeuroImage. 2006;31(4):1700–10. doi:10.1016/j. neuroimage.2006.02.016.
66. Moeller F, LeVan P, Muhle H, Stephani U, Dubeau F, Siniatch-kin M, et al. Absence seizures: individual patterns revealed by EEG-fMRI. Epilepsia. 2010;51(10):2000–10. doi:EPI2698 [pii] 10.1111/j.1528-1167.2010.02698.x.
31. Rummel C, Verma RK, Schopf V, Abela E, Hauf M, Berruecos JF, et al. Time course based artifact identification for indepen-dent components of resting-state FMRI. Front Hum Neurosci. 2013;7:214. doi:10.3389/fnhum.2013.00214.
32. van den Heuvel MP, Hulshoff Pol HE. Exploring the brain net-work: a review on resting-state fMRI functional connectivity. Eur Neuropsychopharmacol. 2010;20(8):519–34. doi:S0924-977X(10)00068-4 [pii] 10.1016/j.euroneuro.2010.03.008. 33. Rummel C, Abela E, Muller M, Hauf M, Scheidegger O, Wiest
R, et al. Uniform approach to linear and nonlinear interrelation patterns in multivariate time series. Phys Rev E Stat Nonlin Soft Matter Phys. 2011;83(6 Pt 2):066215.
34. Buckner RL, Sepulcre J, Talukdar T, Krienen FM, Liu H, Hedden T, et al. Cortical hubs revealed by intrinsic functional connectiv-ity: mapping, assessment of stability, and relation to Alzheimer’s disease. J Neurosci. 2009;29(6):1860–73. doi:29/6/1860 [pii] 10.1523/JNEUROSCI.5062-08.2009.
35. Zalesky A, Fornito A, Harding IH, Cocchi L, Yucel M, Pante-lis C, et al. Whole-brain anatomical networks: does the choice of nodes matter? NeuroImage. 2010;50(3):970–83. doi:S1053-8119(09)01315-9 [pii] 10.1016/j.neuroimage.2009.12.027. 36. Rubinov M, Sporns O. Complex network measures of
brain connectivity: uses and interpretations. NeuroImage. 2010;52(3):1059–69. doi:S1053-8119(09)01074-X [pii] 10.1016/j.neuroimage.2009.10.003.
37. Tononi G, Sporns O, Edelman GM. A measure for brain com-plexity: relating functional segregation and integration in the ner-vous system. Proc Natl Acad Sci U S A. 1994;91(11):5033–7. 38. Sporns O. Network attributes for segregation and integration
in the human brain. Curr Opin Neurobiol. 2013;23(2):162–71. doi:S0959-4388(12)00189-4 [pii] 10.1016/j.conb.2012.11.015. 39. Latora V, Marchiori M. Efficient behavior of small-world
net-works. Phys Rev Lett. 2001;87(19):198701.
40. Watts DJ, Strogatz SH. Collective dynamics of ‘small-world’ net-works. Nature. 1998;393(6684):440–2. doi:10.1038/30918. 41. Stam CJ, Reijneveld JC. Graph theoretical analysis of complex
networks in the brain. Nonlinear Biomed Phys. 2007;1(1):3. doi:1753-4631-1-3 [pii] 10.1186/1753-4631-1-3.
42. Greicius MD, Krasnow B, Reiss AL, Menon V. Functional con-nectivity in the resting brain: a network analysis of the default mode hypothesis. Proc Natl Acad Sci U S A. 2003;100(1):253–8. doi:10.1073/pnas.0135058100.
43. Calhoun VD, Adali T, Pearlson GD, Pekar JJ. A method for mak-ing group inferences from functional MRI data usmak-ing indepen-dent component analysis. Hum Brain Mapp. 2001;14(3):140–51. doi:10.1002/hbm.1048 [pii].
44. Tzourio-Mazoyer N, Landeau B, Papathanassiou D, Crivello F, Etard O, Delcroix N, et al. Automated anatomical labeling of ac-tivations in SPM using a macroscopic anatomical parcellation of the MNI MRI single-subject brain. NeuroImage. 2002;15(1):273– 89. doi:10.1006/nimg.2001.0978 S1053811901909784 [pii]. 45. Huster RJ, Debener S, Eichele T, Herrmann CS. Methods for
simultaneous EEG-fMRI: an introductory review. J Neurosci. 2012;32(18):6053–60. doi:10.1523/JNEUROSCI.0447-12.2012. 46. Ritter P, Villringer A. Simultaneous EEG-fMRI. Neu-rosci Biobehav Rev. 2006;30(6):823–38. doi:10.1016/j. neubiorev.2006.06.008.
47. Mulert C, Lemieux L. EEG-fMRI—phyiological basis, technique and applications. Springer; 2010. p. 309–31.
48. Moeller F, Muhle H, Wiegand G, Wolff S, Stephani U, Siniatch-kin M. EEG-fMRI study of generalized spike and wave discharg-es without transitory cognitive impairment. Epilepsy Behav. 2010;18(3):313–6. doi:S1525-5050(10)00275-1 [pii] 10.1016/j. yebeh.2010.02.013.
83. Seidenberg M, Kelly KG, Parrish J, Geary E, Dow C, Rutecki P, et al. Ipsilateral and contralateral MRI volumetric abnor-malities in chronic unilateral temporal lobe epilepsy and their clinical correlates. Epilepsia. 2005;46(3):420–30. doi:10.1111/j.0013-9580.2005.27004.x.
84. Bettus G, Guedj E, Joyeux F, Confort-Gouny S, Soulier E, Laguit-ton V, et al. Decreased basal fMRI functional connectivity in epi-leptogenic networks and contralateral compensatory mechanisms. Hum Brain Mapp. 2009;30(5):1580–91. doi:10.1002/hbm.20625. 85. Morgan VL, Rogers BP, Sonmezturk HH, Gore JC, Abou-Khalil B. Cross hippocampal influence in mesial temporal lobe epilepsy measured with high temporal resolution functional magnetic resonance imaging. Epilepsia. 2011;52(9):1741–9. doi:10.1111/j.1528-1167.2011.03196.x.
86. Tracy JI, Osipowicz K, Spechler P, Sharan A, Skidmore C, Doucet G, et al. Functional connectivity evidence of cortico-cortico inhibition in temporal lobe epilepsy. Hum Brain Mapp. 2014;35(1):353–66. doi:10.1002/hbm.22181.
87. Fahoum F, Lopes R, Pittau F, Dubeau F, Gotman J. Widespread ep-ileptic networks in focal epilepsies: EEG-fMRI study. Epilepsia. 2012;53(9):1618–27. doi:10.1111/j.1528-1167.2012.03533.x. 88. Laufs H, Richardson MP, Salek-Haddadi A, Vollmar C,
Dun-can JS, Gale K, et al. Converging PET and fMRI evidence for a common area involved in human focal epilepsies. Neurology. 2011;77(9):904–10. doi:WNL.0b013e31822c90f2 [pii] 10.1212/ WNL.0b013e31822c90f2.
89. Wiest R, Estermann L, Scheidegger O, Rummel C, Jann K, Seeck M, et al. Widespread grey matter changes and hemodynamic cor-relates to interictal epileptiform discharges in pharmacoresis-tant mesial temporal epilepsy. J Neurol. 2013;260(6):1601–10. doi:10.1007/s00415-013-6841-2.
90. Ashburner J, Friston KJ. Voxel-based morphometry—the meth-ods. NeuroImage. 2000;11(6 Pt 1):805–21. doi:10.1006/nimg.20 00.0582S1053-8119(00)90582-2 [pii].
91. Weder BJ, Schindler K, Loher TJ, Wiest R, Wissmeyer M, Ritter P, et al. Brain areas involved in medial temporal lobe seizures: a principal component analysis of ictal SPECT data. Hum Brain Mapp. 2006;27(6):520–34. doi:10.1002/hbm.20196.
92. Salmenpera T, Kalviainen R, Partanen K, Pitkanen A. Quantita-tive MRI volumetry of the entorhinal cortex in temporal lobe epi-lepsy. Seizure. 2000;9(3):208–15. doi:10.1053/seiz.1999.0373. 93. Keller SS, Roberts N. Voxel-based morphometry of temporal lobe
epilepsy: an introduction and review of the literature. Epilepsia. 2008;49(5):741–57. doi:10.1111/j.1528-1167.2007.01485.x. 94. Bernhardt BC, Worsley KJ, Besson P, Concha L, Lerch JP,
Evans AC, et al. Mapping limbic network organization in tem-poral lobe epilepsy using morphometric correlations: insights on the relation between mesiotemporal connectivity and corti-cal atrophy. NeuroImage. 2008;42(2):515–24. doi:10.1016/j. neuroimage.2008.04.261.
95. Riederer F, Lanzenberger R, Kaya M, Prayer D, Serles W, Baumgartner C. Network atrophy in temporal lobe epilepsy: a voxel-based morphometry study. Neurology. 2008;71(6):419–25. doi:10.1212/01.wnl.0000324264.96100.e0.
96. Cascino GD. Temporal lobe epilepsy is a progressive neurologic disorder: time means neurons! Neurology. 2009;72(20):1718–9. doi:10.1212/WNL.0b013e3181a4e465.
97. Voets NL, Beckmann CF, Cole DM, Hong S, Bernasconi A, Bernasconi N. Structural substrates for resting network disrup-tion in temporal lobe epilepsy. Brain. 2012;135(Pt 8):2350–7. doi:10.1093/brain/aws137.
98. Power JD, Barnes KA, Snyder AZ, Schlaggar BL, Petersen SE. Spurious but systematic correlations in functional con-nectivity MRI networks arise from subject motion. NeuroIm-age. 2012;59(3):2142–54. doi:S1053-8119(11)01181-5 [pii] 10.1016/j.neuroimage.2011.10.018.
67. Moeller F, Siebner HR, Wolff S, Muhle H, Granert O, Jansen O, et al. Simultaneous EEG-fMRI in drug-naive children with newly diagnosed absence epilepsy. Epilepsia. 2008;49(9):1510– 9. doi:10.1111/j.1528-1167.2008.01626.x.
68. Raichle ME, MacLeod AM, Snyder AZ, Powers WJ, Gusnard DA, Shulman GL. A default mode of brain function. Proc Natl Acad Sci U S A. 2001;98(2):676–82. doi:10.1073/pnas.98.2.676. 69. Buckner RL, Andrews-Hanna JR, Schacter DL. The brain’s de-fault network: anatomy, function, and relevance to disease. Ann N Y Acad Sci. 2008;1124:1–38. doi:10.1196/annals.1440.011. 70. Raichle ME, Snyder AZ. A default mode of brain function: a brief
history of an evolving idea. NeuroImage. 2007;37(4):1083–90. (Discussion 97–9). doi:10.1016/j.neuroimage.2007.02.041. 71. Bonnelle V, Ham TE, Leech R, Kinnunen KM, Mehta MA,
Green-wood RJ, et al. Salience network integrity predicts default mode network function after traumatic brain injury. Proc Natl Acad Sci U S A. 2012;109(12):4690–5. doi:10.1073/pnas.1113455109. 72. Bai X, Vestal M, Berman R, Negishi M, Spann M, Vega C, et
al. Dynamic time course of typical childhood absence seizures: EEG, behavior, and functional magnetic resonance imaging. J Neurosci. 2010;30(17):5884–93. doi:30/17/5884 [pii] 10.1523/ JNEUROSCI.5101-09.2010.
73. Benuzzi F, Mirandola L, Pugnaghi M, Farinelli V, Tassinari CA, Capovilla G, et al. Increased cortical BOLD signal an-ticipates generalized spike and wave discharges in adolescents and adults with idiopathic generalized epilepsies. Epilepsia. 2012;53(4):622–30. doi:10.1111/j.1528-1167.2011.03385.x. 74. Vaudano AE, Laufs H, Kiebel SJ, Carmichael DW, Hamandi K,
Guye M, et al. Causal hierarchy within the thalamo-cortical net-work in spike and wave discharges. PloS One. 2009;4(8):e6475. doi:10.1371/journal.pone.0006475.
75. Hauf M, Jann K, Schindler K, Scheidegger O, Meyer K, Rummel C, et al. Localizing seizure-onset zones in presurgical evaluation of drug-resistant epilepsy by electroencephalography/fMRI: ef-fectiveness of alternative thresholding strategies. AJNR Am J Neuroradiol. 2012;33(9):1818–24. doi:10.3174/ajnr.A3052. 76. Jann K, Dierks T, Boesch C, Kottlow M, Strik W, Koenig T.
BOLD correlates of EEG alpha phase-locking and the fMRI de-fault mode network. NeuroImage. 2009;45(3):903–16.
77. Masterton RA, Carney PW, Abbott DF, Jackson GD. Absence epilepsy subnetworks revealed by event-related independent components analysis of functional magnetic resonance imaging. Epilepsia. 2013;54(5):801–8. doi:10.1111/epi.12163.
78. Doucet G, Naveau M, Petit L, Delcroix N, Zago L, Crivello F, et al. Brain activity at rest: a multiscale hierarchical functional or-ganization. J Neurophysiol. 2011;105(6):2753–63. doi:10.1152/ jn.00895.2010.
79. Mars RB, Sallet J, Schuffelgen U, Jbabdi S, Toni I, Rushworth MF. Connectivity-based subdivisions of the human right “temporopa-rietal junction area”: evidence for different areas participating in different cortical networks. Cereb Cortex. 2012;22(8):1894–903. doi:bhr268 [pii] 10.1093/cercor/bhr268.
80. Li ZB, Cai W, Cao Q, Chen K, Wu Z, He L, et al. (64)Cu-la-beled tetrameric and octameric RGD peptides for small-animal PET of tumor alpha(v)beta(3) integrin expression. J Nucl Med. 2007;48(7):1162–71. doi:10.2967/jnumed.107.039859.
81. Bernhardt BC, Chen Z, He Y, Evans AC, Bernasconi N. Graph-theoretical analysis reveals disrupted small-world organization of cortical thickness correlation networks in temporal lobe epilepsy. Cereb Cortex. 2011;21(9):2147–57. doi:10.1093/cercor/bhq291. 82. Liao W, Zhang Z, Pan Z, Mantini D, Ding J, Duan X, et al.
Al-tered functional connectivity and small-world in mesial temporal lobe epilepsy. PloS One. 2010;5(1):e8525. doi:10.1371/journal. pone.0008525.
103. Behzadi Y, Restom K, Liau J, Liu TT. A component based noise correction method (CompCor) for BOLD and perfusion based fMRI. NeuroImage. 2007;37(1):90–101. doi:S1053-8119(07)00383-7 [pii] 10.1016/j.neuroimage.2007.04.042. 104. Hallquist MN, Hwang K, Luna B. The nuisance of nuisance
regression: spectral misspecification in a common approach to resting-state fMRI preprocessing reintroduces noise and obscures functional connectivity. NeuroImage. 2013;82:208– 25. doi:S1053-8119(13)00626-5 [pii] 10.1016/j. neuroimage.2013.05.116.
105. Murta T, Leal A, Garrido MI, Figueiredo P. Dynamic Causal Modelling of epileptic seizure propagation pathways: a combined EEG-fMRI study. NeuroImage. 2012;62(3):1634–42. doi:S1053-8119(12)00541-1 [pii] 10.1016/j.neuroimage.2012.05.053. 99. Power JD, Mitra A, Laumann TO, Snyder AZ, Schlaggar
BL, Petersen SE. Methods to detect, characterize, and re-move motion artifact in resting state fMRI. NeuroImage. 2013;84C:320–41. doi:S1053-8119(13)00911-7 [pii] 10.1016/j. neuroimage.2013.08.048.
100. Power JD, Barnes KA, Snyder AZ, Schlaggar BL, Peters-en SE. Steps toward optimizing motion artifact removal in functional connectivity MRI; a reply to Carp. NeuroImage. 2013;76:439–41. doi:S1053-8119(12)00290-X [pii] 10.1016/j. neuroimage.2012.03.017.
101. Tijssen RH, Jenkinson M, Brooks JC, Jezzard P, Miller KL. Op-timizing RetroICor and RetroKCor corrections for multi-shot 3D FMRI acquisitions. NeuroImage. 2013;84C:394–405. doi:S1053-8119(13)00926-9 [pii] 10.1016/j.neuroimage.2013.08.062. 102. Glover GH, Li TQ, Ress D. Image-based method for retrospective
correction of physiological motion effects in fMRI: RETROI-COR. Magn Reson Med. 2000;44(1):162–7. doi:10.1002/1522-2594(200007)44:1<162::AID-MRM23>3.0.CO;2-E [pii].