Publisher’s version / Version de l'éditeur:
Physiological Genomics, 37, 3, pp. 149-163, 2009-05
READ THESE TERMS AND CONDITIONS CAREFULLY BEFORE USING THIS WEBSITE. https://nrc-publications.canada.ca/eng/copyright
Vous avez des questions? Nous pouvons vous aider. Pour communiquer directement avec un auteur, consultez la première page de la revue dans laquelle son article a été publié afin de trouver ses coordonnées. Si vous n’arrivez pas à les repérer, communiquez avec nous à PublicationsArchive-ArchivesPublications@nrc-cnrc.gc.ca.
Questions? Contact the NRC Publications Archive team at
PublicationsArchive-ArchivesPublications@nrc-cnrc.gc.ca. If you wish to email the authors directly, please see the first page of the publication for their contact information.
NRC Publications Archive
Archives des publications du CNRC
This publication could be one of several versions: author’s original, accepted manuscript or the publisher’s version. / La version de cette publication peut être l’une des suivantes : la version prépublication de l’auteur, la version acceptée du manuscrit ou la version de l’éditeur.
For the publisher’s version, please access the DOI link below./ Pour consulter la version de l’éditeur, utilisez le lien DOI ci-dessous.
https://doi.org/10.1152/physiolgenomics.90373.2008
Access and use of this website and the material on it are subject to the Terms and Conditions set forth at
Identification and analysis of differentially expressed genes in immune
tissues of Atlantic cod stimulated with formalin-killed, atypical
Aeromonas salmonicida
Feng, Charles Y.; Johnson, Stewart C.; Hori, Tiago S.; Rise, Marlies; Hall,
Jennifer R.; Gamperl, A. Kurt; Hubert, Sophie; Kimball, Jennifer; Bowman,
Sharen; Rise, Matthew L.
https://publications-cnrc.canada.ca/fra/droits
L’accès à ce site Web et l’utilisation de son contenu sont assujettis aux conditions présentées dans le site LISEZ CES CONDITIONS ATTENTIVEMENT AVANT D’UTILISER CE SITE WEB.
NRC Publications Record / Notice d'Archives des publications de CNRC:
https://nrc-publications.canada.ca/eng/view/object/?id=5c1687c9-0042-44cd-8ff6-61dd7e5a11e0
https://publications-cnrc.canada.ca/fra/voir/objet/?id=5c1687c9-0042-44cd-8ff6-61dd7e5a11e0
CALL FOR PAPERS
Comparative Genomics
Identification and analysis of differentially expressed genes in immune tissues
of Atlantic cod stimulated with formalin-killed, atypical Aeromonas
salmonicida
Charles Y. Feng,
1Stewart C. Johnson,
2Tiago S. Hori,
1Marlies Rise,
1Jennifer R. Hall,
1A. Kurt Gamperl,
1Sophie Hubert,
3Jennifer Kimball,
4Sharen Bowman,
3,5and Matthew L. Rise
11Ocean Sciences Centre, Memorial University of Newfoundland, St. John’s, Newfoundland;2Fisheries and Oceans Canada,
Pacific Biological Station, Nanaimo, British Columbia;3The Atlantic Genome Centre;4Institute for Marine Biosciences,
National Research Council; and5Department of Process Engineering and Applied Science, Dalhousie University, Halifax,
Nova Scotia, Canada
Submitted 13 November 2008; accepted in final form 13 February 2009 Feng CY, Johnson SC, Hori TS, Rise M, Hall JR, Gamperl AK, Hubert S, Kimball J, Bowman S, Rise ML. Identification and analysis of differentially expressed genes in immune tissues of Atlan-tic cod stimulated with formalin-killed, atypical Aeromonas
salmoni-cida. Physiol Genomics37: 149 –163, 2009. First published February 24, 2009; doi:10.1152/physiolgenomics.90373.2008.—Physiological changes, elicited in animal immune tissues by exposure to pathogens, may be studied using functional genomics approaches. We created and characterized reciprocal suppression subtractive hybridization (SSH) cDNA libraries to identify differentially expressed genes in spleen and head kidney tissues of Atlantic cod (Gadus morhua) challenged with intraperitoneal injections of formalin-killed, atypical
Aeromonas salmonicida. Of 4,154 ESTs from four cDNA libraries, 10 genes with immune-relevant functional annotations were selected for QPCR studies using individual fish templates to assess biological variability. Genes confirmed by QPCR as upregulated by A.
salmo-nicidaincluded interleukin-1, interleukin-8, a small inducible cyto-kine, interferon regulatory factor 1 (IRF1), ferritin heavy subunit, cathelicidin, and hepcidin. This study is the first large-scale discovery of bacteria-responsive genes in cod and the first to demonstrate upregulation of IRF1 in fish immune tissues as a result of bacterial antigen stimulation. Given the importance of IRF1 in vertebrate immune responses to viral and bacterial pathogens, the full-length cDNA sequence of Atlantic cod IRF1 was obtained and compared with putative orthologous sequences from other organisms. Functional annotations of assembled SSH library ESTs showed that bacterial antigen stimulation caused changes in many biological processes including chemotaxis, regulation of apoptosis, antimicrobial peptide production, and iron homeostasis. Moreover, differences in spleen and head kidney gene expression responses to the bacterial antigens pointed to a potential role for the cod spleen in blood-borne pathogen clearance. Our data show that Atlantic cod immune tissue responses to bacterial antigens are similar to those seen in other fish species and higher vertebrates.
Gadus morhua; bacterial antigen; immune response; transcriptome; gene expression
AEROMONAS SALMONICIDASUBSP. SALMONICIDA
is a Gram-negative
bacterium that is the causative agent of typical furunculosis,
a bacterial septicemia of coldwater fish. In addition to this
subspecies, a large number of other subspecies exist that
produce atypical forms of this disease. These subspecies,
which are referred to as atypical strains, infect a wide range
of fish hosts in a wide variety of environments (87). Both
typical and atypical A. salmonicida are known to infect and
cause disease in aquaculture-reared Atlantic cod (Gadus
morhua
) (67).
Lipopolysaccharides (LPS), unmethylated CpG motifs,
pep-tidoglycan, and flagellin are common pathogen-associated
mo-lecular patterns (PAMPs) associated with Gram-negative
bac-teria, which can be recognized by a variety of host pattern
recognition receptors (PRRs). These PRRs include a number of
Toll-like receptors as well as other cell-surface and cytosolic
receptors that, upon stimulation, modulate immunity (58, 83).
In higher vertebrates, these receptors, their signaling pathways,
and the immunological pathways that they stimulate, are
rela-tively well characterized compared with our current
under-standing of lower vertebrates such as fish. To add to our
knowledge of the immune system of fish, we are undertaking
research aimed at fully characterizing the Atlantic cod
immu-nome. This research is being conducted as part of the Genome
Canada-funded Atlantic Cod Genomics and Broodstock
De-velopment Program (CGP, http://www.codgene.ca) and aims
to develop a complete understanding of the genes and
molec-ular pathways involved in Atlantic cod responses to pathogens
and thus to facilitate the development of management
prac-tices, markers and methods for selecting disease-resistant
broodstock, and new vaccines and therapeutics to combat
disease outbreaks in Atlantic cod aquaculture.
To this end, we constructed reciprocal suppression
subtrac-tive hybridization (SSH) cDNA libraries enriched for genes
that were differentially expressed in the spleen and
hematopoi-etic kidney (head kidney) of juvenile Atlantic cod following
stimulation with formalin-killed, atypical A. salmonicida.
Se-quencing of the expressed sequence tags (ESTs), the
develop-ment of an EST database, as well as the developdevelop-ment of
quantitative reverse transcription-polymerase chain reaction
(QPCR) protocols, enabled us to partially characterize,
func-tionally annotate, and study the expression of genes involved in
primary immune responses (2–72 h poststimulation) to these
Address for reprint requests and other correspondence: M. L. Rise, Ocean Sciences Centre, Memorial Univ. of Newfoundland, 1 Marine Lab Rd., St. John’s, NL, A1C 5S7, Canada (e-mail: mrise@mun.ca).
bacterial antigens. The use of SSH libraries has been
previ-ously demonstrated to be an effective method for identifying
Atlantic cod genes that are differentially expressed during
immune responses to virus-like antigens (59, 71). We decided
to study the head kidney and spleen due to their roles in fish as
primary and secondary lymphoid organs, respectively (57). A.
salmonicida
was selected due both to its importance as a
disease-causing organism, as well as the interest in developing
vaccines against this pathogen for use in marine fishes (24, 43).
MATERIALS AND METHODS
Bacterial antigen preparation. Single colonies of atypical A.
sal-monicida, originally isolated from a Norwegian Atlantic cod [strain #aAs4099 (IMB #05-2)], were grown in 100 ml of tryptic soy broth overnight at 17°C, with shaking (100 rpm). Cultures were centrifuged (10 min, 2,000 g, 4°C), and the resulting pellet was washed twice with 40 ml of cold, sterile phosphate-buffered saline (PBS). After washing, the bacteria were resuspended in PBS to give an OD600of 1.0 and inactivated by the addition of formalin (4% formalin wt/vol). Follow-ing inactivation, the bacteria were centrifuged to form a pellet (10 min, 2,000 g at 4°C), washed twice with 40 ml of PBS, and resus-pended in PBS to an OD600of 1.0. Inactivation was confirmed by plating 0.5 ml of the suspension onto tryptic soy agar and incubating for 24 h at room temperature. The inactivated cells were stored at ⫺20°C until use.
Fish husbandry, bacterial antigen stimulation, and tissue sampling.
We divided equally 150 passive integrated transponder-tagged, juve-nile, healthy-appearing Atlantic cod (⬃25 g) from a single family (family 32, CGP 2006 year class) into three 500-liter tanks and maintained them in flowing seawater (10°C, ⬎90% O2 saturation) under a 12 h light-12 h dark photoperiod. The fish were fed daily (at 1.5% body mass/day) with a commercial fish feed and acclimated to the experimental system for 17 days before experimentation.
Immediately prior to stimulation, eight individuals from each tank (0 h controls) were captured with a dip net and rapidly killed by a lethal dose (0.4 g/l) of tricaine methanesulphonate (TMS) (Syndel Laboratories, Vancouver, BC, Canada). Brain, head kidney, and spleen tissues were placed individually in RNase-free 1.5 ml tubes, flash-frozen in liquid nitrogen, and stored at ⫺80°C until RNA extraction. Dissecting tools were cleaned with RNAseZap (Ambion, Austin, TX) for spleen and head kidney excision or heat-sterilized for brain excision, between individuals to prevent cross contamination between samples. After 0 h control samples were taken, the remaining individuals received one of the following treatments: no handling (referred to as undisturbed control, or “UC”), an intraperitoneal (ip) injection of 100 l of sterile PBS (referred to as PBS), or ip injection of 100 l of formalin-inactivated A. salmonicida suspended in PBS (referred to as ASAL). Prior to injection, fish were captured with a dip net and lightly anaesthetized in an aqueous solution of 0.1 g/l TMS. At ⬃2 h, 6 h, 24 h, and 72 h postinjection (HPI), individuals from all three groups (UC, PBS, and ASAL) were captured, euthanized, and sampled as previously described for the 0 h control individuals (Supplemental Fig. S1A).1
Nodavirus testing. To determine if individuals used in library construction were asymptomatic carriers of nodavirus, a reverse transcription-polymerase chain reaction (RT-PCR) test for nodavirus (59) was conducted on individual brain RNA samples obtained from the UC and ASAL groups. This test was performed to avoid the use of nodavirus carriers as UCs (in SSH library construction) and to determine if nodavirus carrier status of brain tissue influenced gene expression in immune tissues (in QPCR studies). The results of the nodavirus testing, and the nodavirus carrier status of individuals
utilized in SSH library construction, are shown in Supplemental Fig. S1B.
SSH cDNA library construction and sequencing.Spleen and head kidney reciprocal SSH libraries were constructed to identify genes involved in the response to ip injection with bacterial antigens. For each tissue (spleen, head kidney) and condition (UC, ASAL), DNase I-treated, cleaned total RNA (10 g per sample) from five individuals sampled at each time point (2, 6, 24, and 72 HPI) was used to generate the mRNA pools for the UC and ASAL groups (Supplemental Fig. S1B). Samples used to create the ASAL mRNA pool were taken from nodavirus carriers and noncarriers, whereas samples for the UC mRNA pool were taken only from noncarrier fish. This strategy was employed to maximize the difference between ASAL and UC pool transcriptomes, thereby maximizing the utility of resulting SSH li-braries for immune gene discovery. The individuals utilized for building spleen and head kidney SSH libraries, with nodavirus carrier status information, are shown in Supplemental Fig. S1B. For each tissue, the ASAL mRNA pool was the tester in the forward subtrac-tion, and the driver in the reverse subtraction; the UC mRNA pool was the driver in the forward subtraction and the tester in the reverse subtraction. Therefore, the forward SSH libraries were enriched for transcripts that were upregulated due to injection stress, exposure to A.
salmonicidaantigens, and/or the presence of nodavirus (in brain) in an asymptomatic carrier state. The reverse SSH libraries were enriched for transcripts that were downregulated by these factors (Supplemen-tal Fig. S1B).
In brief, SSH library construction was performed using the PCR-Select cDNA Subtraction Kit (Clontech, Mountain View, CA) fol-lowing the manufacturer’s instructions as previously described (59). A brief description of the method and any differences from Ref. 59 follows. Total RNA was extracted from spleen and head kidney samples of individual fish (Supplemental Fig. S1) using TRIzol Reagent (Invitrogen, Burlington, ON, Canada). Total RNA was treated with DNase I (RNase-Free DNase Set; QIAGEN, Mississauga, ON, Can-ada) to remove residual genomic DNA and column purified (RNeasy MinElute Cleanup Kit, QIAGEN) as described (59). Poly(A)⫹RNA (mRNA) was isolated from UC and ASAL tissue total RNA pools (Supplemental Fig. S1B) using the MicroPoly (A) Purist Small Scale mRNA Purification Kit (Ambion, Austin, TX) as described below.
The SSH libraries were amplified using the Advantage 2 Polymer-ase Kit (Clontech) following the manufacturer’s protocol and purified using the MinElute PCR Purification Kit (QIAGEN). The resulting cDNA libraries were TA cloned into pGEM-T-Easy (Promega, Mad-ison, WI), and the transformations were performed using MAX Efficiency DH5␣ Chemically Competent Cells (Invitrogen).
DNA sequencing, sequence assembly, and gene identification.The methods used for sequencing the SSH libraries and for assembly and annotation of ESTs arising from these libraries were previously described (59). Briefly, DNA extracted from individual bacterial clones was amplified using Templiphi DNA polymerase and se-quenced using ET terminator chemistry (GE Healthcare, Piscataway, NJ) on MegaBACE capillary sequencers. The resultant ESTs were first trimmed with PHRED (20, 21), then screened, and clustered using Paracel Transcript Assembler (PTA; Paracel, Pasadena, CA). Both contigs (contiguous consensus sequences) and singletons (indi-vidual sequence reads) generated by the PTA clustering procedure were annotated using AutoFACT (36). In our AutoFACT annotation, BLASTn was used to identify ribosomal RNA sequences in large and small subunit databases, while BLASTx was used for all other alignments. For both BLASTx and BLASTn, the BLAST hits with bit scores ⬎40 were considered significant. All EST sequences have been deposited in GenBank dbEST (See Table 1 for accession numbers and EST library statistics). In addition, these sequences and their AutoFACT annotations can be accessed through the CGP EST database (http://ri.imb.nrc.ca/codgene).
QPCR.For 10 immune-relevant genes identified in the SSH librar-ies, transcript (mRNA) expression was studied in PBS and ASAL
tissues (spleen and head kidney) from five time points (2, 6, 24, 72 HPI, and 0 h preinjection control) using Power SYBR Green I dye chemistry and the 7300 Real Time PCR system (Applied Biosystems, Foster City, CA). With the exception of the 0 h control PBS group (n ⫽ 5), six fish from each group, tissue, and time point were used in the QPCR study. QPCR primers, designed from EST sequences (Tables 2–5 and Supplemental Table S1) using the Primer 3 program (65) (available at http://frodo.wi.mit.edu), are listed in Table 6. Dis-sociation curves were run to ensure that primer pairs amplified single products, and no-template controls were run to ensure that primer dimers were absent. The amplification efficiencies of primer pairs for SCYA, interferon regulatory factor 1 (IRF1), and 18S ribosomal RNA were determined previously (59). The amplification efficiencies of the other primer sets were determined as described (59). Expression levels of the genes of interest were normalized to 18S ribosomal RNA, which was stably transcribed in all samples involved in the QPCR study.
For each sample, 1 g of DNase I-treated and column-purified total RNA was reverse-transcribed in a final reaction volume of 20 l as in Rise et al. (59), and the resulting cDNA was diluted with nuclease-free H2O to a final volume of 100 l. PCR amplifications were performed using a 7300 Real Time PCR detection system (Applied Biosystems) using 25 l reactions that contained 1 l of diluted cDNA (10 ng input total RNA), 50 nM each of forward and reverse primer, and 1⫻ Power SYBR Green PCR Master Mix (Applied Biosystems). The amplification program consisted of 1 cycle of 95°C for 10 min, 40 cycles of (95°C for 15 s and 60°C for 1 min) (primer annealing and extension stage), with the fluorescent signal from SYBR green measured at the end of each 60°C step. For each sample, the target transcript (gene of interest) and the normalizer (18S rRNA) were each run in duplicate on the same plate. The fluorescence thresholds and baseline were determined automatically using the 7300 PCR Detection System SDS Software Relative Quantification Study Application (version 1.2.3, Applied Biosystems). Thresholds were set manually if the software did not place them at the exponential phase of amplification with minimal variation between technical replicates. CT(threshold cycle) values were obtained and used for calculation of relative quantity (RQ) of each transcript with the 2⫺⌬⌬CT quantifica-tion method and assuming 100% amplificaquantifica-tion efficiencies for gene of interest and normalizer primer pairs (41).
QPCR data analysis.All RQ data are presented as means ⫾ SE. RQ values were subjected to a two-way (main effects group and sampling time) analysis of variance (ANOVA). In addition, one-way ANOVA (for each group and sampling time) with Tukey posttests were conducted to determine: 1) whether PBS control sample gene
expression (RQ values) at 2, 6, 24, and 72 HPI differed significantly from gene expression in the 0 h control group from the PBS tank; 2) if gene expression of ASAL group at each time point differed signifi-cantly from levels of gene expression in the 0 h control group from the ASAL tank; and 3) if gene expression differed significantly between the PBS and ASAL group at each individual time point (2, 6, 24, 72 HPI, and 0 h). Differences in spleen and head kidney constitutive gene expression between asymptomatic carriers of nodavirus and noncar-riers were examined by one-way ANOVA of RQ values obtained for all genes studied by QPCR at 0 h (prior to injection) as in Rise et al. (59). All statistical tests were performed using Systat 12.0 (Systat Software) with the P value set at ⱕ0.05.
Atlantic cod IRF1 characterization.The 5⬘ and 3⬘ ends of IRF1 cDNA were amplified using a commercial kit for RNA ligase-mediated-RACE, GeneRacer Kit (Invitrogen, Burlington, ON, Can-ada). IRF1-specific primers (Supplemental Table S2) were designed based upon IRF1 assembled EST sequences from the forward spleen SSH library (contig sb_gmnlsfas.73.C1, containing ESTs with acces-sion numbers EY975211 and EY975084; Supplemental Table S1A). Briefly, 250 ng of the same mRNA from ASAL fish used in spleen SSH library construction (Supplemental Fig. S1B) was used as the RNA template. For 5⬘ rapid amplification of cDNA ends (RACE), touch-down PCR was performed with GeneRacer 5⬘ primer and IRF1_5⬘RACE1, followed by a nested PCR conducted with GeneRacer 5⬘ nested primer and IRF1 _5⬘RACE2. For 3⬘RACE, only one round of touch-down PCR was carried out with GeneRacer 3⬘primer and IRF1_3⬘RACE. The cycling conditions of both touch-down PCR and nested PCR are as specified in the GeneRacer Kit manual with the extension time set to 3 min for all cycles. Nested primer pairs (IRF1_F1, IRF1_R1, IRF1_F2, and IRF1_R2; Supplemental Table S2) were de-signed in the 5⬘ and 3⬘ untranslated regions to amplify the open reading frame (ORF). The cycling conditions for both PCRs were 1 cycle of 2 min at 94°C, 25 cycles of (30 s at 94°C, 30 s at 70°C, 3 min at 72°C), and 1 cycle of 10 min at 68°C.
All PCR amplifications were performed using the Advantage 2 Polymerase kit (Clontech) and all PCR products were gel extracted using the QIAQuick Gel Extraction kit (QIAGEN), ethanol precipi-tated, washed and cloned into PCR4-TOPO (Invitrogen). The clones were transformed into One Shot TOP10 competent cells, and plated with Luria broth (LB)/carbenicillin (50 g/ml). Individual colonies were grown overnight at 37°C in LB/carbenicillin (50 g/ml), and plasmid DNA samples were isolated in the 96-well format using standard methods. The insert sizes of recombinant plasmids were determined by EcoRI (Invitrogen) digestion prior to sequencing. For
Table 1. Statistics for ESTs generated from the spleen and head kidney SSH libraries
Library Name S_Forward S_Reverse HK_Forward HK_Reverse
Tissue spleen spleen head kidney head kidney
Direction1 forward reverse forward reverse
CGP identifier2 sb_gmnlsfas sb_gmnlsras sb_gmnlkfas sb_gmnlkras
Accession numbers EY974820–EY975867 EY975868–EY976954 EY972492–EY9734503 EY973692–EY974677
ESTs, n 1,048 1,087 1,033 986
Average EST length, bp4 375 400 333 460
Contigs,5n 136 157 172 229
Singletons, n 685 677 570 268
Nonredundant ESTs,6n 821 834 742 497
Redundancy, %7 21.7 23.3 28.2 49.6
1The forward suppression subtractive hybridization (SSH) libraries were constructed to enrich genes upregulated by the Aeromonas salmonicida injection, and
the reverse SSH libraries were constructed to enrich genes downregulated by the A. salmonicida injection. S, spleen;2The identifiers of the SSH libraries in the
Atlantic Cod Genomics and Broodstock Development Program (CGP) expressed sequence tag (EST) database: http://codgene.ca.3For head kidney (HK) forward
library, 74 ESTs were not submitted to GenBank as they were rejected during the Paracel Transcript Assembler (PTA) clustering process.4The ESTs were
trimmed with PHRED (20, 21) with the trim_alt and trim_cut-off fixed at 0.06, followed by the removal of known contaminant sequences and short sequences (⬍75bp), and the average EST length was calculated based on edited sequences.5Sequences generated were then clustered using PTA, with the cluster threshold
set at 100 for relatively stringent clustering.6The number of nonredundant ESTs is the sum of the number of contigs plus the number of singletons.7The percent
redundancy is the proportion of redundant ESTs in each library, calculated as 关1 minus (number of nonredundant ESTs/total number of ESTs)兴 multiplied by 100.
each PCR product, four individual clones were sequenced in both directions using the ABI 3730 DNA Analyzer using standard tech-niques.
Atlantic cod IRF1 amino acid sequence analysis and phylogenetic tree construction.The amino acid (AA) sequence of Atlantic cod IRF1 was deduced based on the cDNA sequence using the SeqBuilder function of Lasergene 7.20 software package (DNASTAR, Madison, WI), and the mRNA features such as Sm sites, snRNP binding sites, and polyadenyl-ation signal were predicted using the RNA analyzer (4) (available at http://rnaanalyzer.bioapps.biozentrum.uni-wuerzburg.de/). The IRF1 DNA binding domain model was predicted and visualized by Swiss-model and Swiss-PdbView software (2, 25, 35, 69) (available at http:// swissmodel.expasy.org/). The deduced Atlantic cod IRF1 AA se-quence was compared with the orthologous AA sese-quences from other vertebrates. The multiple alignments were performed using the CLUSTALX (version 2.09) program, and the unrooted phylogenetic tree for IRF1 was constructed by the neighbor-joining method and
was bootstrapped 10,000 times. The phylogenetic trees were plotted using the MEGA4 (78).
RESULTS
Screening of cod immune tissue transcripts responsive to
stimulation with bacterial antigens.
To identify genes
impor-tant in the response of Atlantic cod to bacteria, juvenile fish
were stimulated with formalin-killed, atypical A. salmonicida,
and reciprocal SSH libraries from spleen and head kidney were
constructed and sequenced. The single family of fish that was
used was the same family utilized in a previous report (59).
Although this family was selected due to their good growth and
high survival in the laboratory, there were asymptomatic
car-riers of nodavirus within this family (Supplemental Fig. S1).
Nodavirus screening by RT-PCR on 32 individual fish brain
Table 2. Selected
1transcripts identified in the forward spleen SSH library (designed to be enriched for genes upregulated
by bacterial antigens)
Accession Number2
BLASTx Identification3of Cod cDNAs
ESTs, n Gene Ontology4or Function of BLASTx Hit5 Name of BLASTx hit (species) % ID (align) E-value
EY974899 small inducible cytokine SCYA104 (African cichlid)
42 (27/63) 1e-10 12 CC chemokine activity EY974843 cathelicidin 1 (Atlantic cod) 97 (121/124) 9e-64 10 defense response
EY975257 ferritin heavy subunit (Atlantic salmon) 89 (157/176) 3e-89 5 ferroxidase activity; iron ion homeostasis; oxidoreductase activity
EY975281 ferritin middle subunit (Atlantic salmon) 75 (125/166) 2e-67 4 ferroxidase activity; iron ion homeostasis; oxidoreductase activity
EY975262 myeloid cell leukemia sequence 1b (zebrafish) 50 (61/121) 1e-23 3 negative regulation of apoptosis (Ref. 42) EY975464 hepcidin (Atlantic cod) 100 (98/98) 9e-43 2 iron homeostasis
antimicrobial activity (Ref. 72) EY975498 interleukin 8 (Atlantic cod) 96 (96/99) 2e-43 2 CXC chemokine activity
EY975450 serum lectin isoform 4 (spotted halibut) 58 (31/53) 8e-12 2 sugar binding; complement pathway activation (Ref. 52)
EY974936 cathepsin L (barramundi) 41 (43/103) 4e-53 2 cysteine-type endopeptidase activity; antigen processing (Ref. 90) EY975712 DNA damage-inducible transcript 4 (African
clawed frog)
53 (50/94) 1e-17 2 DNA damage and/or p53 induced (Ref. 17) EY975030 proliferating cell nuclear antigen (channel
catfish)
96 (128/133) 1e-65 2 regulation of transcription EY975027 BH3-interacting domain death agonist protein
(zebrafish)
33 (48/142) 8e-13 2 positive regulation of apoptosis EY975211 interferon regulatory factor 1 (snakehead) 41 (43/103) 3e-13 2 regulation of transcription EY975863 basic transcription factor 3 (African clawed frog) 87 (152/173) 4e-72 2 regulation of apoptosis (Ref. 38) EY975549 goose-type lysozyme 2 (Atlantic cod) 95 (89/93) 1e-44 1 peptidoglycan catabolism EY975542 probable Bax inhibitor 1 (Japanese flounder) 88 (136/153) 9e-66 1 negative regulation of apoptosis EY975059 caspase 3B (pufferfish) 72 (66/91) 2e-32 1 apoptosis
EY975676 interleukin-1 (Atlantic cod) 97 (41/42) 9e-16 1 inflammatory response EY975713 BCL2-like10 (zebrafish) 81 (53/65) 4e-22 1 regulation of apoptosis (Ref. 33) EY975339 CC chemokine type 3 (Atlantic cod) 95 (21/22) 1e-04 1 immune response; chemokine activity EY975733 Toll-like receptor 8 (pufferfish) 84 (27/32) 1e-11 1 transmembrane receptor activity EY975550 CXC chemokine receptor type 3B (rainbow
trout)
66 (110/166) 1e-45 1 CXC chemokine receptor activity EY974897 CXC chemokine receptor (rainbow trout) 71 (66/92) 3e-15 1 CXC chemokine receptor activity EY975110 serum lectin isoform 3 precursor (spotted
halibut)
62 (43/69) 6e-19 1 sugar binding
EY975124 heme oxygenase 1 (European sea bass) 65 (31/47) 1e-08 1 heme oxygenase activity EY975780 natural killer-enhancing factor (Japanese
flounder)
87 (131/150) 2e-75 1 antioxidant activity
1Criteria for selection of contigs and singletons are discussed inRESULTS.2For each contig (i.e., cluster containing at least 2 ESTs), the accession number
for a representative EST is given. All contigs and singletons from this SSH library were annotated using AutoFACT (36). The additional information (e.g., functional annotations, BLASTx statistics, and GenBank accession numbers for contributing ESTs) is listed in online Supplemental Table S1A.3The top BLASTx
hit with a gene name (e.g., not “hypothetical,” “predicted,” “unnamed,” or “novel protein”) is shown. The BLASTx statistics in this table were collected on October 8, 2008, and reflect the state of the GenBank nonredundant sequence databases on that date. The length of the BLASTx alignment (i.e., the number of amino acid residues translated from the cod cDNA that are aligned with the best BLASTx hit), percent identity (% ID) over the aligned region, and E-value are shown.4Only the “molecular
samples from each of UC and ASAL group revealed that 20
and 32.5% of fish in the UC and ASAL groups, respectively,
were carriers of nodavirus (Supplemental Fig. S1). For SSH
library construction, we utilized A. salmonicida-stimulated spleen
and head kidney samples from both nodavirus carriers and
noncarriers. UC tissues were obtained only from nodavirus
negative fish. The resulting libraries, although biased toward
genes involved in the response to the bacterial antigens, may
also contain genes that are responsive to nodavirus carrier
status and stress associated with the ip injection. With respect
to immune-related genes, our selection of early time points (2,
6, 24, and 72 HPI) biased our results toward identification of
genes involved in innate immunity.
We obtained a total of 4,154 good quality ESTs including:
1,048 from the forward spleen library (designated “sb_gmnlsfas”
in Table 1, Supplemental Table S1, and the cod gene website),
1,087 from the reverse spleen library (sb_gmnlsras), 1,033
from the forward head kidney library (sb_gmnlkfas), and 986
from the reverse head kidney library (sb_gmnlkras) (Table 1;
www.codgene.ca). Our ESTs are 3⬘ biased and relatively short,
averaging 300 –500 bp in length (Table 1). The presence of
short coding sequences is in part responsible for some of the
higher E-values (up to 1e-4) reported in Tables 2–5. With the
exception of the head kidney reverse library, which showed
49.6% redundancy, the libraries were relatively complex (⬍
29% redundancy) (Table 1). Selected contiguous sequences
(contigs) and singletons from the forward spleen, reverse
spleen, forward head kidney, and reverse head kidney
li-braries are shown in Tables 2, 3, 4, and 5, respectively. These
data are limited to contigs and singletons with immune-related
functional annotations. Complete lists of assembled sequences
in these libraries, with contributing EST accession numbers
and functional annotations, are found in online Supplemental
Table S1, A (forward spleen library), B (reverse spleen library), C
(forward head kidney library), and D (reverse head kidney
li-brary).
The deepest contigs (i.e., having the highest numbers of
contributing ESTs) in the forward spleen library were
identi-fied as a small inducible cytokine (SCYA, 12 contributing
ESTs), and cathelicidin antimicrobial peptide (CAMP, 10 ESTs)
(Table 2; Supplemental Table S1A). Other contigs present in this
library were identified as ferritin heavy subunit (FTH, 5 ESTs),
ferritin middle subunit (FTM, 4 ESTs), and myeloid cell
leukemia 1 (MCL1, 3 ESTs). In the head kidney forward
library, FTM (8 ESTs), FTH (6 ESTs), CAMP (3 ESTs),
proteasome activator subunit 2 (3 ESTs), and goose-type
ly-sozyme 1 (3 ESTs) were among the most common sequences,
not including unclassified sequences (i.e., no significant
BLAST hit) and transcripts found in both forward and reverse
libraries (e.g., hemoglobin subunits) (Table 4; Supplemental
Table S1C). Although the two forward libraries shared some
transcripts in common, numerous genes were only identified in
one of the libraries. For example, transcripts identified as
SCYA, IRF1, hepcidin antimicrobial peptide (HAMP),
inter-leukin 8 (IL8), basic transcription factor 3 (BTF3),
DNA-damage-inducible transcript 4, interleukin 1 beta (IL1), and
serum lectin isoforms 1 and 2, were unique to the forward
spleen library (Table 2; Supplemental Table S1A). Transcripts
identified as proteasome activator subunit 2, translationally
controlled tumor protein, CD84 molecule, LPS binding
pro-tein, interleukin 5 receptor alpha, and inhibitor of nuclear
factor kappa B alpha, were unique to the forward head kidney
library (Table 4; Supplemental Table S1C).
Within the spleen and head kidney reverse libraries multiple
heat shock protein (HSP) transcripts were identified, including
transcripts for HSP 90. Within the reverse libraries, several
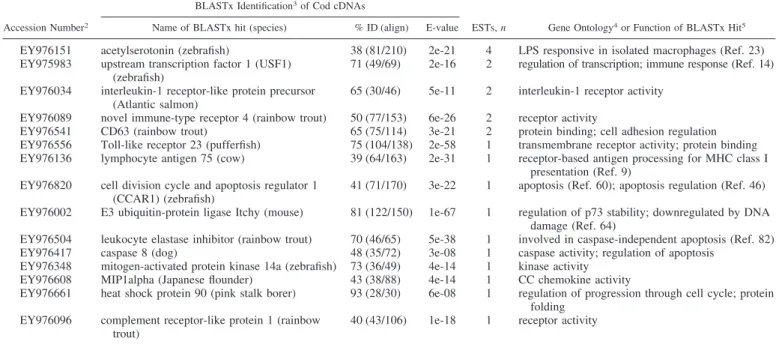
Table 3. Selected
1transcripts identified in reverse spleen SSH library (designed to be enriched for genes downregulated
by bacterial antigens)
Accession Number2
BLASTx Identification3of Cod cDNAs
ESTs, n Gene Ontology4or Function of BLASTx Hit5 Name of BLASTx hit (species) % ID (align) E-value
EY976151 acetylserotonin (zebrafish) 38 (81/210) 2e-21 4 LPS responsive in isolated macrophages (Ref. 23) EY975983 upstream transcription factor 1 (USF1)
(zebrafish)
71 (49/69) 2e-16 2 regulation of transcription; immune response (Ref. 14) EY976034 interleukin-1 receptor-like protein precursor
(Atlantic salmon)
65 (30/46) 5e-11 2 interleukin-1 receptor activity EY976089 novel immune-type receptor 4 (rainbow trout) 50 (77/153) 6e-26 2 receptor activity
EY976541 CD63 (rainbow trout) 65 (75/114) 3e-21 2 protein binding; cell adhesion regulation EY976556 Toll-like receptor 23 (pufferfish) 75 (104/138) 2e-58 1 transmembrane receptor activity; protein binding EY976136 lymphocyte antigen 75 (cow) 39 (64/163) 2e-31 1 receptor-based antigen processing for MHC class I
presentation (Ref. 9) EY976820 cell division cycle and apoptosis regulator 1
(CCAR1) (zebrafish)
41 (71/170) 3e-22 1 apoptosis (Ref. 60); apoptosis regulation (Ref. 46) EY976002 E3 ubiquitin-protein ligase Itchy (mouse) 81 (122/150) 1e-67 1 regulation of p73 stability; downregulated by DNA
damage (Ref. 64)
EY976504 leukocyte elastase inhibitor (rainbow trout) 70 (46/65) 5e-38 1 involved in caspase-independent apoptosis (Ref. 82) EY976417 caspase 8 (dog) 48 (35/72) 3e-08 1 caspase activity; regulation of apoptosis
EY976348 mitogen-activated protein kinase 14a (zebrafish) 73 (36/49) 4e-14 1 kinase activity EY976608 MIP1alpha (Japanese flounder) 43 (38/88) 4e-14 1 CC chemokine activity
EY976661 heat shock protein 90 (pink stalk borer) 93 (28/30) 6e-08 1 regulation of progression through cell cycle; protein folding
EY976096 complement receptor-like protein 1 (rainbow trout)
40 (43/106) 1e-18 1 receptor activity
1All contigs and singletons from this SSH library were annotated using AutoFACT (36). The additional information (e.g., functional annotations, BLASTx
novel transcripts with gene names and functional annotations
suggesting involvement with kinase or receptor activity were
identified such as tyrosine kinase 2, mitogen-activated protein
kinase 14a, scavenger receptor class B member 2, interleukin 1
receptor-like protein precursor (IL1R), lymphocyte antigen 75,
complement receptor-like protein 1, a novel immune-type
receptor 4, and Toll-like receptor 23 (Tables 3 and 5;
Supple-mental Table S1, B and D). In addition, transcripts with gene
names and functional annotations suggesting involvement in
apoptosis regulation (e.g., caspase 8, leukocyte elastase
inhib-itor, and cell division cycle and apoptosis regulator 1) were
identified in the reverse spleen library (Table 3, Supplemental
Table S1B).
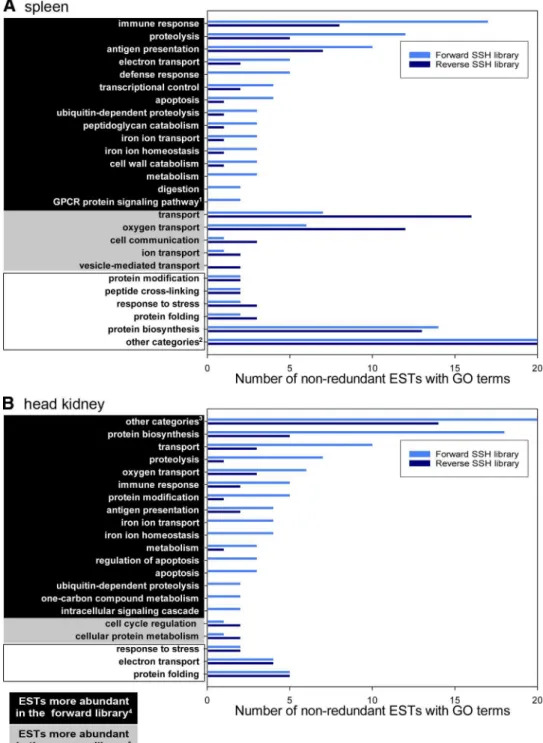
Gene ontology annotation of nonredundant transcripts from
SSH libraries.
The nonredundant ESTs from each of the SSH
libraries were assigned biological process gene ontology (GO)
terms using AutoFACT and Goblet (26) as described (59). We
were able to assign 57 and 49 GO terms for sequences from the
forward and reverse spleen library, respectively (Fig. 1A;
Supple-mental Table S3, A and B). For the forward and reverse head
kidney libraries (Fig. 1B; Supplemental Table S3, C and D), 58
and 27 GO terms were assigned, respectively. For the spleen
libraries, the highest numbers of sequences were assigned to
categories “immune response” (forward library) and “transport”
(reverse library). For the forward head kidney library, the highest
numbers of sequences were assigned to “protein biosynthesis,”
while for the reverse head kidney library, the highest numbers of
sequences were assigned to “protein biosynthesis” and “protein
folding” (Fig. 1B). In the spleen, “apoptosis”-annotated ESTs
were more abundant in the forward library (Fig. 1A), and in the
head kidney, “regulation of apoptosis” and “apoptosis” were
among the GO terms that were associated exclusively with ESTs
in the forward library (Fig. 1B). A comprehensive list of
assem-bled ESTs from these libraries, and their GO annotations, can be
found at http://ri.imb.nrc.ca/codgene/.
Gene expression patterns following injection of
formalin-killed A. salmonicida or PBS.
Nine genes (IRF1, CAMP,
HAMP, SCYA, IL1, IL8, FTH, MCL1, and BTF3) from the
forward spleen and head kidney libraries, and one gene (IL1R)
from the spleen reverse library, were subjected to QPCR to
study the magnitude and timing of their expression following
ip stimulation with formalin-killed, atypical A. salmonicida
(Fig. 2; Table 6; see Supplemental Table S4 for all relative
quantification data and calculations). These genes were
se-lected to investigate the influence of bacterial antigen
stimula-tion on the expression of genes involved in the following
biological processes: cytokine signaling (IL1, IL1R, IL8,
SCYA, and IRF1); apoptosis (BTF3, MCL1); iron homeostasis
(FTH and HAMP); and antibacterial defense response (CAMP
and HAMP). The CAMP QPCR was designed to study the
overall expression of cathelicidin transcripts (i.e., all known
paralogs) by utilizing primers in conserved regions (i.e.,
com-mon to all cathelicidin-like ESTs represented in these SSH
libraries).
The genes IRF1, CAMP, HAMP, and SCYA showed similar
patterns of expression in the spleen and head kidney samples from
the ASAL group, with highest levels of expression at 24 HPI,
followed by a large reduction in expression by 72 HPI (Fig. 2,
A–H
). Of these, at 72 HPI, only CAMP had significantly higher
expression in tissues (both spleen and head kidney) of A.
salmo-Table 4. Selected
1transcripts identified in forward head kidney SSH library (designed to be enriched for genes upregulated
by bacterial antigens)
Accession Number2
BLASTx Identification3of Cod cDNAs
ESTs, n Gene Ontology4or Function of BLASTx Hit5 Name of BLASTx hit (species) % ID (align) E-value
EY972828 ferritin middle subunit (Atlantic salmon) 81 (127/155) 2e-65 8 ferroxidase activity; iron ion homeostasis; oxidoreductase activity
EY972657 ferritin heavy subunit (Atlantic salmon) 90 (158/174) 3e-89 6 ferroxidase activity; iron ion homeostasis; oxidoreductase activity
EY973285 proteasome activator subunit 2 (common carp)
71 (113/158) 4e-45 3 antigen cleavage and presentation (Ref. 73) EY972595 cathelicidin 1 (Atlantic cod) 98 (117/119) 3e-62 3 defense response
EY972694 cathepsin L (Japanese ricefish) 77 (98/126) 2e-58 3 antigen processing (Ref. 90) EY972725 goose-type lysozyme 1 (Atlantic cod) 97 (143/146) 3e-73 3 lysozyme activity
EY973198 translationally controlled tumor protein (common carp)
66 (104/156) 8e-55 2 B cell growth factor (Ref. 32); interleukin production (Ref. 7)
EY972718 probable Bax inhibitor 1 (Japanese flounder) 88 (105/118) 9e-54 2 negative regulation of apoptosis EY972894 cellular FLICE-like inhibitory protein (pig) 63 (26/41) 4e-07 1 caspase activity; regulation of apoptosis EY972979 cyclin L1 (African clawed frog) 96 (24/25) 8e-07 1 cell division
EY972692 myeloid cell leukemia sequence 1b (zebrafish)
46 (49/106) 1e-16 1 negative regulation of apoptosis (Ref. 42)
EY972562 CD84 (mouse) 26 (48/180) 1e-05 1 lymphocyte proliferation, macrophage activation (Ref. 79) EY972791 Src family-associated phosphoprotein 2
(Skap2) (Astatotilapia burtoni)
65 (78/120) 6e-25 1 regulation of leukocyte adhesion (Ref. 81) EY973092 lipopolysaccharide-binding protein variant b
(Atlantic cod)
98 (94/95) 6e-37 1 LPS binding (Ref. 76) EY973172 interleukin 5 receptor-␣ (rat) 25 (32/124) 2e-06 1 interleukin-5 receptor activity EY972529 inhibitor of nuclear factor-B ␣ (rainbow
trout)
88 (23/26) 7e-05 1 LPS-inducible (Ref. 68) EY972872 complement receptor-like protein 1
precursor (rainbow trout)
44 (34/76) 8e-15 1 receptor activity
1All contigs and singletons from this SSH library were annotated using AutoFACT (36). The additional information (e.g., functional annotations, BLASTx
nicida
-stimulated animals compared with PBS controls (Fig. 2, C
and D). The proinflammatory cytokines IL1 and IL8 had similar
patterns of expression in the spleen and head kidney of stimulated
animals. In both tissues, there were significantly higher levels of
expression for both of these genes at 2 and 6 HPI in ASAL
individuals compared with the PBS controls (Fig. 2, I–L).
Maxi-mum expression of these genes relative to their appropriate 0 h
controls occurred at 6 HPI [IL1 (684.3 fold) and IL8 (33.8-fold)
for spleen; IL1 (356.3-fold) and IL8 (70.6-fold) for head kidney]
after which time levels of expression declined (Fig. 2, I–L).
Expression of FTH was highest at 24 HPI in spleens from
ASAL individuals (Fig. 2M). Levels of FTH expression in head
kidney were similar in magnitude between the PBS and ASAL
groups and there was no trend in FTH expression over time in
either group (Fig. 2N). Levels of MCL1 expression were
relatively low and similar in magnitude between spleen and
head kidney samples (Fig. 2, O–P). In addition, there were no
trends in expression over time in either tissue. Expression of
MCL1 was significantly higher in spleens from ASAL
indi-viduals compared with PBS controls at 6 and 24 HPI but
significantly lower at 72 HPI (Fig. 2O). Head kidneys from
stimulated animals had significantly higher levels of expression
compared with the PBS controls at 6 h, but significantly lower
levels of expression before stimulation (0 h control) and at 72
HPI (Fig. 2P). Two genes selected for QPCR studies from the
spleen SSH libraries (BTF3 and IL1R) were not significantly
dysregulated by A. salmonicida stimulation (data given in
Supplemental Table S4, Q–R, but not presented in Fig. 2).
We also examined whether the presence of nodavirus, as
detected by RT-PCR in brain samples, had an effect on
con-stitutive expression of these 10 genes in spleen and head
kidney. For both immune tissues, there was no significant
effect of nodavirus carrier status on the constitutive expression
of these genes (data not shown).
Characterization and phylogenetic analysis of Atlantic cod
IRF1.
The putative translation of one EST from the spleen
forward SSH library (EY975211) shared 40% identity to the
IRF1 of snakehead (Channa argus) over 103 aligned AAs
(GenBank accession number ABN42504). Additional sequence was
obtained from this transcript by 5⬘RACE (807 bp) and 3⬘RACE
(680 bp) using mRNA from the spleens of A.
salmonicida-stimulated fish. These sequences were assembled to generate a
1,465 bp cDNA sequence that encodes a 306-AA protein. The
Atlantic cod IRF1 sequence characterized in this study was
deposited in GenBank under accession number FJ346564.
Structural modeling of Atlantic cod IRF1 shows that its DNA
binding domain (DBD) consists of three ␣-helixes, four
-sheets, and three long loops (see Supplemental Fig. S2A for
detailed information). Alignment of IRF1 amino acid
se-quences from Atlantic cod (deduced protein sequence) and
several other vertebrate species shows that the sequences all
contain a highly conserved (⬎60% identity; Supplemental
Table S5) DNA binding domain at the NH
2terminus with six
conserved tryptophan repeats (Supplemental Fig. S2B).
Over-all, the Atlantic cod IRF1 amino acid sequence is 42–55%
identical to the IRF1 orthologs of other teleosts, and 34 –37%
identical to IRF1 orthologs from nonteleost vertebrates
(Sup-plemental Table S5). A phylogenetic tree whose construction is
based on the IRF1 multiple sequence alignment shows that the
Atlantic cod IRF1 is distinct from other teleost IRF1 orthologs
(Supplemental Fig. S2C).
DISCUSSION
Subspecies of the Gram-negative bacterium A. salmonicida
are the causative agents of a serious disease in Atlantic cod (61,
67) and many other fishes (40, 54, 62). This disease is
classi-fied as either typical furunculosis, caused by A. salmonicida
subsp. salmonicida or atypical furunculosis, caused by atypical
variants of A. salmonicida. To date, a number of studies have
examined the transcriptional response of salmonids challenged
or vaccinated with the typical subspecies (A. salmonicida
subsp. salmonicida) (19, 22, 47, 51). In addition, the immune
response of zebrafish to challenge with the related species
Aeromonas hydrophila
has also been recently examined in
detail (63). In this study we used an atypical variant of
Aeromonas salmonicida
that was obtained from an atypical
furunculosis outbreak in Atlantic cod. To identify and
charac-terize genes with transcriptional changes related to the early
immune response (2–72 h) to bacterial antigens, we ip injected
Atlantic cod with formalin-killed, atypical A. salmonicida and
constructed, sequenced, and characterized reciprocal SSH
li-Table 5. Selected
1transcripts identified in reverse head kidney SSH library (designed to be enriched for genes
downregulated by bacterial antigens)
Accession Number2
BLASTx Identification3of Cod cDNAs
ESTs, n Gene Ontology4or Function of BLASTx Hit5 Name of BLASTx hit (species) % ID (align) E-value
EY973973 cyclin B2 (rainbow trout) 51 (82/158) 4e-30 5 regulation of progression through cell cycle EY974252 TRAF4-associated factor 1 (human) 30 (45/147) 6e-08 4 signal transduction; downregulated in nitric
oxide-exposed human monocytic cells (Ref. 84) EY974460 tyrosine kinase 2 (human) 67 (66/98) 1e-32 2 Signal transduction; Jak-STAT signaling pathway EY974533 heat shock 60 kDa protein 1 (chicken) 57 (57/100) 4e-25 2 response to stress
EY974525 heat shock 90 kDa protein 1 -isoform b (rainbow trout)
98 (98/100) 8e-49 2 response to stress EY974305 scavenger receptor class B member 2 (cow) 50 (45/90) 1e-23 1 receptor activity
EY974340 HSP90 co-chaperone Cdc37 (green pufferfish) 74 (117/157) 3e-43 1 regulation of cell cycle; protein folding EY974279 cathepsin B (Atlantic halibut) 46 (31/66) 8e-07 1 regulation of catalytic activity; cysteine-type
endopeptidase activity
EY974635 cytochrome P450 (European sea bass) 60 (89/146) 2e-48 1 monooxygenase activity; iron ion binding; oxidoreductase activity; heme binding
1All contigs and singletons from this SSH library were annotated using AutoFACT (36). The additional information (e.g., functional annotations, BLASTx
braries for the spleen and head kidney. From these libraries, we
generated 4,154 ESTs that have enabled us to identify a large
number of immune-related genes for which sequence
informa-tion was previously not available for Atlantic cod.
Functional annotation and analysis of the ESTs generated
from the SSH libraries revealed that the killed-A. salmonicida
stimulation induced changes in the expression profiles of genes
involved in a variety of physiological processes in spleen and
Fig. 2. QPCR analyses of selected genes identified in the SSH libraries. Gene expression data are presented as means (⫾ SE). RQ (relative quantity) values were normalized to 18S ribosomal RNA and calibrated to the individual with the lowest gene of interest expression. Within each gene of interest study, identical letters [uppercase for Aeromonas salmonicida-treated (ASAL) gene expression data, lowercase for saline-injected control (PBS) data] indicate no significant difference (P ⬎ 0.05) between the groups at the different time points postinjection. *Significant (P ⱕ 0.05) differences between A. salmonicida-treated and saline-injected control groups at a particular time point. For each condition and time point (e.g., ASAL, 24 h), fold upregulation was calculated as (average RQ)/(average RQ for the appropriate 0 h control group), and fold downregulation where appropriate was calculated as the inverse of fold upregulation. Fig. 1. Gene classification of spleen (A) and
head kidney (B) reciprocal suppression sub-tractive hybridization (SSH) libraries of At-lantic cod based on Gene Ontology (GO) (biological process terms). GO annotations were obtained using AutoFACT and Goblet analysis of clusters. For the complete lists of GO annotations by biological process, see Supplemental Table S3, A–D. Superscripts:
1G protein-coupled receptor (GPCR) protein
signaling pathway.2For the spleen SSH
li-braries, “other categories” include 33 and 28 assembled expressed sequence tags (ESTs) with GO biological process terms in the forward and reverse libraries, respectively.
3For the head kidney SSH libraries, “other
categories” include 38 and 14 assembled ESTs with GO biological process terms in the forward and reverse libraries, respec-tively. 4For a given GO biological process
term, if the number of ESTs present in the forward SSH library was 2 and/or 50% more than in the reverse SSH library.5For a given
GO biological process term, if the number of ESTs present in the reverse SSH library was 2 and/or 50% more than in the forward SSH library. For a given GO biological process term, if the difference between the numbers of ESTs present in the SSH libraries was ⬍2 and/or 50% of the smaller number.
head kidney. In addition to the physiological processes directly
linked to the innate antibacterial immune response, such as
antimicrobial peptide synthesis, chemotactic signaling,
regula-tion of iron homeostasis, antigen processing and presentaregula-tion,
and complement pathway, other processes appeared to be
dys-regulated by the A. salmonicida stimulation including regulation
of apoptosis, protein synthesis, proteolysis, DNA-dependent
transcription, and stress response. Using QPCR with individual
fish tissue templates (to assess biological variability), we
in-vestigated the expression of nine genes in the forward libraries
with functional annotations representing a subset of these
physiological processes.
One Atlantic cod contiguous sequence (contig) containing 2
ESTs from the forward spleen SSH library (enriched for genes
upregulated by bacterial antigens) had significant homology to
the IRF1 of snakehead (Channa argus), and we obtained the
full-length cDNA sequence using 5⬘ and 3⬘RACE. The
Atlan-tic cod IRF1 is encoded by an ORF of 921 bp that translates to
306 AA residues. This deduced protein sequence has ⬃35 and
45% identity to the human (Homo sapiens) and rainbow trout
(Oncorhynchus mykiss) IRF1s, respectively (Supplemental
Ta-ble S5). Phylogenetic analysis placed Atlantic cod IRF1
se-quence near to the branching point of the group containing
IRF1 from snakehead and Chinese perch (Siniperca chuatsi).
Structural modeling of Atlantic cod putative IRF1 DBD
sug-gests the presence of three ␣-helixes, four -sheets, and three
long loops, which is consistent with the structure of human
IRF1 (18). Therefore, based on its amino acid identity, the
results of the phylogenetic analysis, and structural modeling,
we are confident that this sequence encodes the Atlantic cod
IRF1 protein. Furthermore, the conserved DBD in Atlantic cod
IRF1 suggests that it may have similar function and recognize
similar DNA motifs (i.e., the interferon simulated response
elements) as its human ortholog.
Most studies on fish have examined patterns of IRF1
ex-pression following polyriboinosinic polyribocytidylic acid
(pIC)-stimulation or virus challenge (13, 30, 55, 59, 77, 89).
There are few reports of IRF1 expression in fish following
stimulation with bacteria or bacterial antigens. Yabu et al. (89)
demonstrated induction of an interferon regulatory factor in the
liver of Japanese flounders following intramuscular injection
with Edwardsiella tarda. Although these authors could not
determine whether their sequence encoded IRF1 or IRF2 due to
lack of representative sequences from fish, our more recent
BLASTx analysis of their sequence shows homology to other
IRF1 sequences (Supplemental Fig. S2). However, Collet and
Secombes (13) reported that IRF1 expression was induced only
by pIC and not by LPS in rainbow trout gonad cells. More
recently, Ordas et al. (55) described the IRF1 from turbot
(Scophthalmus maximus) and seabream (Sparus aurata). In
these species, IRF1 was reported to have low levels of
consti-tutive expression in a variety of tissues, and its expression was
induced by pIC stimulation and viral hemorrhagic septicemia
virus challenge. However, the increase in IRF1 expression in
head kidney of turbot following Vibrio pelagius challenge was
not statistically significant at the single time point they studied
(8 h postchallenge). In our study, Atlantic cod IRF1 was
constitutively expressed at low levels, and expression was
significantly elevated in spleen and head kidney at 24 h
following A. salmonicida stimulation, with highest levels of
induction being observed in the spleen. In fish, the target genes
of IRF1, as well as its importance in innate immune responses,
are yet to be determined. However, in rainbow trout, the
expression of IRF1 in macrophages can be induced by both
IFN-␥ and IL1, with IFN-␥ being a much more potent inducer
of IRF1 than IL1 (48). As both IFN-␥ and IL1 are known to
be induced in fish following a challenge with bacterial
anti-gens, it appears that similar pathways to those of higher
vertebrates exist in fish (10, 12).
Chemotactic cytokines are directly involved in leukocyte
trafficking and play an important role in the innate immune
response. Interleukin 8, a CXC chemokine ligand (CXCL), was
Table 6. Primers used for QPCR
Primer Name1 QPCR Oligonucleotide Sequences (5⬘-3⬘) Gene Name of the Top BLASTx Hit Amplicon Size, bp Efficiency,2%
CAMP-f ATTGCAATTTCACCCTGAGC cathelicidin 118 94
CAMP-r CCAGACCTGCTCCTTCTCAC
IL8-f CCAATCTGACGGCTCTCTGT interleukin 8 116 103
IL8-r ATCGGCTCCCTACTGGTTCT
FTH-f TCGAGAAAGTGGGTCTCGAT ferritin heavy subunit 168 97
FTH-r AGACGTCAGGAAGCCAGAAA
IRF1-f AGAAGGACGCCAGTCTGTTCAA interferon regulatory factor 1 100 86
IRF1-r GCGGAAGTTGGCTTTCCATT
SCYA-f CTCAAACCTCTGCATCGTCA small inducible cytokine SCYA 188 96
SCYA-r CACGGAGAGGTAAGCAGCTC
IL1R-f ACATCATGCAGCGCTTCTC interleukin 1 receptor-like precursor 101 86
IL1R-r TTTGCCCTCAAGGTCCTG
IL1-f ACAGGAAGTGCACCATGTCA interleukin 1 107 95
IL1-r GTCGTGCACACAGAAAGCAG
MCL-f CGCAGACAGCACAACAAACT myeloid cell leukemia sequence 1 102 101
MCL-r GACACGCAGCCTTCTTTACC
HAMP-f CCACAGGCTCCTCTCAAGTC hepcidin 146 89
HAMP-r CTGCAACTGCAATGCTGAAT
BTF3-f AGCTCGGCGTCAACAATATC basic transcription factor 3 159 89
BTF3-r GCATCTCTGTCAGCTGCTTG
18S-f ATGGCCGTTCTTAGTTGGTG 18S ribosomal RNA (normalizer gene) 180 109
18S-r GGACATTTAAGGGCGTCTCA
1Primer direction is denoted by “f” or “r” following the gene name for forward or reverse, respectively.2The calculation of amplification efficiency using a