Publisher’s version / Version de l'éditeur:
Vous avez des questions? Nous pouvons vous aider. Pour communiquer directement avec un auteur, consultez la
première page de la revue dans laquelle son article a été publié afin de trouver ses coordonnées. Si vous n’arrivez pas à les repérer, communiquez avec nous à PublicationsArchive-ArchivesPublications@nrc-cnrc.gc.ca.
Questions? Contact the NRC Publications Archive team at
PublicationsArchive-ArchivesPublications@nrc-cnrc.gc.ca. If you wish to email the authors directly, please see the first page of the publication for their contact information.
https://publications-cnrc.canada.ca/fra/droits
L’accès à ce site Web et l’utilisation de son contenu sont assujettis aux conditions présentées dans le site LISEZ CES CONDITIONS ATTENTIVEMENT AVANT D’UTILISER CE SITE WEB.
ITSC2010: International Thermal Spray Conference and Exposition 2010
[Proceedings], 2010-05-03
READ THESE TERMS AND CONDITIONS CAREFULLY BEFORE USING THIS WEBSITE.
https://nrc-publications.canada.ca/eng/copyright
NRC Publications Archive Record / Notice des Archives des publications du CNRC :
https://nrc-publications.canada.ca/eng/view/object/?id=3c2add84-8627-413e-8890-1ee1d36e0d72 https://publications-cnrc.canada.ca/fra/voir/objet/?id=3c2add84-8627-413e-8890-1ee1d36e0d72
NRC Publications Archive
Archives des publications du CNRC
This publication could be one of several versions: author’s original, accepted manuscript or the publisher’s version. / La version de cette publication peut être l’une des suivantes : la version prépublication de l’auteur, la version acceptée du manuscrit ou la version de l’éditeur.
Access and use of this website and the material on it are subject to the Terms and Conditions set forth at
Deposition of NiO/YSZ composite and YSZ by suspension plasma
spray on porous metal
Deposition of NiO/YSZ composite and YSZ by suspension plasma spray on porous metal
Y. Wang, J.-G. Legoux, Boucherville/CA; R. Neagu, R. Hui, R. Maric, Vancouver/CA; B. R. Marple , Boucherville/CA
The use of a liquid feedstock carrier in suspension plasma spray (SPS) permits injection of fine powders, providing the possibility of producing sprayed coatings that are both thin and dense and have fine microstructures. These characteristics make SPS an attractive process for depositing highly efficient electrodes and electrolytes for solid oxide fuel cell (SOFC) applications. In the present study, NiO-yttria stabilized zirconia (YSZ) anode and YSZ electrolyte half cells were successfully deposited on porous Hastelloy X substrates by SPS. The NiO-YSZ anode deposition process was optimized by design of experiment. The YSZ electrolyte spray process was examined by changing one parameter at a time. The results from the design-of-experiment trials indicate that the porosity of the as-deposited coatings increased with an increase of suspension feed rate while it decreased with an increase of total plasma gas flow rate and standoff distance. The deposition efficiency increased with an increase of total plasma gas flow rate, suspension feed rate and standoff distance. The microstructure examination by SEM shows that the NiO and YSZ phases were homogeneously distributed and that the YSZ phase had a lamellar structure. It was observed that the density of the YSZ electrolyte layer increased as input power of the plasma torch increased.
1 Introduction
A solid oxide fuel cell (SOFC) is a highly efficient and clean energy conversion ceramic device that produces electricity by reaction of a fuel gas with an oxidant gas electrochemically. The basic physical structure of a fuel cell consists of a dense and gastight electrolyte layer in contact with a porous anode and cathode on either side. A composition consisting of 8 mole% yttria stabilized zirconia (8YSZ) has been commonly used as electrolyte material due to its high ionic conductivity at high temperature. Because single phase oxide material for anode application has not been developed successfully, cermets of Ni/YSZ are the most common anode materials used for SOFC applications. These cermets, in which YSZ provides ionic conduction and Ni provides electronic conduction, are attractive because of their relatively high electrochemical catalytic activity and reasonable cost.
A wide range of SOFC manufacturing processes, such as tape casting and screen printing for planar designs, and slip casting and extrusion for tubular designs, have been investigated by researchers around the world [1]. Thermal plasma spray methods have been applied to the production of SOFC components for more than forty years, e.g., to produce the electrode-electrolyte assembly of SOFCs by plasma spray [2]. Among the different fabrication technologies, thermal spray shows a high potential for becoming an economic and high quality production process for SOFCs, since it avoids the expensive and time-consuming sintering process that must be used by most other SOFC fabrication methods [3]. However, it is difficult to produce the thin (<20 μm), fully dense layers required for SOFC electrolyte application by conventional powder plasma spraying, as plasma spray feedstock powder particles are typically between approximately 10 and 100 μm in diameter. In addition, the larger splats in conventional plasma sprayed coatings reduce the density of three-phase boundaries that are beneficial in the SOFC
electrode application. As well, the lamellar microstructure of coatings formed by large splat stacking in conventional plasma spray will generate large residual defects and thermal stresses in SOFC components. All these features will negatively affect SOFC performance.
Suspension plasma spray (SPS), developed in recent years [4], injects a suspension of the desired material into the plasma jet by an atomizing gas or high pressure. Because a liquid feedstock is employed as carrier, SPS permits the use of finer powders, on the nano or submicron scale, than conventional thermal spraying. In SPS, heat and momentum transfer from the plasma to the suspension droplets leads to fragmentation and acceleration of the suspension droplets, the evaporation and/or combustion of the solvent, and condensation and/or melting of the suspension materials, resulting in the formation of a coherent deposit. The splats produced by SPS are much smaller than those of conventional plasma spray [5, 6], providing the possibility of producing
sprayed coatings that are both thin and dense and have fine microstructures. The smaller splats in suspension plasma sprayed porous coatings will increase the occurrence of three-phase boundaries in the electrode, a result that can be advantageous for performance in SOFC applications. The dense coatings produced by SPS have a much more homogeneous microstructure, and no splat stacking can be observed [7, 8], which is desirable for the electrolyte in SOFC applications. In brief, the SPS process has the potential to deposit highly efficient electrodes and electrolytes for SOFCs.
In our previous work, SOFCs based on a Sm-doped ceria (SDC) electrolyte and a NiO-SDC anode have been successfully fabricated by SPS [9-10]. In this work, deposition of porous Ni-YSZ anodes and dense YSZ electrolytes on porous Hastelloy has been demonstrated by SPS using an axial injection plasma torch. The porous Ni-YSZ anode deposition process was optimized by a design-of-experiment technique.
The parameters for dense YSZ electrolyte deposition were selected by changing one parameter at a time in order to identify the optimum deposition conditions. After selection of optimized conditions, anode and electrolyte half-cells were produced and the deposited coatings characterized by SEM.
2 Experimental Procedure 2.1 Suspension Spray Setup
Suspension plasma spray was carried out by using an axial injection plasma torch (Mettech Axial III, Northwest Mettech Corp., North Vancouver, BC, Canada). An internal injection and twin-fluid atomization module was installed in the plasma torch for atomization of suspension liquid into droplets and injecting them into the plasma jet axially. With this design, the suspension droplets are fully entrained in the three encircling plasma jets of the Mettech Axial III torch. Such a configuration can increase the transfer of heat and momentum from the plasma jets to the injected droplets. The suspension was transported into the plasma jet by a prototype feeder (Nanofeed Liquid Powder Feeder, Model 640, Northwest Mettech, North Vancouver, Canada), which enables automatic computer control of the suspension flow rate, start-up, shut-down and rinsing. Nitrogen, at a flow rate of 10 slpm, was used as the atomizing gas. A factorial design of experiment was employed to optimize the NiO/YSZ anode deposition process. Based on preliminary trials, total plasma gas flow rate, suspension feed rate and standoff distance (defined as the distance between the torch nozzle exit and the substrate) were selected as critical parameters in the design of experiment for NiO-YSZ anode deposition, as shown in columns 2-4 in Table 1. Eleven spray
conditions, as listed in columns 2-5 in Table 2, were
used to optimize the YSZ electrolyte deposition process by changing values for plasma torch power input, suspension flow rate, suspension concentration, and standoff distance one at a time. These parameters were selected based on preliminary trials.
The temperature and velocity of in-flight particles in these SPS trials were measured with a commercial diagnostic system (AccuraSpray® G2, Tecnar, St-Bruno, QC, Canada). During the measurement, the sensor of the AccuraSpray® G2 was focused on the center of the plasma jet at the location where the substrate would be positioned during deposition.
The substrates were held on an internally water-cooled substrate support. Air-forced jets were used to cool the front surface of substrate. The substrate temperature was measured by using an optical pyrometer.
2.2 Suspensions and Substrates
A suspension containing 9 wt% of a solids mixture comprised of NiO (fuelcellmaterials.com, Lewis
Center, Ohio, USA) and YSZ (Inframat® Advanced Materials, Farmington, CT, USA) in 30 wt% ethylene glycol and 70 wt% ethanol was used in anode deposition. The percentages of NiO and YSZ in the solid mixture were 55 wt% and 45 wt%, respectively. After reducing NiO to Ni, the anode was expected to contain 40 vol. % Ni and 60 vol. % YSZ. In order to produce high porosity in the fabricated coating, a NiO powder having a relatively large particle size, with a d50 of 14.4 µm and a specific surface area of 0.21 m2/g, was employed. The YSZ powder had a d50 of 0.5 µm and specific surface area of 40 m2/g. In the electrolyte deposition, suspensions containing 3 wt%, 5 wt% and 7 wt% YSZ nano powder (Inframat® Advanced Materials, Farmington, CT, USA) in 70 wt% ethylene glycol and 30 wt% ethanol were employed. The YSZ nano powder had a d50 of 30-60 nm and a specific surface area of 15-40 m2/g. All the suspensions were prepared with the addition of polyethylenimine (MWT 25,000 Alfa Aesar, USA) as dispersing agent.
Tape cast and sintered Hastelloy X plates with a porosity of 25.7% (Mott Corp., Farmington, CT, USA) were used as substrates and served as the supporting layer for the SOFCs. Hastelloy X is a Ni-Cr-Fe-Mo alloy with high oxidation resistance.
Table 1. Experiment design matrix for NiO-YSZ anode
deposition. No Total Gas Feed Rate Standoff Distance Thickness /Pass Porosity l/min kg/h cm µm % 1 225 2 5.1 0.40 3.3 2 275 2 5.1 0.69 1.1 3 225 3 5.1 0.56 5.5 4 275 3 5.1 0.86 2.8 5 225 2 6.4 0.74 1.7 6 275 2 6.4 0.71 1.0 7 225 3 6.4 0.90 3.5 8 275 3 6.4 0.99 2.4
Table 2. Spray parameters for YSZ electrolyte
deposition and the porosity level of the coatings.
No Power Standoff Distance Feed Rate Suspension Concentration T V Porosity kW cm kg/h wt% oC m/s % 1 93 5.1 2 3 3105 638 2.5 2 93 5.1 2 5 3074 637 0.8 3 93 6.4 2 5 3058 596 2.3 4 95 5.1 2 3 3055 777 0.4 5 95 5.1 2 5 2993 778 0.6 6 95 6.4 2 5 2977 719 0.4 7 108 5.1 2 3 3092 794 0.4 8 108 5.1 2 5 3047 787 0.1 9 108 6.4 2 5 3033 737 0.3 10 108 6.4 2.5 5 2971 720 0.4 11 108 6.4 2 7 3031 741 0.2 2.3 Coating Characterization
The coating microstructures were examined by scanning electron microscope (SEM) (JSM-610, JEOL Tokyo, Japan) and field-emission scanning electron microscope (FE-SEM) (S4700, Hitachi, Tokyo, Japan). The samples were prepared by standard
metallo-raphic methods to produce a polished cross section. To determine the phases present, X-ray diffraction (XRD) analyses (Bruker D8 Advance Diffractometer (equipped with a Våntec Detector), Karlsruhe, Germany) were performed on as-deposited coatings using Cu Kα radiation. Porosity was measured on the polished cross-section by SEM (600X for anode and 5000X for electrolyte) using image analysis. Fifteen measurements for anode coatings and ten measurements for electrolyte coatings were averaged per sample.
3. Results and Discussion 3.1 Anode Deposition
3.1.1 Spray Parameters for NiO-YSZ Deposition
The microstructure requirement for anode operation is 30%-40% porosity to facilitate fuel gas and reaction product transport, and provide the reaction sites (three-phase boundaries) required for electrode chemical reaction [11]. To produce porous anodes, a relatively low plasma torch power (61-67 kW) with a secondary plasma gas containing 30% helium, to generate lower plasma temperature and less efficient heating of injected feedstock, were used in this work. In addition, NiO powder was employed, instead of Ni, in the Ni-YSZ anode deposition process. It was expected that, after reduction of the NiO, 23% additional porosity could be created in the anode layer.
To identify conditions for producing coatings with a porosity level suitable for the SOFC anode application at a high deposition efficiency, a factorial design of experiment was used to optimize the anode deposition process [12]. Total plasma gas flow rate, suspension flow rate and standoff distance were selected as the critical factors because of their importance in deciding the responses, i.e., coating porosity and deposition efficiency [13-15]. As shown in Table 1, two levels were used for each factor and
eight coatings were deposited for the experiment design. For a given gas composition and power setting, the total plasma gas flow rate determines the velocity and temperature of the plasma jet [15]; therefore, it will affect the microstructure of fabricated coatings. For a given system, the size and density of generated particles in the plasma jet are determined by the suspension flow rate, which greatly influences the deposition process [13-15]. Since the small particles generated in SPS carry little momentum and low thermal inertia, relatively short standoff distances (5.08 and 6.35 cm) were identified as being appropriate in preliminary trials.
The two responses, i.e., deposition efficiency (Thickness/Pass) and Porosity, were measured by SEM to increase the accuracy. The values for Thickness/Pass, defined as the increase in coating thickness per pass of the spray jet, and the Porosity,
representing the as-deposited NiO-YSZ coating’s porosity measured at a magnification of 600 by SEM, are presented in Table 1. As shown in the table,
values for the deposition efficiency are between 0.40 µm/pass and 0.99 µm/pass and the as-deposited NiO-YSZ coatings have porosity levels between 1.0% and 5.5%. After reducing the NiO to Ni, the anode layer porosity level is expected to be 24%-28.5%.
Fig. 1 shows back-scattered SEM images of the
microstructures of the as-deposited NiO-YSZ coatings (a) and the reduced Ni-YSZ anodes (b). It can be seen in Fig. 1 (a) that there are two phases, as
represented by the light- and dark-grey regions, in the as-deposited coating. EDX analysis indicates that the white phase is YSZ and the dark phase is NiO. Fig. 1
(a) shows that the distribution of the YSZ and NiO phases is relatively homogeneous and that the YSZ phase has a lamellar structure. Fig. 1 (b) indicates
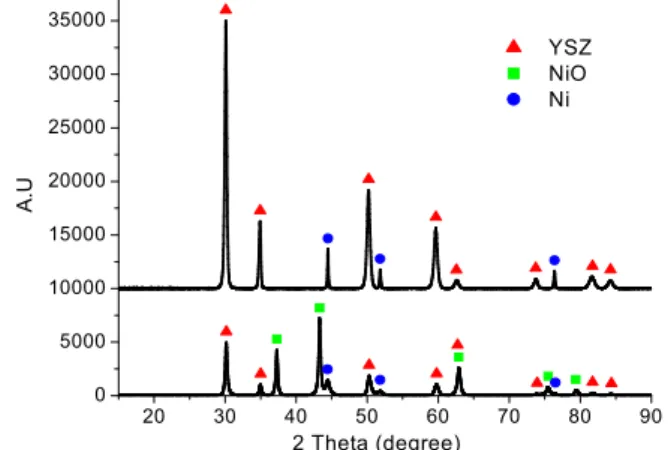
that the reduced coatings are porous and the pore distribution is homogeneous. The XRD spectrum of the anode layer (lower spectrum of Fig. 2) shows the
presence of well crystallized cubic zirconia, cubic NiO and metallic nickel. The presence of metallic nickel is the result of the partial reduction of NiO in the hydrogen-rich plasma environment or may originate from the Ni signal in the Hastelloy X substrate given the ~30 µm thickness of the anode layer.
(a) (b)
Fig. 1. SEM images of the NiO-YSZ (a) and the
reduced Ni-YSZ anodes (b) deposited at optimized conditions. 20 30 40 50 60 70 80 90 0 5000 10000 15000 20000 25000 30000 35000 A. U 2 Theta (degree) YSZ NiO Ni
Fig. 2. XRD of as deposited coatings (anode:lower
3.1.2 Results of Experiment Design for NiO-YSZ Anode Deposition
The measurement results of deposition efficiency and porosity were analyzed by a commercial experiment design software (Design Expert 7.1.6) [16]. The software can calculate the half-normal plot and ANOVA (analysis of variance) of the responses [12].
Fig. 3 shows the half-normal plot of response,
deposition efficiency (Thickness/Pass). If the estimates of the main factor effects and the effects of interactions have no influence on the responses, the points will fall approximately on a straight line passing through the origin in the figure. By contrast, points that fall well off the line to the right at the top would indicate the existence of real effects [12]. Therefore, the half-normal plot in Fig. 3 suggests that changes in
main factors A (total gas flow), B (suspension feed rate) and C (standoff distance), and the interaction between factors A (total gas flow) and C (standoff distance) have significant effects on the measured response (Thickness/Pass). According to the ANOVA analysis by the software, the deposition efficiency can be expressed by the following equation:
Thickness/Pass = 0.73 + 0.081 A + 0.096B + 0.10C - 0.065AC (1)
The equation indicates that the Thickness/Pass increases with the increase of total plasma gas flow rate, suspension feed rate and standoff distance and it decreases as the interaction between total gas flow rate and standoff distance increases. The half-normal plot of Porosity (not presented) showed that the total gas flow rate, suspension feed rate and standoff distance had a significant effect on coating porosity. The porosity of the as-deposited coatings can be written as
Porosity = 2.66 - 0.84A + 0.89B - 0.51C + 0.39AC (2)
Equation (2) shows that the porosity of the as-deposited coatings is linearly proportional to the suspension feed rate (B) and to the interaction between total plasma gas flow (A) and standoff distance (C) while it decreases with the increase of total plasma gas flow (A) and standoff distance (C).
Within the experimental area in which NiO-YSZ deposits can be produced, the deposition process was optimized by the experiment design software based on
Fig. 3. Half-normal plots for deposition efficiency. Table 3. Optimized parameter combinations for NiO
and YSZ anode deposition.
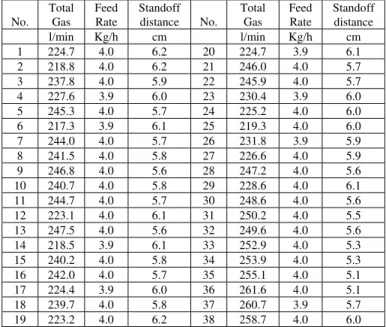
No. Total Gas Feed Rate Standoff distance No. Total Gas Feed Rate Standoff distance l/min Kg/h cm l/min Kg/h cm 1 224.7 4.0 6.2 20 224.7 3.9 6.1 2 218.8 4.0 6.2 21 246.0 4.0 5.7 3 237.8 4.0 5.9 22 245.9 4.0 5.7 4 227.6 3.9 6.0 23 230.4 3.9 6.0 5 245.3 4.0 5.7 24 225.2 4.0 6.0 6 217.3 3.9 6.1 25 219.3 4.0 6.0 7 244.0 4.0 5.7 26 231.8 3.9 5.9 8 241.5 4.0 5.8 27 226.6 4.0 5.9 9 246.8 4.0 5.6 28 247.2 4.0 5.6 10 240.7 4.0 5.8 29 228.6 4.0 6.1 11 244.7 4.0 5.7 30 248.6 4.0 5.6 12 223.1 4.0 6.1 31 250.2 4.0 5.5 13 247.5 4.0 5.6 32 249.6 4.0 5.6 14 218.5 3.9 6.1 33 252.9 4.0 5.3 15 240.2 4.0 5.8 34 253.9 4.0 5.3 16 242.0 4.0 5.7 35 255.1 4.0 5.1 17 224.4 3.9 6.0 36 261.6 4.0 5.1 18 239.7 4.0 5.8 37 260.7 3.9 5.7 19 223.2 4.0 6.2 38 258.7 4.0 6.0
the analyses described in previous sections. The criteria for the optimization process were based on the microstructure requirements for the SOFC anode and the production cost. The microstructural requirement for the anode (30%-40% of porosity) was to maximize the level of porosity in this project. To identify the most cost-effective condition, the process that yielded the highest deposition efficiency (Thickness/Pass)needed to be identified. The optimization analysis on the above conditions generated 38 processing parameter combinations for maximizing these two responses (Porosity and Thickness/Pass), as shown in Table 3.
A parameter combination of total plasma gas = 225 l/min, suspension feed rate = 4 kg/h and standoff distance = 6.2 cm (No.1 in Table 3) was used to deposit anode coatings since this parameter combination is the best one in optimizing the two reponses as determined by the desirability function [12]. Fig. 1 shows the SEM micrographs of NiO-YSZ
and reduced Ni-YSZ anode coating deposited at this optimized condition.
3.1.3 Understanding the Results of Experiment Design
Statistical design of experiments is a mathematical shortcut to fabricate a target product without knowing the physical mechanisms that determine the relations between processing parameters and the properties of the product. Although each response (Thickness/Pass and Porosity) was found to be a function of the processing parameters, as shown in Equations (1) and (2), it is very difficult to explain why each term takes the exact form it has in the equations. This difficulty arises because the physical mechanisms determining the relation between the response and each term in the equations were not investigated directly. Therefore, in this section the possible reasons for only the linear terms in Equations (1) and (2) will be discussed based on the experimental observations and theoretical considerations.
The deposition efficiency (Thickness/Pass) is determined mainly by two processes in suspension plasma spray, i.e., melting of the sprayed particles and impact of the particles onto the substrate. More highly molten particles in the plasma jet will be “stickier” and tend to deposit on the substrate more easily, resulting in higher deposition efficiency. Due to the nature of the feedstock in suspension plasma spray, the jet often consists of relatively fine particles. Some of these small particles may follow the flow lines of the gas rather than impact on the substrate. At a given substrate temperature, larger sprayed particles that have greater momentum may be able to more easily cross the gas flow lines to impact onto the substrate and thereby provide the possibility of an increased deposition efficiency.
A plasma torch with a larger total plasma gas flow rate will produce a plasma jet with higher plasma gas velocity [17]. The higher velocity of the plasma jet will increase both the velocity of entrained particles and the particle momentum, therefore increasing the probability of deposition of entrained particles onto the substrate. As a result, the deposition efficiency (Thickness/Pass) would tend to increase with an increase in the total plasma gas flow rate.
A larger suspension flow rate will increase the density of entrained particles in the plasma jet. The greater density of entrained particles will raise the probability of particle collision in the plasma jet, increasing the size of the generated agglomerates [15]. As mentioned earlier, fine particles may follow the gas flow as it approaches and deviates from the substrate. Larger particles may be better able to impact and deposit on the substrate, therefore, a higher suspension flow rate may tend to increase the deposition efficiency. Of course, a large suspension flow rate means less efficient heating of the injected particles. The fact that deposition efficiency increases with an increase of suspension flow rate implies that larger particle impaction is the main process leading to the increased deposition efficiency
A plasma jet at larger standoff distances will have lower plasma gas and entrained particle velocities. This leads to a lower rate of particle impact, resulting in fewer particles depositing on the substrate. However, a larger standoff distance sometimes means longer residency time and more efficient heating of the entrained particles in the plasma jet (of course, too long a standoff distance is not favorable for particle heating). Since better heated particles in the plasma jet will be “stickier” and deposit on the substrate more easily, as was the case in this research for the investigated ranges of spray parameters, a larger standoff distance can lead to an increase in the deposition efficiency. For the standoff distances used in the present study, the fact that the deposition efficiency (Thickness/Pass) increased with an increase in standoff distance indicates that more efficient heating of entrained particles at a longer standoff distance was dominant in this work.
The level and character of porosity in coatings produced by plasma spray are largely determined by the nature of particle impact with the substrate and the molten state of the particles. Higher sprayed particle momentum increases the density of deposited coatings, i.e., decreasing the porosity. Sufficient heating of the sprayed particles will generate well melted particles that are able to spread more easily on the substrate and conform better to asperities and irregularities on the surface, resulting in coatings with lower porosity.
Since the plasma gas velocity increases with an increase in total plasma gas flow rate [17], a high plasma gas flow rate means a high momentum of sprayed particles. Therefore, coatings produced by a plasma jet with higher total plasma gas flow rate will tend to have low porosity, as shown by Equation (2).
The enthalpy required to melt suspension feedstock is proportional to the amount of suspension feedstock. A higher suspension feed rate will result in less efficient heating of injected materials in suspension plasma spray, and may generate partially molten or unmolten particles. Deposition of these partially molten or unmolten particles on the substrate and their incorporation into the coating can entrap pores, generating a more porous coating microstructure. So porosity increases with an increase in suspension feed rate, as shown in Equation (2).
Since plasma gas velocity at larger standoff distance is lower, the momentum of the entrained particles will be smaller. Therefore, based on this, it could be expected that the deposited coatings would have a higher level of porosity at larger standoff distances. However, a greater standoff distance sometimes means longer residency time and more efficient heating of the entrained particles in the plasma jet. Efficient heating of the sprayed particles, in which there has been sufficient time for the particle core to melt and a more uniform distribution of temperature to
be achieved throughout the particle, should result in coatings with lower porosity. Equation (2) indicates that the porosity level in fabricated coatings increases with an increase in standoff distance, showing that at a larger standoff distance a lower particle velocity is the main process leading to the increased porosity.
3.2 Electrolyte Deposition
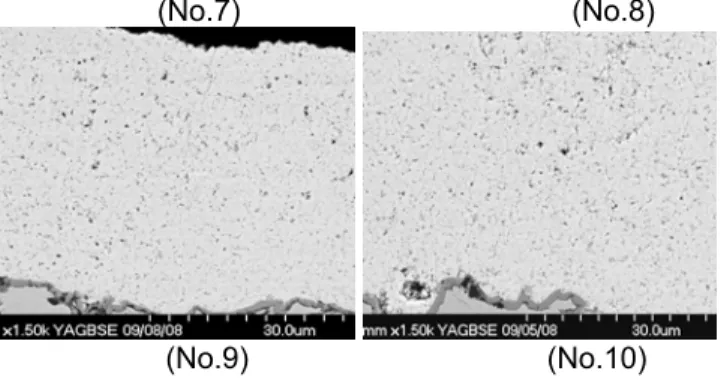
YSZ electrolyte coatings were deposited at 11 spray conditions by changing one parameter at a time as shown in Table 2. The pictures in Fig. 4 are the SEM
images of coatings deposited using the first 10 spray conditions. As shown in Table 2, the plasma torch
input power for spray conditions No.1-No.3, conditions No.4-No.6 and conditions No.7-No.11 is 93, 95 and 108 kW, respectively, and the total gas flow rate, plasma composition and current are the same in spray conditions No.1-No.3, conditions No.4-No.6 and conditions No.7-No.11, respectively. By comparison of pictures No.1-No.3, pictures No.4-No.6 and pictures No.7-No.10 in Fig. 4, it is found that the coatings
become denser with an increase of plasma torch input power. The porosity measurements show that coatings No.1- No.3, coatings No.4- No.6 and coatings No.7- No.11 have an average porosity of 1.8%, 0.5% and 0.3%, respectively, which is consistent with the result of the picture comparison. For example, this can be seen by comparing the results shown in rows 3, 6 and 9 in Table 2 and the
corresponding photos in Fig. 4 (No.3, 6 and 9). The
temperature and velocity measurements from particle diagnostics show that there is no significant change in average particle temperature as the plasma torch input power is increased; however, the particle velocity is greater at higher plasma torch input power, as shown in Table 2. The higher particle velocity
improves the impaction of the molten particles and increases the density of coatings.
As shown by the porosity data in Table 2 and by
comparisons of picture No.1 with picture No.2, picture No.4 with No.5, and picture No.7 with No.8, it is found that suspension concentration has no significant effect on the fabricated coating’s density. In the same way, by comparisons of the porosity data in Table 2 and
relevant pictures in Fig. 4 it is demonstrated that
changing the standoff distance from 5.1 cm to 6.3 cm has no significant effect on the porosity of coatings, although the particle velocity at a standoff distance of 6.3 cm is smaller than that of 5.1 cm. Picture No.9 and No.10 have almost the same morphology and the corresponding porosities in Table 2 are approximately
the same, indicating that suspension feed rate has no significant effect on porosity. In brief, suspension concentration and suspension flow rate show no significant effect on coating porosity at the standoff distances used in our experiments; however, higher plasma torch input power produces YSZ coatings with lower porosity in the investigated ranges of spray parameters.
3.3 Half Cell Deposition
Ni-YSZ anode and YSZ electrolyte half-cells were deposited at the conditions optimized in the previous sections. The as-deposited NiO-YSZ coatings (produced using condition 1 in Table 3) were lightly
polished to remove the humps on the surface to facilitate electrolyte deposition. The polished NiO-YSZ coatings were heat treated in hydrogen to reduce the NiO to Ni.The YSZ electrolyte coatings were deposited by using spray parameter set No.9 in Table 2. This condition had a combination of a larger
standoff distance and a smaller suspension flow rate, which could reduce the substrate temperature so vertical cracks observed in some deposited coatings produced at other conditions could be removed. In addition, the 5% suspension concentration used in condition 9 was found to be appropriate for the suspension feeding system. The fabricated YSZ electrolyte coatings were about 10 µm in thickness. No vertical cracks were observed in deposited electrolytes. Fig. 5 shows a
(No.1) (No.2)
(No.3) (No.4)
(No.7) (No.8)
(No.9) (No.10)
Fig. 4. SEM images of electrolyte coatings deposited
at the first 10 conditions in Table 2.
SEM image of a deposited half cell on a porous Hastelloy X substrate, indicating that the anode is porous and the electrolyte is dense. Interconnected pores were not observed in the electrolyte layer. XRD analysis of the as-deposited electrolyte (upper spectrum of Fig. 2) shows cubic YSZ and metallic Ni.
The Ni peaks result from the Ni in the reduced anode since the YSZ coating is only ~10 µm thick.
Fig. 5. SEM picture of half cell.
4 Conclusion
Ni-YSZ anode and YSZ electrolyte half cells were successfully deposited on porous Hastelloy X substrates by SPS. The thickness of the anode and electrolyte layers were ~30 μm and ~10 μm, respectively. The NiO-YSZ coating deposition process was opimized by design of experiment. The YSZ electrolyte spray process was examined by changing one parameter at a time. The results from the design of experiment indicate that the porosity level in the deposited anode coatings increased with an increase of suspension feed rate while it decreased with an increase of total plasma gas flow and standoff distance. The deposition efficiency increased with an increase of total gas flow rate, suspension feed rate and standoff distance. The density of YSZ electrolyte coatings increased as plasma torch input power increased. The anodes of the deposited half cells were porous. The electrolytes were dense, with no interconnected pores appearing. XRD analyses of the as-deposited layers detected cubic YSZ, NiO and Ni in the anode and cubic YSZ in the electrolyte. Evaluation of the electrochemical performance of these layers is now required to determine if the
approach employed for process and structure optimization has had the desired effect on performance.
5 References
[1] F.Tietz,H.-P.Buchkremer,D. Stover, “Components Manufacturing for Solid Oxide Fuel Cells,” Solid State Ionics 152– 153, pp373– 381 (2002). [2] H. Tannenberger and R. Schmitt, Swiss Patent
No. 491 510,31.
[3] R. Henne, M. Lang, M. Muller, R. Ruckdaschel, and G. Schiller,“Manufacturing of Solid Oxide Fuel Cells–A Challenge for DC and RF Plasma Deposition Processes,”pp124-136 in Annals of
the New York Acad. of Sciences,891: Heat and Mass Transfer under Plasma Conditions. Edited by P. Fauchais, J. V. D. Mullen, and J. Heberlein, The New York Acad. of Sciences, N. Y. 1999. [4] P. Fauchais, R. Etchart-Salas, V. Rat, J.F.
Coudert, N. Caron, and K. Wittmann-Teneze, “Parameters Controlling Liquid Plasma Spraying: Solutions, Sols, or Suspensions,” J. Therm. Spray Technol. Vol. 17(1), pp31-59 (2008).
[5] P. Blazdell and S. Kuroda, “Plasma Spraying of Submicron Ceramic Suspensions Using a Continuous Ink Jet Printer,” Surf. Coat. Tech., 123 pp239-246 (2000).
[6] J. Fazilleau, C. Delbos, M. Violier, J-F. Coudert and P. Fauchais, “Influence of Substrate Temperature on Formation of Micrometric Splats Obtained by Plasma Spraying Liquid Suspension,” pp889-893 in Thermal Spray 2003: Advancing the Science & Applying the Technology, Edited by B.R. Marple and C. Moreau, (Materials Park, Ohio, USA) ASM International, 5-8 May 2003.
[7] P. Fauchais, R. Etchart-Salas, C. Delbos, M. Tognonvi, V. Rat, J. F. Coudert and T. Chartier, “Suspension and Solution Plasma Spraying of Finely Structured Layers: Potential Application to SOFCs,” Journal of Physics D: Applied Physics, Vol.40, pp2394-2406 (2007).
[8] C. Delbos, J. Fazilleau, J. F. Coudert, P. Fauchais, and L. Bianchi, “Plasma Spray Elaboration of Finely Structured YSZ Thin Coating by Liquid Suspension Injection”; pp661-669 in Thermal Spray 2003: Advancing the Science & Applying the Technology. Edited by B. R. Marple and C. Moreau, ASM International, Materials Park, Ohio, USA, 2003.
[9] J. O. Berghaus, J.-G. Legoux, C. Moreau, R. Hui, C. Dece`s-Petit, W. Qu, S. Yick, Z. Wang, R. Maric, and D. Ghosh, “Suspension HVOF Spraying of Reduced Temperature Solid Oxide Fuel Cell Electrolyte,” J. Therm. Spray Technol., Volume 17 (5-6), pp 700-707, (2008).
[10] R. Hui, J.O. Berghaus, C. Decès-Petit, W. Qu, S. Yick, J.G. Legoux, C. Moreau, “High Performance Metal-Supported SOFCs Fabricated by Thermal Spray”, J. Power Sources 191, 371-376 (2009).
[11] W. Z. Zhu and S. C. Deevi, "A Review on the Status of Anode Materials for Solid Oxide Fuel Cells." Materials Science and Engineering, A362,
2003, pp. 228-239.
[12] R. H. Myers and D. C. Montgomery, Response Surface Methodology, Process and Product Optimization Using Designed Experiments. Second Edition, John Wiley & Sons, Inc. 2002. [13] Y. Wang and T. W. Coyle, “Solution Precursor
Plasma Spray of Nickel-Yittia Stabilized Zirconia Anodes for Solid Oxide Fuel Cell Application” J. Therm. Spray Technol. Volume 16(5-6) pp899-904, (2007).
[14] Y. Wang and T.W. Coyle, “Optimization of Solution Precursor Plasma Spray Process by Statistical Design of Experiment” J. Therm. Spray Technol., Volume 17(5-6), pp692-699, (2008). [15] Y. Wang, ‘‘Deposition of Solid Oxide Fuel Cell
Electrodes by Solution Precursor Plasma Spray,’’ Ph. D. Thesis, University of Toronto, 2008. [16] http://www.qualitycoach.net/land/designexpert.html.
[17] Y.Shan,T.W.Coyle,and J. Mostaghimi, “Numerical Simulation of Droplet Breakup and Collision in the Solution Precursor Plasma Spraying,” J. Therm. Spray Technol., 16(5-6), pp 698-704, (2007).