TRENDS
Analytical tools for the nano world
Renato ZenobiPublished online: 11 October 2007
# Springer-Verlag 2007
Introduction
Nanotechnology and nanoscience are very important areas of modern research. They are supposed to give us judicious control over the properties of matter at the nanoscale (i.e., lengths of well below 1μm in at least two dimensions). Nano objects include structures such as subcellular compartments, “molecular machines” and small biological objects, nano-composites, and components of molecular electronics. How-ever, there is currently a lack of chemical diagnostics and characterization methods for these nano objects and nanoscale structures, particularly methods for characterizing their molecular compositions.
Established methods for studying matter with nanoscale lateral resolution, such as atomic force microscopy (AFM), scanning tunneling microscopy (STM), and scanning electron microscopy (SEM), typically give very little or no chemical information. Some exceptions exist—for example derivatized AFM tips that can be used for chemical recognition. In general, however, only the shape of a nanostructure, its surface topography, and its local electric properties can be measured, albeit in many cases with excellent spatial resolution, down to the atomic scale. However, with the advent of nanotechnology and nanoscience, the need for chemical and in particular molecular analysis has become urgent.
Several new approaches to spectroscopic observation and imaging with nanometer-scale resolution have appeared
recently, and will continue to set trends in the fields of nanoscience and nanotechnology. Scanning near-field opti-cal microscopy (SNOM), the“optical cousin” of STM and AFM, emerged in the 1980s [1]. Standard aperture SNOM works by guiding light from a laser into an optical fiber whose tip is sharpened and metallized on the outside such that only a very small aperture (diameter ≈50 nm) passes laser light. If brought close to the object under investigation (within a few nm, i.e., into the optical near-field), this nanometer light source can be used to illuminate a spot on a sample that is considerably smaller than the optical diffraction limit. In order to obtain a high-resolution optical image of the sample, the SNOM tip is scanned over the sample surface with nanometer accuracy, using piezo ele-ments for motion control. SNOM observation was initially restricted to fluorescence [2], but was later extended to Raman spectroscopy [3] and even to laser ablation mass spectrometry [4,5].
One of the main limitations of SNOM is its optical throughput when using very small apertures. This limits both the achievable spatial resolution and the optical brightness of SNOM nano light sources. A way to circumvent this limitation is to use apertureless near-field methods, such as tip-enhanced Raman scattering (TERS). In this case, Raman scattering is amplified by the presence of a metallic nanoparticle brought close to the sample, using an AFM cantilever for example. Conceptually, this is an inversion of the geometry used in surface-enhanced Raman scattering (SERS). The advantage of this approach is that the sample can be illuminated using conventional optics, avoiding the much lower transmission of an aperture SNOM probe. Such apertureless or “tip-enhanced” near-field spectroscopy experiments have been realized using coated AFM tips or sharpened metal tips, and are used for
R. Zenobi (*)
Department of Chemistry and Applied Biosciences, ETH Zürich, 8093 Zürich, Switzerland
Raman scattering, scattering of infrared radiation (so-called scattering-SNOM), and for nonlinear optical experiments such as frequency doubling or coherent anti-Stokes Raman scattering (CARS) [6].
Fluorescence microscopy is also a well-established imaging method, and one that has made many important contributions to the understanding of biological processes, aided by the availability of different kinds of fluorescent tags such as green fluorescent protein (GFP). GFP can be genetically engineered to be coexpressed with the target proteins under investigation. Fluorescence microscopy is well suited for imaging of complex objects in vivo, three-dimensionally, and in their native environment.
We will first discuss how novel fluorescence microscopy methods have recently allowed researchers to view the nanoworld. This will be followed by a description of vibrational spectroscopies capable of nanometer-scale spa-tial resolution, and we will conclude by examining the performance of mass spectrometry in this field. Typical examples from the literature will illustrate the capabilities and the limitations of the methods presented.
Fluorescence microscopy
Confocal fluorescence microscopy has a diffraction-limited resolution (ca. 200 nm in thexy plane, ca. 0.5 μm in the z direction for light of wavelength λ≈500 nm), which is about two orders of magnitude coarser than the molecular level. Over the past few years, novel fluorescence copy methods such as photoactivated localization micros-copy (PALM), stochastic optical reconstruction microsmicros-copy (STORM), and stimulated emission depletion (STED) have been shown to provide ways of overcoming the diffraction limit. The PALM methodology [7] depends on the exact localization of the center coordinates (x0, y0) of a small
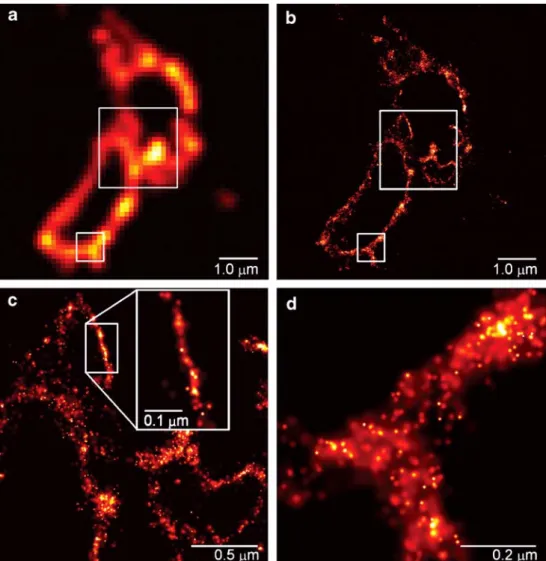
subset of fluorescently tagged biomolecules inside cells, by fitting the expected molecular image given by the point-spread function to the actual molecular image. Special photoactivatable fluorescent protein molecules are used for this. The localization of fluorescent protein molecules within ≈10 nm has been demonstrated, approaching the molecular level. Figure 1 shows an example of the capabilities of PALM. A different concept is used in stimulated emission
Fig. 1 Comparative summed-molecule total internal reflec-tion fluorescence (a) and PALM (b) images of the same region within a cryo-prepared thin sec-tion from a COS-7 cell express-ing the lysosomal
transmembrane protein CD63 tagged with the photoactivatable fluorescent protein Kaede. The larger boxed region in (b), when viewed at higher magnification (c), reveals smaller associated membranes that may represent interacting lysosomes or late endosomes that are not resolv-able by TIRF. In a region where the section is nearly orthogonal to the lysosomal membrane, the most highly localized molecules fall on a line of width 10 nm (inset). The distribution of CD63 within the membrane plane can be discerned in an obliquely cut region [(d), from the smaller boxed region in (b)]. Reproduced from [7]. Reprinted with permission from AAAS
depletion. A typical STED microscope uses a regularly focused excitation beam that is superimposed by a doughnut-shaped STED beam that quenches the excited molecules at the periphery of the excited spot, and thereby confines fluorescence emission to the center of the doughnut [8]. Fluorescence spots far below the diffraction limit,≈20 nm, can be obtained by STED. A very well written review of STED, PALM, and related methods was published by Hell earlier this year [9].
Vibrational spectroscopy
Conventional vibrational spectroscopic and imaging tech-niques, such as infrared (IR) and Raman spectroscopy and imaging can provide a wealth of chemical information and are nondestructive. However, because of the optical diffraction barrier, their spatial resolutions are usually limited to the micrometer or upper nanometer range. Developments in both IR and Raman microscopy have opened the door to nanoscale investigations. The great advantage of both of these methods is that they are label-free and thus applicable to virtually any material.
Probably the most successful implementation of near-field IR microscopy is the scattering-SNOM (s-SNOM) setup developed by the group of Keilmann [10,11]. Unlike TERS, it is not based on the huge enhancement in the EM field at the end of the tip, but rather on a localized perturbation of the electromagnetic field induced by the tip–sample interaction [12]. A spatial resolution of≈10 nm has been achieved with this approach.
Raman spectroscopy is a well-established technique for the identification of molecular species, material phases, and stress, achieved by analyzing the vibrational states. It works with visible or UV illumination and thus does not impose strict requirements on the preparation of the sample. Our group was the first to experimentally demonstrate tip-enhanced Raman scattering (TERS) with a lateral resolution of 20–50 nm [13]. It has since been successfully applied to a range of scientific problems that include DNA bases [14, 15], carbon nanotubes [16,17], and molecular species such as dye molecules adsorbed onto single-crystal surfaces [18]. The latter work by the group of Pettinger also opened the door to“gap mode” TERS, an approach where the sample is located in a narrow gap between a metal surface and a metal tip. Very high field enhancement, on the order of 107×, is possible in this configuration, enabling single-molecule sensitivity [19, 20] along with ca. 20-nm spatial resolution and the full spectroscopic information content of Raman!
Spectroscopic imaging using TERS should find many uses in the future; it is crucial to record a spectrum at every pixel in order to obtain detailed chemical information on unknown, heterogeneous samples or when following
transient events. This would allow an internal standard to be recorded simultaneously, and it provides detailed information derived from the small frequency shifts that result from differences in the local environment that is not
a
b
INTENSITY [a.u.]
1500
RAMAN SHIFT [cm-1]
Fig. 2 a Topographic image (750×750 nm). b Tip-enhanced Raman image showing the intensity of the G band at 1596 cm−1(50×50 pixels; 300×300 nm) and (inset) an example of an entire near-field tip-enhanced Raman spectrum of single-walled carbon nanotubes (SWNTs). The area of the Raman image is indicated by thesquare in the topographic image. The Raman image was produced by a tip with an 80-nm silver particle at the apex, using excitation at 488 nm and an exposure per pixel of 10 s. The full width at half-maximum of the SWNT in the topographic image at the point indicated by thearrows is 17 nm and the corresponding width in the Raman image is 24 nm. Reused with permission from [23], copyright 2005, American Institute of Physics
available from fixed-frequency imaging. Fast spectroscopic imaging will allow higher throughput investigation of complex samples, it will reduce drift and sample damage, and it will allow dynamic processes to be followed. However, virtually all research published in this area— even in papers that may have the term “spectroscopic imaging” in the title (!)—represents either fixed-frequency intensity maps using narrow band pass filters and very sensitive photodetectors or topographic scans with spectro-scopic data taken at a very small number of points.
Some notable exceptions exist: Hayazawa et al. [21] achieved Raman imaging on dye films, with a fairly short acquisition time of only≈10 min for a 1 μm ×1 μm (64×64 pixels) image. Both Rhodamine 6G and Crystal Violet (which were both studied in this work) were deposited onto a silver film and exhibited significant resonance enhance-ment at the excitation wavelength used (532 nm). There-fore, this special case also represents surface-enhanced
(plus tip-enhanced) resonant Raman scattering (SERRS). The tip itself had little effect (an optical contrast of only about 2 was achieved), because these molecular systems already exhibited large surface and resonance enhance-ments without the tip present. Accordingly, the Raman maps have poor contrast and show little detail. Other examples are the studies of carbon nanotubes (CNTs), with the most prominent work having been done by Novotny, Hartschuh and coworkers (see, for example, [16,22]). Both the spatial resolution and the local information obtained by point spectroscopy are very impressive. An optical contrast of ×3 ... ×5, depending on the nature of the vibrational mode of the CNT sample, was achieved. Carbon nanotubes are very strong Raman scatterers themselves, which facilitates their investigation by TERS imaging. However, from the literature it is clear that all but one published TERS map represent single-frequency images recorded with a combination of a suitable narrow band-pass filter
Fig. 3 A phase-separated supported lipid bilayer that was freeze-dried and imaged by NanoSIMS and AFM. a–c NanoSIMS images of the normalized12C15N−signal that localizes15N-DLPC (a), the13C1H−
signal that localizes13C
18-DSPC (b), and the overlaid12C15N− and 13C1H− signals (c). d An AFM image of the same region on the
sample taken before NanoSIMS analysis. The contrast levels within the NanoSIMS images reflect the normalized signal intensity, corresponding to 100 and 0 mol % of the appropriate isotopically labeled lipid, as determined from calibration curves (see text and
[22]).Arrows indicate objects in the AFM images that are unlabeled debris, not domains, and their corresponding locations in the Nano-SIMS images. Domains with diameters as small as 100 nm, as measured by AFM, were visible in the SIMS images (e.g., those highlighted with circles). NanoSIMS images were acquired with a pixel size of 100 nm × 100 nm. Reproduced from [29]. Reprinted with permission from AAAS
and a high-sensitivity APD for detection. The only TERS spectroscopic imaging study—also done on CNTs, using a specially prepared≈80-nm diameter Ag tip and an illumination wavelength of 488 nm [23]—presents a 300 nm ×300 nm (50×50 pixels) spectroscopic image, obtained for a total acquisition time of almost seven hours (Fig.2).
With the development of better detectors and highly efficient collection optics and spectrographs, true TERS spectroscopic imaging is within reach.
Mass spectrometry
Mass spectrometry (MS) is one of the most information-rich methods used for chemical analysis, for the identifica-tion of unknown compounds, and for the quantificaidentifica-tion of known substances in complex matrices. In particular, matrix-assisted laser desorption (MALDI) mass spectrom-etry has found increasing use in the spatially resolved analysis of biological samples [24, 25]. However, the spatial resolution is limited to 5–25 μm due to practical limitations and ultimately due to the optical diffraction limit [26]. There are some exceptions: for example, the “mass microscope” developed by Heeren and coworkers [27], or a laser desorption instrument with specially designed optics for delivering the laser beam to the sample [28]. A spatial resolution of≈1 μm has been demonstrated with the latter instrument, but follow-up work, especially that aimed at applications, is curiously absent in the literature.
The only MS method that routinely achieves 50–100 nm spatial resolution is secondary ion mass spectrometry (SIMS), with the use of a focused ion beam. Unfortunately, SIMS is limited to analysis under ultrahigh vacuum con-ditions and is only suitable for elemental analytes or very small molecular species (such as CH, CN, ...) since it is a relatively “hard” ionization method in the case of a tightly focused primary ion beam. Molecular SIMS only becomes possible at a resolution of≈0.5 μm using an Au or Bi primary
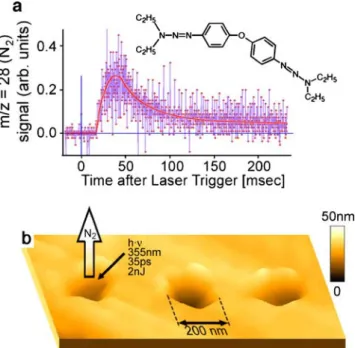
Fig. 4 Near-field laser ablation of a film of bis(phenyl-N,N-diethyltriyzene) ether. a Transient ablation signal of the decomposition product at m/z 28 (nitrogen), detected with a quadruople mass spectrometer tuned to this mass. b Topographic image of the surface of the triazene sample following the ablation experiment. Adapted from [5]
Table 1 Spatial resolution, advantages and disadvantages of state-of-the-art nanoanalytical methods Method Best achievable
spatial resolution
Advantages Disadvantages
PALM ≈10 nm 3-D imaging possible Requires special fluorescent labels Ambient conditions Photobleaching of labels
In vivo imaging on the horizon Long acquisition times STED ≈20 nm 3-D imaging possible Requires fluorescent labels
Ambient conditions Photobleaching of labels In vivo imaging on the horizon
Infrared s-SNOM ≈10 nm Can yield molecular fingerprints Needs IR optics
Label-free Limited to surface analysis Ambient conditions
TERS ≈20 nm Can yield molecular fingerprints Limited to surface analysis
Label-free Field-induced decomposition of analyte Ambient conditions
SIMS ≈100 nm Label-free Needs an ultrahigh vacuum environment
Depth profiling “Hard” ionization more suitable for elemental analysis High sensitivity
SNOM-MS ≈150 nm Label-free Detection limit Ambient conditions
ion beam, albeit at the cost of mass resolution and sensitivity. A clever way to circumvent these limitations of SIMS has been shown by Kraft et al. [29], who used isotopically labeled phosphatidylcholine lipids and managed to image lipid“rafts” in freeze-dried supported lipid bilayers with a lateral resolution of ≈100 nm, by detecting 12C15N− and
13
C1H− fragment ions with SIMS to identify the different components (Fig.3).
Thus, there is no general analytical method that is currently available for the nano-analysis of organic compounds with MS, especially with regards to biological samples (i.e., analysis of metabolites in living cells or tissue). Several concepts that are designed to address this shortcoming in SNOM-MS have been developed over the last few years. The first attempt, by Kossakovski et al. [4], placed an entire SNOM head into the ion source of a time-of-flight mass spectrometer and passed short N2 laser pulses (3 ns pulse
width, λ=337 nm) onto a molecular sample surface. The spatial resolution with this setup was, however, limited to the μm scale, presumably due to the use of an uncoated SNOM tip and due to the practical limitations of operating the SNOM inside the vacuum.
A considerable improvement came in 2001 from our laboratory. Stöckle et al. [5] demonstrated atmospheric pressure laser ablation with a resolution of≈150 nm, using a SNOM tip, followed by mass spectrometric analysis of the ablation products. Figure 4 shows the mass spectrometric detection of the products of such a nano-ablation experiment. This study also demonstrated that it was possible to interrogate the sample at atmospheric pressure, transport the ablation products into the mass spectrometer through a capillary interface, and then perform ionization and mass analysis in vacuo. The drawback of the setup used was that the relatively short duration of the transient, 100 ... 200 ms, did not allow the mass spectrometer, a simple quadrupole instrument, to be scanned.
Only detection at single m/z values was possible. A second-generation SNOM-MS instrument based on an ion trap–time-of-flight combination is therefore being devel-oped by our group [30]. It will allow a full mass spectrum to be recorded for every ablation event. An alternative is to produce ions at atmospheric pressure with a laser pulse delivered to the sample by a SNOM probe and to sample these with a commercial MS equipped with an atmospheric pressure inlet. The advantage of this approach is that ions can be steered more precisely than neutrals. An interesting project based on this variant of SNOM-MS is underway in the laboratory of Vertes [31]. An additional twist to their approach is that pulsed infrared laser light is used for ablation and ionization, and the goal is to employ the aqueous environments of biological samples directly as IR MALDI matrices. However, the ion yield is typically very small for IR MALDI. This may eventually limit the
achievable spatial resolution, which is currently on the order of≈40 μm (without using a SNOM probe, of course). The jury is still out on which is the best concept for SNOM-based laser ablation–mass spectrometry.
Outlook
Table 1 summarizes the current capabilities of the nano-analytical methods discussed above. The two fluorescence-based methods, PALM and STED, certainly profit from the commercial availability of the microscope equipment and fluorescent labels required. However, both methods require fairly complex and expensive short pulse laser systems, and do not yield spectroscopic information. Infrared s-SNOM is not commercially available; it has so far only been pursued in research laboratories. It has shown excellent spatial resolution, but does not currently permit true spectroscopic imaging to be performed. Scans generally represent single-wavelength maps of sample surfaces. Equipment for TERS is now becoming available from a number of sources. As a completely label-free method it holds great promise for nanoscale molecular analysis and spectroscopic imaging of virtually any material. The bottleneck in TERS is the fabrication of the tips. While important progress towards highly enhancing tips has been made [32], their durability is still a major problem. At present, no general method is available for the nanoscale mass spectrometric analysis of organic compounds. SNOM-MS is currently still at an experimental stage and is challenging, but its development proceeds. Finally, additional combinations of pulsed laser– matter interactions with analytical instrumentation are feasible, such as laser-induced breakdown spectroscopy at the nanometer scale. Although only information on ele-mental composition rather than molecular information will be obtained, some promising steps in this direction have already been taken [4,33].
Acknowledgments I would like to thank Dr. Thomas Schmid for his critical reading of the manuscript. Our work in the area of nanoscale analytical chemistry is supported by the Gebert-Rüf Foundation (grant no. P-085/03), by the Swiss National Science Foundation (grant no. 206021-117373), and by the ETH Zürich.
References
1. Pohl DW, Denk W, Lanz M (1984) Appl Phys Lett 44:651–653 2. Betzig E, Chichester RJ (1993) Science 262:1422–1425 3. Jahncke CL, Paesler MA, Hallen HD (1995) Appl Phys Lett
67:2483–2485
4. Kossakovski D, O’Connor SD, Widmer M, Baldeshwieler JD, Beauchamp JL (1998) Ultramicroscopy 71:111–115
5. Stöckle R, Setz P, Deckert V, Lippert T, Wokaun A, Zenobi R (2001) Anal Chem 73:1399–1402
6. Kawata S, Shalaev V (eds) (2007) Tip enhancement (Advances in Nano-Optics and Nano-Photonics Series). Elsevier, Amsterdam 7. Betzig E, Patterson GH, Sougrat R, Lindwasser OW, Olenych S,
Bonifacino JS, Davidson MW, Lippincott-Schwartz J, Hess HF (2006) Science 313:1642–1645
8. Klar Ta, Jakobs S, Dyba M, Egner A, Hell SW (2000) Proc Nat Acad Sci USA 97:8206–8210
9. Hell SW (2007) Science 316:1153–1158 10. Knoll B, Keilmann F (1999) Nature 399:134–137
11. Hillenbrand R, Taubner T, Keilmann F (2002) Nature 418:159– 162
12. Taubner T, Hillenbrand R, Keilmann F (2004) Appl Phys Lett 85:5064–5066
13. Stöckle RM, Suh YD, Deckert V, Zenobi R (2000) Chem Phys Lett 318:131–136
14. Wanatabe H, Ishida Y, Hayazawa N, Inouye Y, Kawata S (2004) Phys Rev B 69:155418
15. Rasmussen A, Deckert V (2006) J Raman Spectrosc 37:311–317 16. Hartschuh A, Sanchez EJ, Xie XS, Novotny L (2003) Phys Rev
Lett 90:095503
17. Hayazawa N, Yano T, Watanabe H, Inouye Y, Kawata S (2003) Chem Phys Lett 376:174–180
18. Ren B, Picardi G, Pettinger B, Schuster R, Ertl G (2005) Angew Chem Int Ed 44:139–142
19. Zhang WH, Yeo BS, Schmid T, Zenobi R (2007) J Phys Chem C 111:1733–1738
20. Neacsu CC, Dreyer J, Behr N, Raschke MB (2007) Phys Rev B 75:236402
21. Hayazawa N, Inouye Y, Sekkat Z, Kawata S (2002) J Chem Phys 117:1296–1301
22. Anderson N, Anger P, Hartschuh A, Novotny L (2006) Nano Lett 6:744–749
23. Wang JJ, Saito Y, Batchelder DN, Kirkham J, Robinson C, Smith DA (2005) Appl Phys Lett 86:263111
24. Stoeckli M, Chaurand P, Hallahan DE, Caprioli RM (2001) Nature Med 7:493–496
25. Chaurand P, Schwartz SA, Caprioli RM (2004) J Prot Res 3:245–252 26. McDonnell LA, Heeren RMA (2007) Mass Spectrom Rev
26:606–643
27. Luxembourg SL, Mitze TH, McDonnell LA, Heeren RMA (2004) Anal Chem 76:5339–5344
28. Spengler B, Hubert M (2002) J Am Soc Mass Spectrom 13:735– 748
29. Kraft ML, Weber PK, Longo ML, Hutcheon ID, Boxer SG (2006) Science 313:1948–1951
30. Setz PD, Schmitz TA, Zenobi R (2006) Rev Sci Instrum 77: 024101
31. Li Y, Shrestha B, Vertes A (2007) Anal Chem 79:523–532 32. Yeo BS, Schmid T, Zhang WH, Zenobi R (2007) Anal Bioanal
Chem 387:2655–2662
33. Samek O, Kurowski A, Kittel S, Kukhlevsky S, Hergenröder R (2005) Spectrochim Acta B 60:1225–1229