Cardiovascular Research, 1990, 24, 71 1-718 71 1
Flow motion waves with high and low frequency in
severe ischaemia before and after percutaneous
transluminal angioplasty
Ulrich Hoffmann, Ernst Schneider, Alfred Bollinger
Abstract
Stuay of objective
-
The aim was to evaluate skin flux and prevalence of low and high frequency flow motion waves in patients with severe ischaemia due to peripheral arterial occlusive disease before and after percutaneous transluminal angioplasty (FTA) with and without local thrombolysis.Design- Flow motion was recorded by the laser Doppler technique at the dorsum of the foot before, one day, and one month after PTA. The results were separately analysed in patients with successful and unsuccessful treatment.
Subjects
-
18 patients with rest pain or incipient gangrene were included. Mean pretreatment systolic ankle pressure was 55.8(SD 25.5) mm Hg, and mean transcutaneous Po2 at 43°C was 5.2(9.4) m m Hg. Arteriography revealed relevant stenoses or occlu- sions of the femoropopliteal and calf arteries.Measurements and results
-
Before treatment two patterns of flow motion with characteristic frequen- cy ranges were observed at the foot dorsum and at a probe temperature of 32°C: low frequency (LF) waveswith a mean frequency of 2.2(0.5) c y c l e s m i d and a mean amplitude of 0.7x0.42) arbitrary units(AU) and high frequency (HF) waves with a mean frequency of 22.q4.2) cycles-min-' and a mean amplitude of 0.3q0.33)
AU.
PTA was successful in 11 of the 18 patients. After successful treatment, prevalence of H F waves decreased from 10/11 to 4/11 cases (p<O.OOl), but remained nearly unchanged after failed procedure. Prevalence of LF waves before and after PTA did not differ significantly.Conclusions
-
Our data support the hypothesis that H F waves represent a reaction of skin microcir- culation to severe ischaemia. With reference to Department of Internal Medicine, Medical Policlinic, Angiologv Division, University Hospital, CH-8091 Ziirich, SwitzerlandU Hoffmann E Schneider A Bo\Linger
Correspondence to: Professor Bollinger
Key words: laser Doppler flowmetry; human skin microcir-
culation; vasomotion; terminal arterioles Submitted 25 April 1989
Accepted 6 April I990
animal studies it is proposed that HF waves originate from terminal arterioles. They may function as a compensatory mechanism of flow regulation in- volved in pathophysiology of ischaemia.
Rhythmical fluctuation of blood flow due to arteriolar calibre changes were first described many years ago.' The phenomenon termed vasomotion is characterised by oscillatory flow in the distal terminal vascular bed. In human skin microcirculation, flow motion has been observed using various technique^.^' According to findings in animal preparations, it was explained by vasomotor activity of the arterioles.
Recent interest has focused on vasomotion, since new data available from animal preparations not requiring anaesthesia document the importance of the phenomenon for blood flow regulation.6
Since the introduction of laser Doppler flowmetry' blood flow of human skin can be measured semiquantitatively in a non-invasive and continuous way. The technique allows assessment of flow motion in
skin
microcircdation. 'c-12In a recent study" performed on patients with different degrees of ischaemia of lower limbs two
patterns of flow motion were described: the well known flow oscillations with low frequency of about 3
cyclesmin-' and flow motion with high frequency of about 21 cyclesmin-'. Prevalence of the high frequency waves increased with severity of ischaemia. The hypothesis was advanced that this pattern of flow motion may represent a reaction of skin microcirculation to severe ischaemia.
To elucidate the possible relationship we analysed flow motion in 18 patients with severe ischaemia before and after percutaneous transluminal angioplasty with or without local thrombolysis. The aim of the study was to answer the question whether high frequency flow motion would disappear after relief of ischaemia and persist after unsuccessful therapy.
Methods
Eighteen patients, 10 women and eight men, aged 25 to 88 years (mean 70.8) were studied. Nine suffered from rest pain, nine had additional gangrene. In all patients ischaemic disease was in a chronic stage. Seventeen
712 Ulrich Hoffrrann, Emst Schneider, Alfred Bollinger
patients showed peripheral arterial occlusive disease due to atherosclerosis. In one patient, a 25 year old male, thromboangiitis obliterans was diagnosed. Seven patients were smokers, five had
type
I1
diabetes, 12 suffered from hypertension and three had hyperlipidaemia. Nine patients had more than one risk factor.Patients with rest pain or gangrene of lower limbs who underwent percutaneous transluminal angioplasty with and without local thrombolysis for limb salvage were selected for the study. Diagnosis was established by pulse palpation, auscultation, segmental pulse volume recordings, systolic ankle pressure measurements with Doppler ultrasound, and arteriography
.
Patients with falsely high ankle pressure secondary to incompressible calf arteries suggesting medial calcinosis were excluded from the study. Further exclusion criteria were clinically manifest neuropathy and oedema of other than ischaemic origin. To avoid measurements in inflamed skin areas only patients with necrosis or gangrene of toes or toe tips were included.
In 17 patients occlusions or si&icant stenoses at both femoropopliteal and calf level were demonstrated by arteriography. One subject exhibited a s i d i c a n t stenosis of external iliac artery followed by total occlusion of superfcial femoral artery with two of the three calf arteries patent.
Percutaneous transluminal angioplasty was performed at the following segments: external iliac artery in one patient, superficial femoral artery in 13 patients, deep femoral artery in one patient, popliteal artery in eight patients, and calf arteries in seven patients. In seven cases more
than
one segment was treated. In addition urokinase was infiltrated locally in five patients for thrombolysis in the femoropoliteal segment. Starting one day before angioplasty aspirin (1 g-d-') was given, until the therapeutic range of prothrombin time was reached on coumarin preparations first given on the day of catheter treatment. The patients did not receive vasoactive drugs.LASER DOPPLER
Basic principles and applications of laser Doppler flowmetry are described elsewhere.89 A 2 mW helium-neon laser (Periflux, PF2, Perimed, Sweden) was used, emitting light at a wavelength of 632.8 nm.
For standardisation of skin temperature a
thermostat probe holder allowed temperature settings in the range between 26 and 44°C. The laser Doppler was placed in a central hole not directly heated. A pen recorder (Gould Brush 2600s) was used for continuous registration of flux curves with a paper speed of 6 cm-min-l. Zero flux calibration was performed with the probe head fured to a static surface. Gain selector was set to 3014 kHz, time constant ot 0.2 s, and
thermostat temperature to 32°C. Whereas in normals (n = 6) the skin temperature below the probe was close to 32°C (32.2 k 1.1OC) 20 min or more after fixing the probe, the mean value measured in patients (n = 6) reached only 29.8 k 0.5"C. The difference was statistically significant (p<O.Ol). The laser Doppler output provides an electrical voltage. We defined 1 volt as 1 arbitrary unit (AU).
TRANSCUTANEOUS OXYGEN TENSION (tCP02)
Technical details of the method have been published previously. l 3 We used a commercially available tcP02 electrode (Transoxode, Servomed Oxymonitor SMS
361, Hellige GmbH, West Germany). It consists of a modified Clark type oxygen electrode with three 15 pm platinum cathodes, a silver-silver chloride anode, and a heating element for temperature setting controlled by a thermistor. A core temperature of 43°C was selected to induce skin hyperaemia. A two point calibration was performed against Po2 in room air based on the actual barometric pressure and against zero Po2 achieved by a zero solution provided by the manufacturer.
PROCEDURE
All
measurements were performed one day before, and one day and one month after percutaneous transluminal angioplasty. The patient rested in the supine position. The leg was fured in a vacuum cushion in order to minimise movement artefacts. The thermostat probe holder of the laser Doppler instrument was set at 32°C and placed at the patient's forefoot, 3 cm proximal to the base of the second and third toes and fmed by a double adhesive ring. Then the probe was inserted. T c P q measurements were performed close to the medial side of the laser Doppler probe. A drop of distilled water (contact agent) was applied to the skin surface. The electrode was attached by means of a double adhesive ring tape.After a period lasting at least 20 min baseline recordings were started. Room temprature varied between 22 and 24°C. Simultaneous measurements of skin blood flux and tcP02 were performed continuously during the experiment. First, values at rest during a period of
5
min were recorded, followed by an arterial occlusion at the ankle lasting 3 min andusing a pneumatic cuff inflated to 250 mm Hg. The reactive hyperaemia response was registered until skin blood flux and tcPoz values were comparable to baseline values. In patients without reactive hyperaemia response, recording was continued for at least 10 min.
One day after the baseline measurements, patients underwent percutaneous transluminal angioplasty using the balloon catheter technique introduced by Griint~ig.'~ In five cases local thrombolysis with urokinase was performed additionally, according to Hess and coworkers.1s One day and one month after the investigation, pulse palpation, auscultation,
Flow motion before and after percutaneous transluminal angioplasty 713 segmental pulse volume recordings, and ankle
pressure measurements with Doppler ultrasound were repeated. Angioplasty was defined as successful if the ankle-arm pressure difference increased more than 20 mm Hg and rest pain vanished (group A). If these conditions were not fulfilled, angioplasty was considered to have failed (group B). Laser Doppler flux and tcPo2 were measured according to the protocol mentioned above.
Care was taken to compare frequency of flow motion waves and frequency of respiration during the recordings.
DATA ANALYSIS
Data obtained during a resting period lasting 5 min
were used to analyse the different patterns of flow motion recorded by laser Doppler and to determine mean flux at rest. The latter was calculated during the entire resting period. A line along the estimated mean value was drawn with identical areas above and below the line. The level of the line corresponds to medan flux expressed in arbitrary units (AU).
Amplitude of flow motion waves were calculated from mean peak to trough values. Relative values were calculated, expressing the amplitudes in percent of mean flux. Flow motion waves were defined as low frequency waves," if there were at least two complete and consecutive cycles in the frequency range of 1 .O- 10 cycles*min-' with a minimal relative amplitude of 10%.
High frequency waves were diagnosed" when at least four complete and consecutive cycles in the frequency range of 15-30 cyclesmin-' followed each other and had a minimal relative amplitude of 5%.
When marked changes of resting flux were observed after angioplasty, relative amplitude of high frequency waves was determined on the basis of pretreatment flux. Moreover, diagnosis of high frequency was only made if the decision of two independent observers was in agreement. The second observer was unaware of the day at which the recordings were performed (first, second or third tracing).
In the recordings with distinct high or low frequency flow motion waves, frequency was calculated from the number of cycles over time. The wave frequency was expressed in cycles per minute. In the same section of the recordings amplitude determination was performed as mentioned above. At least four low frequency and eight high frequency waves were included for measurement of individual values.
Peak flux was defined as the highest flux value obtained during reactive hyperaemia. It was measured in the middle of the pulsatile flux oscillation band. Time to peak flux was defined as the interval between release of cuff pressure and peak flux. It was only calculated for patients showing a clearly determinable postischaemic peak exceeding preocclusive mean flux. Reproducibility of flow motion patterns has been analysed. Recordings were performed in 12 patients
with severe ischaemia on the foot dorsum at one particular day and repeated two days later. Presence or absence of high frequency waves was confirmed at the second examination in 75% of the recordings. In the remaining patients the pattern varied between completely abolished flow motion and presence of high frequency waves. The present series contains only three patients in whom flow motion was lacking.
TcPoz was determined from recordings during the resting period soon after a stable value was reached.
STATISTICS
Results are expressed as means (SD). Differences between laser Doppler and tcPoz values before and after angioplasty were evaluated with the Wilcoxon matched pairs test. The Mann-Whitney U test was used to compare data between the successfully and unsuccessfully treated groups. Significant changes of prevalence of the two flow motion patterns were assessed by Fisher's exact test.
Results
Angioplasty was successful according to the definitions mentioned in 11/18 patients (group A), while the intervention failed in the remaining seven cases (group
B). In the latter group all patients could be re-examined one day after angioplasty, whereas after one month re-examination was not possible in six patients, because of amputation (one patient), bypass operation (one patient), or long term intra-arterial prostaglandin El administration (four patients). In one patient angioplasty of the deep femoral artery with an occluded superficial femoral artery improved circulation slightly, so that amputation was not necessary until one month after the procedure.
Pretreatment mean systolic ankle pressure was 55.8 (SD 25.5) mm Hg and ankle/arm pressure ratio 0.39(0.19) in the 18 patients. In group A, mean ankle pressure increased from 60.9(25.6) mm Hg to 109.1(31.7) mm Hg one day after angioplasty and to 130.7(44.3) mm Hg after one month (p<0.005). Improvement from one day to one month was still significant on the p<O.OS level. The corresponding mean ratios were 0.40(0.18), O.gO(0.25) and 0.94(0.26) respectively. Group B patients showed lower mean pretreatment ankle pressure than group A (NS). The values were 47.9(25.0) mm Hg before and 60.7(13.0) mm Hg one day after FTA ( ~ ~ 0 . 0 5 ) . Mean ankle/arm ratio increased from 0.36(0.23) before to 0.47(0.17) one day after angioplasty.
In group A, angiography after angioplasty showed occlusions or significant stenoses at the following arteries: three calf arteries in seven patients, two calf arteries in two patients, femoral artery and one calf artery in one patient. No occlusion or signifcant stenosis remained in one patient of group A after angioplasty of the femoral and popliteal artery.
LJlrich Hoffmann, Ernst Schneider, Alfred Bollinger rnm Hg p<0,005 t I p<0.005 pcO.05
'
1
C] SuccessI
"1
Failed-
0Before
1L
One day One monthFigure I
torefooiataprobe temperatureof43"C before andafter
percutaneous transluminal anfloplasty ( P T A ) . Bars=SD Filled columns indicate patrents wtth failed treatment. There is a delayed increase in tcPo2 between 1 day and 1 month after successful PTA
Transcutaneous oxygen pressure measured on the
In group B patients, occlusions or signifcant stenosis after failed angioplasty were still present at the following vessels: femoral and popliteal artery with occlusions of all three calf arteries in four patients, femoral and popliteal artery with occlusion of one calf artery in one patient. Two patients had occlusions of all three calf arteries.
Mean tcPo2 before and after angioplasty is plotted in fig 1 . The mean value in all patients was 5.2(9.4) mm Hg before treatment. In group A with successful therapy mean tcPo2 was significantly enhanced from 8.0(11.2) mm Hg to 18.3(19.4) mm Hg after one day and to 35.4(17.2) mm Hg after one month following angioplasty (p<O.OS-O.OOS). Between one day and one month post-treatment the mean values still almost doubled, proving a delayed effect of treatment. This late improvement was also significant (p<O.OOS). Even in group B there was a significant increase of mean tcPoz from 0.8(1.5) mm Hg to 7.0(10.8) mm Hg (p<O.OS). In four out of these patients initial tcPo2 was 0 mm Hg.
PATTERNS OF FLOW MOTION
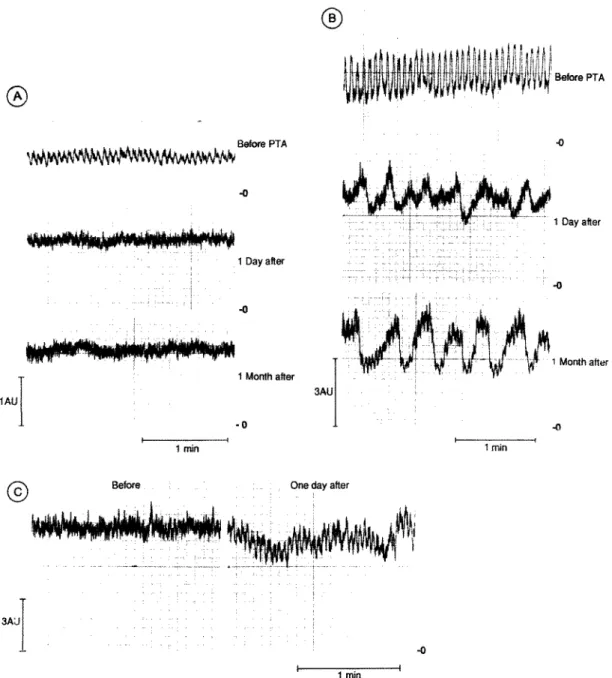
Two distinct patterns of flow motion were observed, reflected in low and high frequency waves. Typical examples of high frequency waves are represented in fig 2 A , B, and C. In the patient in 2B, high frequency waves were recorded after successful treatment by angioplasty.
The presence of low frequency waves was often intermittent, while high frequency were more continuous during the observation period. Mean frequency and amplitude of high and low frequency waves at the three examination days are given in tables
I and 11. Individual frequency was relatively constant
Table I
rt i and unsuccessful aneirniasm =Implitude, frequency and prevalence of imoub B ) . Data are means (SD).
l a frequency flow motaon waves J L F ) inpatients with successful angioplasty (group
.4mphtude (AL" Frequency jcycles.mm-') Prevalence
A B A B A B
Before" 0.79(0.46j 0.58(0.37? 2.3t0.5) 1.9(0.4) 511 1 217
i dayh 0.83(0.73 0.43 2.5i0.8) 3.3 6/11 117
1 month" 0.8610.52: - 2.9( 1 . 1 ) - 611 1
riC,'-=arbitranr units
'Before angloplasty; after angioplasty
- - _._ll
r'uhle 11 Amplitude, frequency and prevalence of high frequency fla motion waves ( H F ) in patients with successful angioplasty group A ) and unsuccessful angioplasty (group B ) . Dam are means (SD).
Amphtude LAC) Frequency [cycles.mm-') Prevalence
A B A B A B
Before' 0.41(0.40) 0.3qO. 1 5 j 21.7(4.8) 24.q1.3) 10111 517
i 1 monthb dayb 0.40(0.16) O.M(O.22) - 0.46(0.32 j 21.q4.8) 19.3(0.7) - 21.4(2.3) 4 i l l * 2/1 l t - 717
.%U=arbitrary units
"Before angioplasty ; 'after angioplasty
Flow motion before and after percutanems transluminal angioplas ty 715
for high frequency flow motion, but showed a broader variability for low frequency waves. Amplitudes of flow motion waves fluctuated over time and varied in
tracings obtained in different patients. The individual variations of amplitude were smaller in high frequency waves, but more pronounced in low frequency waves. As a general rule the amplitude of low frequency waves
exceeded that observed in high frequency waves. Noteworthy is one case with high frequency waves and "giant" amplitudes reaching 1.47 AU (45.4% of mean flux) (fig 2B). Before angioplasty in 15 of the 18 patients high frequency waves were found with a mean frequency of 22.6(4.2) cyclesmin-' and a mean amplitude of 0.39(0.33) AU, whereas low frequency
1AU -0 1 Month aftw - 0 e---r 1 min 1 Dayater -0 1 Month after
I
Before One day after
T
1 min
I
1 min I
Figure 2 A . Flow motion in a patient with swcessfulpercutaneous transluminal angioplasty (PTA). High frequency ( H F ) waves are
clearly visible before treatment which disappear ajier PTA. B. Flow motion in a swcessful~ treatedparient. Note "giunt'' amplitudes of HF waves before PTA
.
One day afier treatment lowji-equency ( L F ) waves are present, whereas HF waves are no longer derectable. Superimposition of H F waves on L F flow motion waves appeared 1 month afier PTA. C. Flow motion in a patient with failed PTA,Ulrich Hoffmann, Emst Schneider, Alfred Bollinger
waves were present in seven cases, exhibiting a mean frequency of 2.2(0.5) countsmin-' and a mean amplitude of 0.73(0.42) AU. For both groups, there were no significant changes in amplitude and frequency before and after angioplasty. However, in low frequency waves a tendency to higher frequencies was found in patients with successful angioplasty one day and one month after the procedure.
Prevalence of high frequency waves decreased significantly in patients with successful treatment ipc0.01-0.001, tables I and 11). High frequency waves were still present one month after treatment in one case with successful angioplasty at the thigh level but who had remaining occlusions of all three calf arteries, and in another patient exhibiting no remaining occlusions or significant stenoses. Mean systolic ankle/arm pressure ratio of the patients was 0.65 and 1.22 respectively after one month after angioplasty.
In cases with failed angioplasty, high frequency waves persisted (five patients) or appeared (two patients) one day after treatment. Figure 2C shows a rypical example for laser flux tracings before and after unsuccessful angioplasty
.
During reactive hyperaemia the amplitudes of low frequency waves were temporarily enhanced or induced. This phenomenon was detected in 6111 patients of group A before angioplasty ; after successful angioplasty it occurred in 711 1 at one day and 9/11 at one month (NS). In group B only one patient showed enhancement of low frequency waves before angioplasty. One day after failed treatment no patient showed low frequency waves during reactive hyperaemia. The difference in prevalence was significant at the p<O.Ol level compared to group A. In contrast, no increase in amplitude of high frequency waves or induction of previously non-existent high frequency waves was recognised during reactive hyperaemia. High frequency flow motion waves were not presenr immediately after cuff pressure release in cases showing high frequency waves at rest. They reappeared with increasing amplitude during the reactive hyperaemia response.
FLUX AT REST AND DURING REACTIVE HYPERAEMIA Results are summarised in table 111. In both groups there was an increase in flux at rest and in peak flux after angioplasty. However, statistical significance was
only reached for peak flux in group A. The standard deviations were high, especially one day after angioplasty. Time to peak flux could be determined in 10/11 patients of group A before and one day after treatment, and in 5/7 patients of group B before, and 317 one day after angioplasty. A significant difference between the two groups was found one day after angioplasty. In group A, time to peak flux decreased significantly after angioplasty (p<0.05). No significant correlations were found between ankle/arm ratio and tcPo2, flux at rest, peak flux, or time to peak flux. Discussion
All patients selected for the study complained of rest pain with or without gangrene of one lower limb. Clinical examination, arteriography, low systolic ankle pressure, and tcPoz values below 10 mm Hg" documented severe ischaemia. Outflow at the calf arteries was strongly impaired in most patients. This explains the relatively high primary failure and early reocclusion rate in the 18 patient^.'^
Analysis of flow motion before and after angioplasty revealed two distinct patterns, which showed characteristic frequency ranges. Low frequency waves showed oscillations from 1.6 to 4.6 cyclesmin-' [mean value 2.2(0.5) counts-min-'I, whereas high frequency flow motion waves ranged from 16 to 26 countsmin-' [mean value 22.6(4.2) counts.min-'].
Visual analysis of flux motion patterns is based on subjective judgement. Therefore, we recently developed a computerised system for detecting the prevalance of periodic flux changes at any given frequency. A preliminary direct comparison between subjective evaluation using the criteria of this study and objective prevalence/frequency plots revealed good agreement between the two techniques of evaluation. Fast Fourier transform did not yield as satisfactory results for documenting flux motion pattern (unpublished data). The Prony spectral analysis is more suited for short recordings in experimental work" than for long tracings obtained in human skin.
A study testing reproducibility of low and high frequency waves on different days has just been completed. The data indicate that reproducibility of high frequency waves is best in patients with severe ischaemia and less satisfactory in patients with
Table III
(group B ) . Data are means Flux at rest, peak (SD)
flux, and time 10 peak flux in patients unth successful angroplasty (group A ) and unsuccessful angioplasty
Flux at rest (AU) Time to peak flux (s)
A B A B A B
Peak flux (AU)
Before' 2.8( 1.4) 2.7(0.9) 4 3 2 . 5 ) 3.0U.2) 143.q77.3) 23 1.q77.3)
1 dayb 4 . q 3 . 4 ) 3.9( 2 .O) 6.9(4.3)* 5.1(2.0) 75.7(49.8)* 2 1 5 . q l 5 1 . 5 ) t
1 month" 3.9(2.2) . ,
-
6.1(2.4) . , - 81.9(73.8)* .~ -_.
AU=arbiuary units
%fore angiophsty; bafter angiophsty "iKO.05 v baseline values; tp<O.05 ZJ group A
Flow motion before and after percutaneous transluminal angioplasry 717 intermittent claudication. The patients included in this
study all suffered from rest pain or gangrene. Low frequency flow motion has been described previously by other investigators using laser Doppler flowmetry. Frequency varies depending on the examination site. Whereas mean frequenc fluctuates around 6 cyclesmin-' at the forearm' and 8.5 cyclesmin-' at the forehead,I2 it is 5.6 cyclesemin-' at the forefoot as reported by Salerud et ul. lo Frequency of low frequency flow motion at the forefoot is somewhat lower in our study but comparable to the findings of Seifert and coworkers (3 cyclesmin-I). The difference may be explained by the fact that Salerud et a1 examined healthy subjects. Fluctuations of nailfold capillary red cell velocity and blood pressure were reported to be in a frequency range similar to low frequency
wave^.^'
LOW frequency pattern of flow motion did not change significantly in amplitude, frequency or prevalence before and after angioplasty.
High frequency waves, found in most of our patients before angioplasty, were recently described by Seifert and coworkers in patients with different degrees of ischaemia of the lower limbs." The main finding of our study is the significant decrease in prevalence of high frequency waves (p<O.O1-0.001) after successful angioplasty for severe ischaemia. Before treatment 10/11 patients showed high frequency waves; immediately after treatment, 4/11 patients, and one month after treatment, only 2/11 patients showed high frequency waves (table 11). In parallel, tcP02 and systolic ankle pressure improved gradually. The delayed improvement may be explained by two mechanisms involved in relief of severe ischaemia: postischaemic oedema for~nation,'~ and prolonged passive dilatation of arterioles after sudden pressure increase in low pressure areas because of smooth muscle cell atrophy of the arterior wall.2o The latter phenomenon may also account for late disappearance of high frequency waves in some patients. The realtively small differences in skin temperature obtained by the heating element in controls and patients are no plausible cause for changing prevalence of high frequency flow motion before and after therapy.In two cases, high frequency waves were still present one month after successful treatment. Whereas one patient showed no remaining significant stenosis after angioplasty, the other had cross sectional occlusions of the calf arteries. This finding is in agreement with Seifert et al, who occasionally found high frequency flow motion in healthy persons and in four of 12 patients with mild intermittent claudication."
In contrast to the successfully treated subjects, high frequency flow motion persisted in patients with failed angioplasty. In two cases, this pattern of flow motion was not observed before, but occurred one day after unsuccessful treatment. These findings strongly support the hypothesis that high frequency flow
motion in the human
skin
microcirculation is related to ischaemia.Several investigators reported on two distinct frequency components in arteriolar dynamics, namely larger arterioles exhibiting a slow periodicity, and terminal arterioles with calibre changes of higher freq~ency.'~ 21 Additionally, it was shown that vasomotion frequency increases as the vessels become In several studies vasomotion frequencies up to 32 cycles*min-' have been described in terminal arterioles.2 l7 21 Dir ect comparison of experimental data and human
findings
remains open to discussion. Nevertheless, the hypothesis may be advanced that high frequency flow motion waves originate from precapillaries and low frequency flow motion waves from larger arterioles.In contrast to the hypothesis of precapillary vasomotor activity in severe ischaemia, Slaafet and Meyer and coworkers" found in a tenuissimus muscle preparation from the rabbit that arteriolar vasomotion ceases after a certain decrease in blood pressure. However, comparison is difficult since the clinical situation of chronic skin ischaemia is different from acute reduction of blood supply in muscle tissue. In the most severe ischaernia flow motion may also be abolished in human skin."
The pathophysiological role of high frequency waves representing a frequent microvascular phenomenon in severe ischaemia remains unclear. If we assume that high frequency waves reflect periodic opening and closing of precapillary vessels, this would result in improved flow during the opening phase, especially if
there is a synchronous activity of the terminal arterioles in distinct skin areas. Accordmg to a theoretical model proposed by Intaglietta:3 oscillatory flow would enhance exchange of fluid and waste products between perivascular tissue and microvessels. High frequency waves may be interpreted as a compensatory mechanism under conditions of ischaemia.
Enhancement or induction of low frequency waves during reactive hyperaernia has been reported in healthy subjects.24
This
phenomenon, probably due to the arteriolar myogenic response to intravascular pressure changes during initial postocclusive hyperaemia, was lacking in all patients one day after unsuccessful angioplasty, suggesting a substantially diminished pressure increase during hyperaemia. After successful treatment the phenomenon occurred more frequentlythan
it did before.Flux at rest was not a reliable measure to characterise skin perfusion before and after angioplasty. Broad variability of resting flux values confines the potential for quantification of skin i s ~ h a e m i a . ~ ~ 26 Peak flux, and especially time to peak flux, were better suited for this purpose.
The authors are indebted to Mrs WamGeiger for her skilful technical assistance.
718 Ulrich Hofmnn, Ernst Schneider, Alfied Bollinger
I Chambers R, Zweifach BW. Functional activity of the blood
capillary bed, with special reference to visceral tissue. Ann NY
Acad SCI 1944;46:683-94.
2 Johnson K, Wayland H. Regulation of blood flow in single capillaries. A m y Phyriol 1%7;212:1405-15.
.% Bollinger A, Butti P, Barras JP, Traschsler,H, Siegenthaler W.
Red blood cell velocity in nailfold capillaries of man measured
by television microscopy technique. Micrmarc Res
4 Fagrell B, lntaglietta M, Oestergren J. Relative hematocrit in
human skin capillaries and its relationship to capdlary blood
flow velocity. Micrmasc Rer 1980;20:327-35.
! Mahler F, Muheim MH, Intaglietta M, Bollinger A, AnWrer M.
Blood pressure fluctuations m human nailfold capillaries. A m 3
G Colaotuoni A, Berm& S, Intaglietta M. Quantitation of
rhythmic diameter chsnges in arterial microcirculation. Am 7
7 Funk W, Endnch B, Messmer K, Intaglietta M. Spontaneous
arteriolar vasomotion as a determinant of peripheral vascular
resistance. InrJ Minocirc 1983;2:11-25.
8 Holloway GA, Watkins DW. Laser Doppler measurement of
cutaneous blood flow. 3 Inwrr Dennor01 1977;69:30&9.
Y Nilsson GE, Tenland T, Oberg PA. Evaluation of Laser-Doppler
flowmeter for measurement of tissue blood flow. IEEE Truns
B i m d Eng BME 1980;27:597-604.
10 Salerud EG, Tmland T, Nilsson GE, &berg PA. Rhythmical
variations in human skin blood flow. InrJ Mirrocirc Clin Exp
1983;2:91-102.
I i Seifen H, Jiiger K, Bollinger A. Analysis of flow motion by the
laser Doppler technicye ip patien? with peripheral arterial
occlusive disease. I N
12 Smits TM, Aamoudse JG, Gurdnik JJ, Zigjlstra WG.
Hyperventilation-induced changes in periodic oscillations in
forehead s+ blood flow measured by laser Doppler flowmetry.
Inif M i r o c v c Clin Exp 1987;6:14%59.
I ? Huch R, Huch A, Lubbers DW. TrunscufanemPO,. New York:
Thieme-Stratton, 1981.
la Schwider E, Griintzig A, Bollinger A. Die perkutane
1974;7:61-72.
rbrioi i979;2~:~888-93.
~srioi 1 9 ~ ; ~ : ~ 5 0 8 - 1 7 .
M m m c Clrn Exp 1988;7:22%36.
t r a n s l d e m o p l a s t i e (PTA) m den Stahen 111 und IV der
Denohem anenellen Verschlusskrankheit. VASA
~
1982;4:336-9.
15 Hess H, Ingrisch H, Mietaschk A, Rath H. Local low-dose
thmmbolytic therapy of peripheral arterial occlusions. N EnglJ
Med 1982;307:1627-30.
16 Franzeck UK, T a k e P, Bernstein EF, Goldbranson FL, Fronek
A. Transcutaneous PO*-measurements in health and penpheral
arterial occlusive disease, Surgey 1982;91:156-63.
17 Mever JU, Bomtr6m P, Lmdbom L, Intaalietta M. Vasomotion
pattgms in &etal muscle arteriol& d& changes in arterial
pressure. Mirrooarr Rer 1988;35:19?-203.
18 Tooke JE, Oestergren J, Fagrell B. Synchronous assessment of
human skin microcirculation by laser Doppler flowmetry and
dynamic ca illaroscopy. IntJ Micwcirc 1983;2:277-84.
19 Strandcn E. fraascapillary fluid filtration in patients with leg
edema following arterial reconstruction for lower limb
atherosclerosis. VASA 1983;12:21%24.
20 Wellington JL, Olszewski P, Martin P. Hyperemia of the calf after
arterial rtconsuuction for atherosclerouc occlusion. B r 3 Surg 1966;53:18M.
21 Schmid-Sch6nbein H, K!itzmannB, JohnsonPJ. Vasomot/onand
blood rheology: m t e n a n c e of blc+ fluidlty m the
microvessels bv , rhvthmic < vasomouon. Bib1 Anat
198 1 ;20: 138-43.
22 Slaaf DW, Tangelder GJ, Teirlinck HC, Renemann RS.
Arteriolar vasomotion and arterial pressure reduction in rabbit
tenuissimus muscle. M m m c Rer 1987;33:71-80.
23 lntaglietta M. Vasomotor activity, timedependent fluid exchange
and tissue pressure. Mcrrov~rc Res 1981;21:153-64.
24 Wilkin JK. Periodic cutaneous blood flow during postocclusive
reactive h y p c m . A m J Physiol 1986;250:H765-8.
2 5 Pabst TS, CPstrunuovo JJ, Jackson SD, Schuler JJ, Flanigan DP.
Evaluation of the ischemic Limb by pressure and flow
measurements of the skm microcirculation as determined by
laser Doppler velocimetry. Current Surg 1985;42:2%31.
26 Tenland T, Salerud EG, Nilsson GE, &berg PA. Spatial and
temporal variations in human skin blood flow. InrJ Mimcrrc