THE BOSTON HOME MORTGAGE MARKET
by
James Warren Hanson
B.S., University
(1947)M.A., University
(1949)
of Nebraska of NebraskaSUBMITTED IN PARTIAL FULFJILJLMENT OF THE REQUIREMENTS FOR THE EGEE OF
DOC'OR OF PHILOSOPHY
at the
MASSACHUSETTS INSTITUTE OF TECHNOLOGY (1952)
Signature of
Certified by
0*.0@. * 0 00 00
Author.
Dtartin
of -Rnnomiresn4, Ann'n' Sciences,July 31, 1952
... .. .. 0 .. . .. .. ..
Thesis Supervisor
Departmental Commifttae
n Graduate Students
Chaii-man,Vi ~Th c~ 25 Ferguson Road Malden, Massachusetts July
51,
1952Professor Leicester F. Hamilton Assistant Secretary of the Faculty Massachusetts Institute of Technology Cambridge
39,
MassachusettsDear Professor Hamilton:
In accordance with the requirements
I herewith submit a thesis entitled "The
Market. '
for graduation, Boston Home Mortgage
Sincerely yours,
iii
THE BOSTON HOME MORTGAGE MARKET
Submitted in
partial
fulfillment of the requirements for the
degree of Doctor of Philosophy, July 31, 1952.
This study represents an attempt at analyzing the economic
forces underlying home mortgage lending in the Boston market. In
contrast to a great many related studies conducted on a nationwide
basis, the present analysis is largely confined to a restricted
geographic area.
Relevant data have-been gathered from a wide
variety of sources, but an inherent lack of comparability limits
the validity of any conclusions
drawn from these data alone. To
supplement these sources, valuable insights into market behavior
have been acquired through a series of fifty interviews with the
managements of local mortgage lending institutions and other
in-formed parties.
The earlier chapters
of the study consider some of the primary
factors underlying tke demand for and the supply of home mortgage
credit.
In each case,
specific reference to the Boston situation
are preceded by a brief theoretical analysis.
The role of the
vari-ous thrift institutions in the local savings market is summarized,
followed by an analysis of dividend returns on different types of
savings accounts.
Home financing has frequently been the focus of extensive
interventionary efforts on the part of state and federal
govern-ments.
Part IV considers 'the salient features of some of these
programs as well as the underlying institutional background.
Primary emphasis is placed upon the activities of the Home Loan
Bank System and the Federal Housing Administration.
Home mortgage lending in the Boston area is analyzed in some
detail in Part V, concentrated primarily on the postwar situation
but with brief reference io the interwar period as well. Among
the most striking features of local market behavior are the.rapid
rise of federal savings and loan associations during the prewar
recovery years and a resurgence of
mutual savings banks into
domi-nance after 1946.
The methods employed in realizing these
signifi-cant gains are analyzed, considering both price and non-price
com-petitive tactics. Some insights have been gained in regard to the
lending areas of various mortgagee types, as well as the reasons
ac-counting for the continuing co-existence of adjacent institutions
with vastly differing interest rate schedules. The growth patterns
and mortgage lending policies of the five largest savings banks and
cooperative banks
are compared with those of all such thrift
insti-tutions in the Boston
area.
In Part VI attention is directed to the utilization of the home
loan programs of the Federal Housing Administration and Veterans
Ad-ministration. Whereas both programs have enjoyed wide acceptance
throughout the nation, only the latter has played a prominent role
in the local postwar mortgage expansion. Several reasons are advanced
to account for this striking difference, chief among which concerns
the inherent capital surplus characteristics of the Boston market.
Part VII
considers the development
of an effective
secondary
mortgage market and the strategic role assumed by the federal
gov-ernment up to this point.
Local life insurance companies, savings
banks, and commercial banks have invested vast amounts of long-term
capital in insured and guaranteed mortgages throughout the nation.
The concluding Part VIII deals first with the adequacy of the
existing mortgage interest rate structure to properly compensate for
the various implicit cost components.
In most cases, local lending
institutions have been able-
to accumulate generous surplus reserves
and appear to be well fortified against a possible downturn in
eco-nomic activity and an attendant rise in mortgage foreclosure.
The
final section analyzes the favorable influence
of federal
interven-tionary efforts upon the competitive structure of the Boston
mort-gage market, particularly with reference to the activities of the
Federal Housing Administration and Home Loan Bank System.
ACKNOWLErMENTS
In preparing this study, the author has benefited
greatly from a series of fifty interviews with the man.
agements of lending institutions of various types and
sizes, and with other informed parties. Many of the
data presented in the text have been made available
through the generous efforts of Miss Ruth Gordon of the
Metropolitan Mortgage
Bureau, Mr. Parker Willis of the
Federal Reserve Bank of Boston, Mr. Paul Heywood of the
Federal Home Loan Bank of Boston, and Mr. Kenneth
McDougall of the Mutual Savings Banks Association of
Massachusetts.
The author is most appreciative of the efforts of
Professor John Lintner of Harvard University, under
whose encouragement and guidance this study has been
conducted. Special thanks should also be extended to
the Bemis Foundation of M.I.T. and its able director,
Professor Burnham Kelly, not only for the offering of
a generous fellowship but also for assistance in
sug-gesting
the contents of this study. The author is also
indebted to Mrs. Dorothy Calkins for her skillful
steno-graphic efforts. Finally, he wishes to express his
sin-cere appreciation to his wife for her stimulation and
limitless assistance in the preparation of this thesis.
TABLE OF CONTENTS
PART I. CHAPTER I. INTRODUCTION 1
PART II. DEMAND FORCES: THE MORTGAGOR 13
CHAPTER 2. SOME THEORETICAL CONSIDERATIONS 13
THE HOUSING MARKET 13
The Rate of Utilization of Housing Facilities .16
Anticipating Price Changes 22
Rental- vs. Owner-Occupancy 24
MORTGAGE DEMANDS OF OWNER-OCCUPANTS 28
PRICE OF MORTGAGE CREDIT 31
Monthly Debt Service 32
INTERNAL RATE OF DISCOUNT
1
CHAPTER 3. HOME MORTGAGE DEMAND IN METROPOLITAN BOSTON 49 ECONOMIC CHARACTERISTICS OF THE BOSTON AREA
49
THE BOSTON HOUSING MARKET
53
Characteristics of Housing Stock in Metropolitan Boston
56
Mortgage Indebtedness 60
Prices of' Homes in Metropolitan Boston 61
PART III. SUPPLY FORCES: THE MORTGAGEE 65
CHAPTER
4.
SOME INSTITUTIONAL AND THEORETICAL CONSIDERATIONS 65DECLINE OF INDIVIDUALS AS MORTGAGEES 67
CIRCULAR FLOW ANALYSIS 69
Straight-term and Fully Amortized Loans 72 MORTGAGES AS AN INVESTMNT FOR THRIFT INSTITUTIONS 75
MORTGAGE RISK AND PROBABILITY THEORY 83
ADVANTAGES OF INSTITUTIONS AS MORTGAGE LENDERS 87 CHAPTER
5.
MAJOR SOURCES OF MORTGAGE CREDIT IN METROPOLITAN BOSTON 92THRIFT INSTITUTIONS 92
COOPERATIVE BANKS
94
Sources of Capital 96
Investment Opportunities 100
Cooperative Banks in the Boston Area 107
FEDERAL SAVINGS AND LOAN ASSOCIATIONS 110
Savings Capital 112
Investments
114
Federal Savings and Loan Associations in the Boston Area 116
MUTUAL SAVINGS BANKS 124
Historical Development 125
Decline in Prominence 127
Investment Opportunities 135
COMMERCIAL BANKS
143
Savings Department in Local Trust Companies 151
DIVIDEND RETURNS ON SAVINGS ACCOUNTS 152
Interest Elasticity 157
MISCELLANEOUS MORTGAGE LENDING INSTITUTIONS 162
Life Insurance Companies 162
Credit Unions 164
vii
PART IV. THE METROPOLITAN BOSTON HOME MORTGAGE MARKET: A PREWAR SETTING 170 CHAPTER 6. WEAKNESSES IN PRE-DEPRESSION MARKET 171
CHAPTER 7. GOVERNMENT INTERVENTION 181
INTERVENTION'BT STATE GOVERNMENTS 183
FEDERAL HOME LOAN BANK SYSTEM 185
Services Rendered 187
Sources of Funds 189
HOME OWNERS LOAN CORPORATION 190
FEDERAL SAVINGS AND LOAN ASSOCIATIONS 192
FEDERAL SAVINGS AND LOAN INSURANCE CORPORATION 194
CHAPTER 8. FEDERAL HOUSING ADMINISTRATION 199
MUTUAL MORTGAGE INSURANCE SYSTEM 201
The Mutual Mortgage Insurance Fund 201
Guaranteed Mortgages and Mortgage Bonds 204
FHA Insurance System 205
Adequacy of FHA Insurance Premiums 207
Risk Analysis Prescribed By The FHA 210
Mortgage Contract Required or Recommended 215
Interest Rates 216
Length of Loan Term
218
Amount of Loan
220
Method of Repayment 221
EMERGENCY ASPECTS OF THE FHA PROGRAM 223
FEDERAL NATIONAL MORTGAGE ASSOCIATION 226
VETERANS ADMINISTRATION HOME LOAN PROGRAM 229
PART V. HOME MORTGAGE LENDING IN THE BOSTON MARKET 233
CHAPTER 9. MORTGAGE LENDING IN THE BOSTON MARKET UP TO
1946
233COOPERATIVE BANKS AND FEDERALS 234
Recovery Period 237
Reasons for Relative Gain 240
COMMERCIAL BANKS
243
SAVINGS BANKS
244
Reasons for Decline in Mortgage Portfolios 246
Loan-value Ratios 253
OTHER MORTGAGE LENDING INSTITUTIONS 256
CHAPTER 10. POSTWAR HOME MORTGAGE LENDING IN THE BOSTON MARKET 260 DISTRIBUTION OF THE OUTSTANDING MORTGAGE DEBT 260
Types of Mortgaged Properties 266
NEW MORTGAGE LENDING SINCE 1946 267
COOPERATIVE BANKS 270
FEDERAL SAVINGS AND LOAN ASSOCIATIONS 274
SAVINGS BANKS 275
COMMERCIAL BANKS 280
viii
CHAPTER 11. PRICE OF HOIME MORTGAGE CREDIT 284
INTEREST RATES 284
OTHER FEES 291
LOAN-VALUE RATIOS 294
LOAN TERM 299
VARIABLE VS. FIXED INTEREST RATES 301
CHAPTER 12. OTHER LENDING PRACTICES 307
METHOIS OF OBTAINING MORTGAGE BUSINESS 308
Construction Loans 308
Brokers 315
Price Cutting 319
Advertising and Nonprice Competition 325
LOAN AMOUNTS AND PROPERTIES MORTGAGED 329
LENDING AREA 334
INDIVIIUALS AS LENDERS IN CERTAIN COMMUNITIES
346
ADDED COMMENTS ON LARGEST MORTGAGE LENDERS349
Savings Banks 350
Cooperative Banks
355
Federal Savings and Loan Associations 361
PART VI. CHAPTER 13. UTILIZATION OF FHA AND VA HOME LOAN PROGRAMS IN
THE BOSTON AREA 363
NATIONWIDE DATA 363
VA Program
366
Lending Institutions
367
FHA OPERATIONS IN THE BOSTON AREA
371
Title I Activity in the Boston Area 374
Local Thrift Institutions in Insured Home Mortgage Lending 375
FHA as As Aid .in New Construction 380
VA Home Loan Program in Boston Area 385
Reasons for Low Level of FHA Operations in Boston Area 390
Opposition of Savings and Loan Interests 391
Administrative Detail 392
FHA Foregone in Favor of VA
395
Capital Surplus Area 0
The Interest Rate Paradox
406
Local FHA Loss Experience 408
PART VII. CHAPTER 14. SECONDARY MORTGAGE MARKET
411
NEED FOR SECONDARY MARKET 411
TECHNOLOGICAL IMPEDIMENTS
414
Remedial Action
417
STATUTORY IMPEDIMENTS
419
SECONDARY MARKET PURCHASES OF LOCAL INSTITUTIONS 423 FNMA EFFORTS IN THE NATIONWIDE SECONDARY MARKET
434
Nationwide Activity
434
Local FNMVA Activity
4)1
SUMMARY AND PROSPECTS
444
ix
SOUNDNESS OF MORTGAGE PORTFOLIOS
452
Cost Components
455
Favorable Risk Factors
459
Loss Reserves
463
IMPACT OF FEDERAL INTERVETION UPON COMPETITIVE STRUCTURE
467
Prewar Competitive Structure
470
Postwar Structure
474
x
TABLES PART II
I. COST COMPARISONS ON 20-YEAR AMORTIZED LOANS OF $1000 AT VARIOUS
RATES OF INTEREST
34
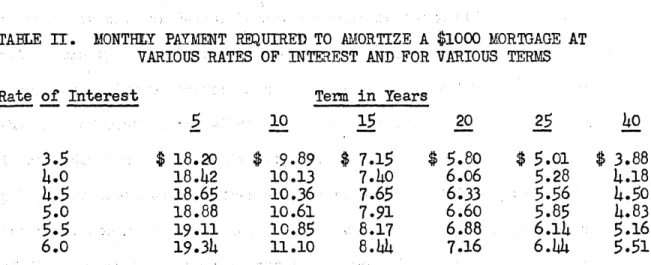
II. MONTHLY PAYMENT REQUIRED TO AMORTIZE A $1000 MORTGAGE AT VARIOUS
RATES OF INTEREST AND FOR VARIOUS TERMS 37
III. LOAN AMOUNT AMORTIZED BY CONSTANT MONTHIY PAYMENTS OF $50, AT
VARIOUS RATES OF INTEREST AND FOR VARIOUS TERMS 38 IV. INTEREST COMPONENT AS A PER CENT OF TOTAL IEBT PAYMENT FOR CONSTANT
MONTHLY PAYMENT MORTGAGES, AT VARIOUS RATES OF INTEREST AND FOR
VARIOUS TERMS
hl
V. PRESENT VALUE OF A SERIES OF n MONTHLY PAYMENTS OF R DOLLARS,
DIS-COUNTED AT A YEARLY NOMINAL RATE OF d PER CENT, CONVERTED MONTHLY
45
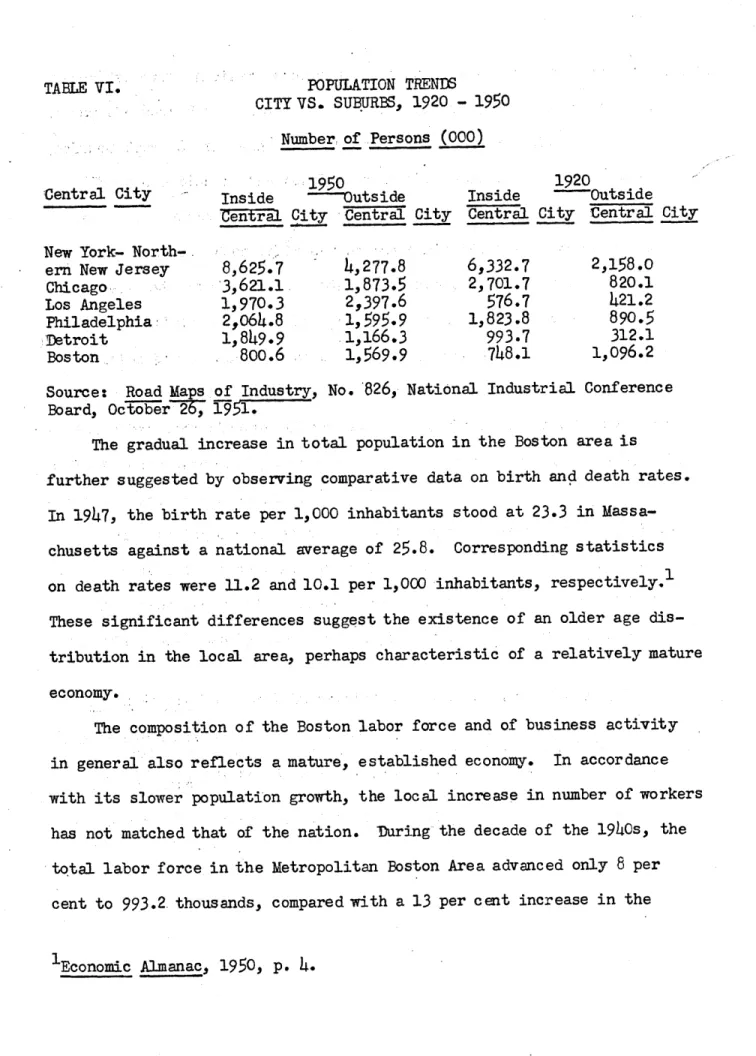
VI. POPULATION TRENDS CITY VS. SUBURBS, 1920 - 195050
VII. BUILDING PERMIT APPLICATIONS FOR RESIDENTIAL PURPOSES IN SELECTEDMUNICIPALITIES IN MASSACHUSETrS, SELECTED YEARS, 1925-1950
55
VIII. RELATION BETWEEN NEW HOME CONSTRUCTION AND TOTAL MORTGAGE RECORDINGSON 1- TO 3-FAMILY PROPERTIES IN FIVE METROPOLITAN BOSTON COMUNITIES,
1946-1950 56
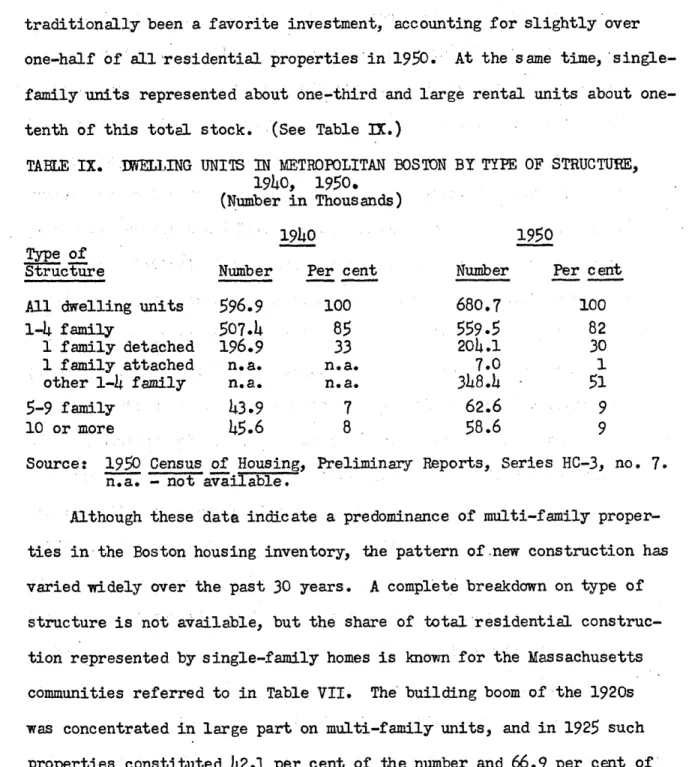
IX. IWELLING UNITS IN METROPOLITAN BOSTON BY TYPE OF STRUCTURE, 1940, 1950
57
X. TENURE STATUS OF INELLING UNITS IN THE BOSTON STANDARD METROPOLITANAREA, 1940, 1950
59
XI. MDRTGAGE STATUS OF OWNER-OCCUPIED NONFARM IWELLING UNITS, BY LOCATION
OR PROPERTT, EARLY 1951 61
XII. AVERAGE SALES PRICE OF ALL HOMES PURCHASED IN TEN MUNICIPALITIES IN
METROPOLITAN BOSTON, 1948-1951
63
XIII. RESALE ACTIVITY IN MIDDLESEX AND NORFOLK COUNTIES, MASSACHUSETTS,
1946-1951 63
PART III.
I. COMPARATIVE PORTFOLIO COMPOSITION UNDER STRAIGHT-TERM AND FULLY
AMORTIZED MORTGAGE LENDING 73
II. AMORTIZATION OF PRINCIPAL ON A LOAN OF $10,000 FOR 25-YEAR TERM AT
5
PER CENT INTEREST RATE, 77III. NET LOSSFS CHARGED OFF ON iORECLOSED REAL ESTATE AT TIME OF SALE, IN DOLLAR VOLUMAE, AND AS A PERCENTAGE OF THE TOTAL BOOK VALUE OF ESTATES SOLD BY ALL MASSACHUSETTS SAVINGS BANKS, SELECTED YEARS,
IV. AVERAGE EXPENSE RATES PER $1, 000 FOR ALL MASSACHUSETTS SAVINGS
BANKS AND COOPERATIVE BANKS IN MASSACHUSETTS, BY SIZE GROUPS, 195D 88 V. PRINCIPAL SOURCES OF CAPITAL FUNDS IN MASSACHUSETTS COOPERATIVE
BANKS, AS A PER CENT OF TOTAL LIABILITIES, SELECTED YEARS, 1920-1951 99 VI. NUMBER, TOTAL ASSETS, AND AVERAGE ASSETS OF COOPERATIVE BANKS IN
THE BOSTON AREA, SELECTED YEARS, 1927-1951 108
VII. SIZE DISTRIBUTION OF COOPERATIVE BANKS IN THE BOSTON AREA,
APRIL 1951 109
VIII. COOPERATIVE BANKS IN THE BOSTON AREA CONVERTING INTO FEDERAL
SAVINGS AND LOAN ASSOCIATIONS 1935-1937 119
IX. TOTAL AND AVERAGE ASSETS HELD BI FEDERAL SAVINGS AND LOAN
ASSOCIATIONS IN 1iE BOSTON AREA, SELECTEL YEARS, 1936-1951 121 X. SIZE DISTRIBUTION OF FEDERAL SAVINGS AND LOAN ASSOCIATIONS IN
THE BOSTON AREA, DECEMBER 31, 1951 123
XI. PERCENTAGE DISTRIBUTION OF SAVINGS DEPOSITS IN MASSACHUSETTS AMONG MUTUAL SAVINGS BANKS, .SAVINGS DEPARTMENTS OF COMMERCIAL
BANKS, AND SAVINGS AND LOAN ASSOCIATIONS, SELECTED YEARS,
1910-1950 129
XII. PERCENTAGE DISTRIBUTION OF ASSETS IN MASSACHUSETTS SAVINGS BANKS,
SELECTED YEARS, 1920-1951 139
XIII. NUMBER, TOTAL ASSETS, AND AVERAGE ASSETS OF SAVINGS BANKS IN THE
BOSTON AREA, SELECTED YEARS, 1927-1951 142
XIV. ASSET SIZE DISTRIBUTION OF SAVINGS BANKS IN THE BOSTON AREA, 1951 142 XI. TOTAL AND AVERAGE ASSETS OF SAVINGS DEPARTMENTS IN TRUST COMPANIES
IN THE BOSTON AREA, SELECTED YEARS, 1927-1950 151
PART IV
I. NOMINAL ANNUAL YIELD, CONVERTED SEMI-ANNUALLY, OF
5
PER CENT FHA-INSURED LOANS PURCHASED AT PAR AND EXCHANGED FOR 23/4
PERCENT DEBENTURES 210
PART V
I. TOTAL MORTGAGE PORTFOLIOS OF COOPERATIVE BANKS, FEDERAL SAVINGS
AND LOAN ASSOCIATIONS, SAVINGS DEPARTMENTS OF TRUST COMPANIES,
AND SAVINGS BANKS IN THE BOSTON AREA, SELECTED YEARS, 1927-1951 236 II. TOTAL DOLLAR VOLUME AND PERCENTAGE DISTRIBUTION AMONG VARIOUS
INSTITUTIONS OF MORTGAGE RECORDINGS OF $20,000 OR LESS ON NONFARM
xii
III. TOTAL AND PERCENTAGE DISTRIBUTION AMONG MORTGAGEE TYPES OF FIRST MORTGAGES ON 1- TO 4-FAMILY OWNER-OCCUPIED NONFARM
PROPERTIF, BOSTON METROPOLITAN DISTRICT, 1940 256 1V. NUMBER OF REGISTRANTS, PRINCIPAL TYPES OF MORTGAGES HELD,
AND VOLUME OF MORTGAGES SERVICED BY EACH LENDER GROUP IN
FOUR MASSACHUSETTS COUNTIES, MAY 31, 1951 263
V. PERCENTAGE DISTRIBUTION OF THE PRINCIPAL TYPES OF MORTGAGES HELD BY THE MAJOR LENDING GROUPS, IN FOUR MASSACHUSETTS
COUN-TIES, MAY 31, 1951 266
VI. TOTAL VOLUME AMONG VARIOUS INSTITUTIONS OF MORTGAGE RECORD-INGS OF $20, 000 OR LESS ON NONFARM PROPERTIES IN FOUR
MASSA-CHUSETTS COUNTIES, MIDYEAR 1946-EARLY 1952 269 VII. AVERAGE LCAN AMOUNTS ON MORTGAGES OF $20,000 OR LESS RECORDED
BY VARIOUS LENDERS IN FOUR MASSACHUSETTS COUNTIES, MIDYEAR
1946-EARLY 1952 273
VIII. POSTWAR MORTGAGE LENDING ACTIVITY OF SAVINGS BANKS IN THE
BOSTON AREA, 1946-1951 279
II. AVERAGE CONTRACT RATES OF INTEREST ON REAL ESTATE LOANS HELD BY COOPERATIVE BANKS IN THE BOSTON AREA, SELECTED YEARS,
1927-1951 285
X. AVERAGE CONTRACT RATES OF INTEREST ON REAL ESTATE LOANS HELD
BY SAVINGS BANKS IN THE BOSTON AREA, SELECTED YEARS, 1926-1951 286 XI. LOAN-VALUE RATIOS FOR SMALL RESIDENTIAL PROPERTIES PURCHASED
AND MORTGAGED IN THREE TfPES OF COMMUNITIES IN THE BOSTON AREA,
LATE 1945-EARLY 1946 295
XII. NEW SINGLE-FAMILY HOUSES COMPLETED IN THE FOURTH QUARTER OF 1950, BY TYPE OF MORTGAGE TRANSACTION, AND BY AVERAGE PURCHASE PRICE, LOAN-VALUE RATIO, AVERAGE MONTHLY PAYMENT, DURATION,
AND INTEREST RATE, BOSTON METROPOLITAN AREA 297 XIII. NUMBER OF MORTGAGES RECORDED BY SAVINGS BANKS, COOPERATIVE BANKS,
AND FEDERAL ASSOCIATIONS ON PROPERTIES WITHIN CERTAIN COMMUNI-TIES OF METROPOLITAN BOSTON, CLASSIFIED ACCORDING TO LOCATION OF LENDER AND LOCATION OF PROPERTY, 1946-1951 338 XIV. NUMBER OF MORTGAGES RECORDED BY VARIOUS TYPES OF LENDING
INSTI-TUTIONS ON PROPERTIES -LOCATED WITHIN CERTAIN LOCAL COMMUNITIES,
1946-1951 340
XV. PROPORTION OF TOTAL MORTGAGE RECORDINGS MADE BY INDIVIDUAL LENDERS IN FOUR COMMUNITIES AS REPORTED DURING THE FIRST WEEK OF EACH
xiii
XVI. COMPARISON OF MORTGAGE ACTIVITY OF THE FIVE LARGEST SAVINGS
.BANKS WITH THAT OF ALL SAVINGS BANKS IN THE BOSTON AREA, 1927-1951 350 XVII. COMPARISON OF MORTGAGE PORTFOLIOS OF THE FIVE LARGEST WITH THOSE
OF ALL COOPERATIVE BANKS IN THE BOSTON AREA, 1927-1951
356
PART VI.I. PROPORTION OF MORTGAGE LOANS ON 1- 10
4-
FAMILY IfELLINGS AND OF PRIVATE NONFARM STAR TS UTILIZING FHA AND VA PROGRAMS,1936-1951
364
II. PARTICIPATION OF VARIOUS LENDING INSTITUTIONS IN THE OVERALL HOME MORTGAGE MARKET FHA AND VA HOME IDAM PROGRAMS IN THE
UNITED STATES, 1950 370
III. 3ARIYVOLUME OF FHA-INSURED HOME MORTGAGES MADE ON 1- TO
4-FR[LY DIELLINGS LCCATED IN THE BOSTON METROPOLITAN 'DISTRICTSE[ECTED YEARS, 1935-1950 373
IV* RESIDENTIAL MORTGAGE HOLDINGS OF MAJOR LENDER TYPES IN ESSEX,
MIDDLESEX, NORFOLK, AND SUFFOLK COUNTIES, MAY 31, 1951
376
V. TYPE OF INSTITUTION ORIGINATING FHA-INSURED HOME MORTGAGES INBOSTON METROPOLITAN DISTRICT, 1940 380
PART VII
I. RATIO OF CONSTRUCTION TO SAVINGS IN FEDERAL RESERVE DISTRICTS,
1948 413
II. PURCHASES OF FHA-INSURED AND VA-GUARANTEED MORTGAGES FROM FNMA BY LENDING INSTITUTIONS IN THE BOSTON AREA, AUGUST
5,
1949xiv
CHARTS PART I
I. BOSTON HOUSING AREA 31
PART II
I. NUMBER OF PRIVATE NEW PERMANENT NONFARM UNELLING UNITS STARTED 21 ANNUALLY IN THE UNITED STATES, 1920-1951
II. LEVEL MONTHLY PAYMENT REQUIRED TO AMORTIZE A $1,000 MORTGAGE AT 39
VARIOUS INTEREST RATES AND LOAN TERMS PART III
I. AVERAGE RATES OF RETURN PAID BI COOPERATIVE BANKS, FEDERAL SAVINGS 153
AND LOAN ASSOCIATION, MUTUAL SAVINGS BANKS, AND SAVINGS DEPARTMENTS OF TRUST COMPANIES IN MASSACHUSETTS, 1926-1951
PART IV
I. PERCENTAGE DISTRIBUTION OF THE AGGREGATE MORTGAGE PORTFOLIO HELD BY SAVINGS BANKS, COOPERATIVE BANKS, FEDERAL SAVINGS AND LOAN
ASSOCIA-TIONS AND TRUST COMPANIES IN THE BOSTON AREA, 1927-1950 239
II. PERCENTAGE DISTRIBUTION AMONG MAJOR LENDING GROUPS OF MORTGAGE RE- 271 CORDINGS OF $20, 000 OR LESS ON NONFARM PROPFRTIES IN FOUR
MASSA-CHUSETTS COUNTIES, MID-YEAR 1946 - EAR 1952 PART VI
I. AVERAGE PRICE PAID FOR HOMES PURCHASED IN FIVE COMMUNITIES IN LATE 390
PART I.
CHAPTER 1.
INTRODUCTION
The home ortgage market performs a vital function in any economy
where individual home ownership .predominates.
By providing long-term
financing, mortgage lenders have facilitated home purchase among
fami-lies lacking the financial resources to pay cash in full. Inasmuch as
the various contract provisions offered by mortgage lenders affect
overall opportunities for home ownership, the mortgage network is
intimately connected
with the socio-economic welfare of the community
and nation. Largely because of this close inter-relationship, home
financing has frequently been the focus of extensive intervention on
the part of state and federal governments.
Not only has
the mortgage network made home ownership possible
for millions of families otherwise destined to be tenants, but it has
also provided institutional investors a highly desirable investment
outlet.
For many thrift institutions savings capital has always been
directed primarily into mortgage channels, regardless of minor
develop-ments in other financial markets. By making such investdevelop-ments, local
savings institutions not only discharge an essential community
obliga-tion but realize net yields which on the average compare quite favorably
with those on alternative investments. Unlike mortgage operations in
Europe, however, a specialized type
of mortgage lending institution has
not emerged as such
in this country, with the result that a wide variety
of lending agencies supply home financing needs.
The home mortage market, as the largest sector in urban real estate
financing, represents a major factor in the aggregate long-term capital
market.
De spite its continuing significance, however, home mortgage
lending has displayed a wide variation through the years, following to
some extent the violent fluctuations in new home construction as well
as general real estate activity. Largely because of the essentially
long-term nature of home financing as well as the low level of
repay-ment during depression periods, the outstanding debt has been somewhat more stable. Nevertheless, from a peak of $19.6 billion in 1930, thenationwide mortgage debt on 1- to 4-family dwellings fell to $16.7 billion by 1933, thereafter rose but slightly through the subsequent war years. During the postwar expansionary period, the home mortgage
network has been called upon to finance a housing boom of unprecedented
proportions, with the outstanding debt rising abruptly from $19.2
2
billion in 1945 to
$43.3
billion by 1951.
The structural composition of the urban mortgage debt is heavily
influenced by the type of dwelling unit dominating new construction.
Since the mid-1920s, there has been a pronounced shift away from large
rental units in favor of small 1- to 4-family homes. As a result,
the home mortgage segment of the aggregate urban mortgage debt has
steadily mounted in importance, rising from a low of 50.3
per cent in
1932 to 63.9 per cent by
1948.3
This pronounced shift is not wholly
the result of free market activity, however, for especially since the
lIn 1949, the $1l:3 billion private long-tem debt was distributed
into these broad categories: corporate debt,
$54.4
billion; farm
mortgages,
$5.4
billion; nonfarm mortgages, $51.5 billion. Economic
Almanac, 1951-2, National Industrial Conference Board, p.
216.
2
Survey of Current Business, Department of Commerce. For years up to
1949, see issue for October 1950.
depression years the rise in owner-occupancy has been heavily influenced
by federal interventionary measures.
Undoubtedly the most widely known instrument used in urban real
estate
finance is the
mortgage contract. The popular conception of
the mortgage as a debt is misleading and technically incorrect, as it
is simply a pledge
of collateral to secure
the accompanying note.
Since
both
are essential in
any mortgage transaction, however, the term
mort-gage will frequently be used throughout the study as a convenient
ab-breviation for the technically correct "mortgage loan."
The legal and institutional framework surrounding mortgage
fi-nancing has undergone substantial modifications through the years,
generally benefiting the rights and privileges of the debtor.
This
development has been far from uniform across the country, however,
with the result that foreclosure
and title laws vary widely among the
states.
Furthermore, land contracts and trust deeds are common in some
regions, while in others conventional mortgage. lending constitutes the
primary method of financing real estate transfers.
In the latter case,
the mortgage contracts written may be classified according to the
pri-ority attached to their claims. Where the borrower is able to secure
the necessary funds from a single source, only a first mortgage loan
is involved. Frequently, however, the proceeds of a single loan are
inadequate to supplement the limited savings of the mortgagor, with
the result that second and even third mortgage loans are sought for
See M. L. Colean, The Impact of Government On Real Estate Finance in
he United States,National Bureau of Economic Research, New York, 1950.
2
See E.
M. Fisher, Urban
Real
Estate Markets
and
Their Financing Needs,
National Bureau of Economic Research, New York~ 1951, Chapter II.
additional funds.
Most home mortgage contracts written in recent years have been
of two basic varieties in regard to principal repayment. A
straight-term mortgage provides for full repayment only after a fixed straight-term has
elapsed, while interest is payable on a monthly or quarterly basis.
Although such contracts are seldom written for terms exceeding 3 to
5
years, the essentially long-term character of home financing has
neces-sitated successive loan renewals if foreclosure is to be averted. The
obvious dangers involved in making straight-term mortgages have prompted
a universal preference among borrower and lender alike for fully
amor-tized loans.
As a popular
variant
of this second loan type,
direct-reduction mortgages specify level monthly payments for a stated number
of years,
by which time the debt is fully retired.
By making small
monthly payments, the home buyer accumulates
an increasing equity in
the property without being liable for large lump-sum payments. At the
same time, the lender is able to base his lending operations upon a
more predictable rate of repayment inflows, and is effectively spared
from extensive holdings of
frozen assets on which large due payments
cannot be collected. When level monthly mortgage payments are made
over the entire loan term, the interest
component generally absorbs
most of the earlier payments but the principal component
becomes
in-creasingly significant
as repayment proceeds. For example, on a 4 per
cent, 20-year mortgage, a level monthly payment of $6.06 per $1,000
1
Junior financing was especially
widespread before the recent
of original loan amount is required.
The interest component on the
first such payment is $3.33, but declines continuously with succeeding payments.An examination of the various contract provisions included in direct-reduction loans demonstrates the degree of complexity as well as flexibility in the mortgage price structure. Although contract
inter-est rates are generally regarded as the basic cost element in mortgage
lending, other elements are equally determining at least so far as
demand functions are concerned. With debt repayment arranged on a
convenient monthly
basis, home buyers are frequently more concerned
with the amount of this monthly payment than with the specific interest rate or loan term. In many cases the maximum loan amount granted on a given property is the all-determining factor in a prospective home purchase, especially where secondary financing is unavailable or un-wanted. In view of their widespread acceptance in recent years,direct-reduction mortgages have been tabbed as the innovation which has made home building the "biggest new industry since World War II."l
The rapid growth in mortgage operations during the postwar period, as well as increasing evidence of major structural changes in the
mort-gage
network itself, renders an analysis of home financing particularly
relevant at this time. The outstanding mortgage debt is at an unpre-cedented pea4 level, and portfolios of institutional lenders are filled with unseasoned, high-percentage loans based on highly inflated marketvaluations. At the same time, however, mortgage investors are
increas-Address of P. I. Prentice, editor and publisher of Magazine of Building,
at 1951 Convention of Mortgage Bankers Association of America, re-printed in Boston Sunday Herald, September 23, 1951.
ingly interested in the development of an effective secondary market,
whereby long-term home credit may flow freely from areas of surplus
to those of want.
Inasmuch as the home mortgage market constitutes a principal sector
in the economy, considerable attention has been focused upon these
developments throughout the nation. So that all parties concerned may
acquire a more thorough understanding of mortgage lending, its methods,
achievements, and shortcomings, various private and public groups have
conducted extensive research studies during recent years. In addition
to regular staff analyses by affiliated housing agencies, the central
Housing and Home Finance Agency has sponsored a series of local and
national studies to be conducted by numerous colleges and universities.
1Various private foundations have also undertaken serious analyses of
home mortgage lending, frequently with an eye toward a better
under-standing of the fundamental causes of the disasterous loss experience
of the 1930s. Through a realization of past errors in
mortgage policy,
lending institutions as well as governmental planners may become better
fortified against a repetition of this experience.
As might be expected, many such studies have been nationwide in
scope, analyzing the overall impact of various private and public
institutional forces upon the structure and behavior of the mortgage
market.
At the present time the National Bureau of Economic Research
is conducting a series of individual studies under a special Urban
Two such mortgage studies have been reviewed in Housing Research,
HHFA, Fall, 1951, dealing with both a small (Hagerstown, Md.) and
a metropolitan mortgage market (San Francisco.)
Real Estate Finance Project.
Some of these studies consider the overall
nature of the mortgage market, while others consist of statistical
sur-veys of lending operations of certain institutions since 1920.
At least
three of these investigations have already been published, while several
1
others are still in preparation.
In the prewar period, two studies of
a more regional nature were published, one dealing with cooperative
banking in Massachusetts and the other, savings banking in New York
State.
2During the early postwar
years, Professor Lintner conducted
a thorough study of the savings and mortgage activities of mutual savings
banks, concentrating
on the Massachusetts situation but having direct
application to the nationwide market.
3While aggregative analyses are admittedly essential in acquiring
an understanding of overall mortgage lending activity, the merits
of a restricted market study should not be overlooked. In the former,
lThose completed include Colean, The Impact of Government on Real
Estate
Finance in the United States; Saulnier, Urban Mortgage Lending by Life
Insurance Companies; Fisher, Urban Real Estate Markets and Their
Finan-cing Needs.
Studies yet to be published include analyses of Economic
Fluctuations and Urban Real Estate Finance, Commercial Bank Activities
in this field, HOLC operations, and Comparative Markets and Risk
Exper-ience of Mortgage Lenders.
2
D. H. Davenport, The Cooperative Banks of Massachusetts, Business
Research Studies No. 20, Graduate Schoolof Business Administration,
Harvard University, Boston, 1938;
W. Welfling, Savings Banking in New
York State, Duke University Press, Durham,
North Carolina, 1939.
3John lintner, Mutual Savings Banks in the Savings and Mortgage Markets,
Graduate School of Business Administration, Harvard University, Boston,
1948. This study was financed by the Savings Banks Association of
Massachusetts.
many significant differentials among the areas included are concealed
or largely offset by counterbalancing forces elsewhere.
When a small
area is concerned, prevailing relationships are heavily influenced by
institutional and legal factors peculiar to that area, and hence are
not readily applicable to all markets alike.
Nevertheless, due
allow-ance can often be made for such factors, and some significant behavior
patterns may be revealed from a local analysis of this nature.
The present study represents an attempt at shedding some light on
mortgage lending activity within the Boston area.
In contrast to
the
statistical nature of the various National Bureau surveys, this study
has depended upon personal interviews as a primary source of material.
Relevant data have been gathered from a wide variety of sources, but
their lack of comparability severely limits the validity of any
con-clusions drawn therefrom.
Such difficulties undoubtedly arise in most
empirical studies of this nature, but, by a careful and discriminating
examination of the available data, reasonably valid insights into
market behavior can often be gained. Where relevant data are completely
lacking, however, heavy reliance must be placed upon the informed
judgment of interviewed parties.
Since the sources cited in the text have compiled their data
for widely different purposes, the bases for inclusion and
classifi-cation are far from uniform. Some deal only with institutional holdings
of the outstanding mortgage debt as a whole, while others are concernedsolely with mortgages
on small 1- to 4-family properties.
The Bureau
homes, but in 1940 its home mortgage surveys were restricted to
owner-occupied dwellings.
Perhaps an even more limiting factor concerns the non-uniformity
in geographic coverage among the various sources. Although most data
refer to mortgage lending activity in the Boston area alone, some are
available only for Massachusetts or even for all of New England. Within
the more restricted area, the Federal Reserve Board breaks down their
findings only on a county-wide basis, whereas the Bureau of the Census
and the Bureau of Labor Statistics use the standard Boston
Metropolitan
Area as the covered territory.
The Metropolitan Area as defined by the
Census is almost wholly included within four counties surrounding Boston
proper, and constitutes slightly over four-fifths of the combined
popu-lation of these counties* Even when dealing in Census data alone,
however, full comparability is lacking because the "Metropolitan
Area"
as defined in 1950 was slightly less extensive than the "Metropolitan
District" of 1940, largely because of the elevation of the Brockton
vicinity to the status of metropolitan area in-the most recent survey.
11
)uDring the decade of the
1940s,
population increased roughly
9
per-
cent
(presumably for the same coverage), with the 1950 figure for the Boston
Standard Metropolitan Area being
2.37
million.
At the present time
there are 65 cities and towns included in this Area, distributed in
5
counties thus (1950 figures in thousands):
County Population within Met. Boston
%
of County Pop. within
Met. Bosto
Suffolk
896.6
100.0
Middlesex
852.3
80.0
Norfolk
339.0
86.5
Essex
268.2
51.4
Plymouth
14.0
7.4
Since such a small proportion of the Metropolitan Area is within
Plymouth County, only the first
h
counties
are
included in this study.
The total population of the
h
counties
was 2.88
million
in 1950,
-with
2.34 million being within the Metropolitan Area. 1950 Census of
Housing,
Preliminary Reports.
10
In view of the limited resources available for this project, more
concentrated analysis has been confined to mortgage operations in those
communities located wholly or in part thereof within a 10-mile radius
of Boston City Hall.
This restricted area includes
32
cities and towns,
and contains over 85 per cent of the total population of the Metropolitan
Boston Area.
(See Chart I.)
Most of the lenders interviewed are
lo-cated within this 10-mile region, and all data compiled from annual
reports of state- and federally-chartered thrift institutions are
similarly chosen. Unless the Standard Metropolitan Area or thefour-county region are mentioned by name, data presented in the text refer
to mortgage lending activity within the 10-mile area exclusively. This latter geographic area is alternately termed "Boston area," "immediateBoston vicinity, " "metropolitan Boston," etc.
For the most part, location of the lending institution rather
than pledged property is used as the basis for classification in this
study.
In other words, unless stated otherwise, data on mortgage
lend-ing activity within the "immediate Boston vicinity" refer to mortgage
operations of lenders with headquarters in this restricted area. While
it will be shown that most thrift institutions concentrate lending operations on properties within their immediate community, property location is not coincident with lender location in all cases. On thecontrary, several locally organized institutions, notably life insurance
companies, are relatively. active in the nationwide mortgage market but
are of minor importance in the local area. Because of the capital
surplus characteristics of the Boston market, most inter-regional flowsChart Io
LbOSTOIT QLf
lis
isea1
i~cntbic,,1. lr.th thooetropolit'n ",ron -I.)lofineou by; ' ',L, o -cuho Ceiisus.
.4- 4- T,). n o
of mortgage credit represent exported funds, with the reverse movement
being of negligible significance. In some cases, however, data are
classified according to property location in which event valuableinsights can be gained into policies regarding geographic lending areas among local thrift institutions.
This study is concerned primarily with home mortgage lending
operations in the Boston area during the postwar period. The material
in the study is presented in 8 parts and
15
chapters, the first of
which is this introductory discussion. In Parts II and III the major
demand and supply forces underlying home mortgage lending are analyzed,
first
on a quasi-theoretical plane, and then with specific reference
to the Boston market. Part IV summarizes some characteristic weaknesses
in the pre-depression mortgage market, followed by a description of
the principal methods by which the government has attempted to eliminate
or largely overcome these weaknesses. Part V-
presents specific data on
mortgage operations of local lending institutions, as well as an analysis
of relative contract terms and lending practices. The utilization of
the FHA and VA home loan programs is analyzed in Part VI, including the
primary reasons accounting for the low
seald
of insured lending on the
local level.- The development of an effective secondary mortgage market
is considered in Part VII, with special emphasis given to the
contri-bution of insured and guaranteed loans in this development. The
con-cluding Part VIII analyzes the soundness of the existing mortgage struc-ture as well as the influence of federal interventionary efforts uponthe competitive structure of the local market.
PART II. DEMAND FORCES: THE MORTGAGOR
CHAPTER 2. SOME THEEORETICAL CONSIDERATIONS
The demand for home mortgage credit is closely related to the demand for real.housing assets. Unless the refinance of an existing obligation is involved, mortgage credit is sought primarily in con-nection with the purchase of a new or standing house. The demand for
mortgage credit is commonly referred to as being "derived" from the
outside housing market. In view of the indispensability of appropriate financing in most home purchases, however, a "joint" demand relation-ship may be a bit more realistic.1 Because of the interdependence
be-tween the mortgage and real estate markets, this chapter will consider some of the principal forces underlying the demand for housing assets before analyzing mortgage demand directly.
THE HOUSING MARKET
Fundamentally, the demand for mortgage credit as well as for housing assets largely depends upon the demand for and supply of real housing services. These housing services constitute an essential item in every family budget, although the precise services sought by a particular
household must be determined in the Walrasian general equilibrium system, given-incomes, tastes, technology, etc. The composite demand for these
1For the implications of this observation, see "Mortgage Demands of
services is translated into dollar rentals, and interacts with the existing supply in determining the market rental structure. For our immediate purposes, the distribution of the ownership of housing assets is unimportant, as all family units are treated as if they were tenants. If an individual were an owner-occupant, his behavior as a consumer of housing services is analytically distinct from that as an investor in this particular form of asset.
The "supply of housing services" of course refers to the utiliza-tion of housing inventory, whether it be newly-constructed or older
property. In theory, the present value of this stock is found by
ap-plying the relevant discount factor to anticipated future net revenues.1 As .a result of competition among buyers and sellers of housing assets, market price tends to gravitate toward this value. These capitalized values thence tend to rise and fall with fluctuations in dollar rentals. The latter, in turn, depend on shifts in the demand and/or supply sche-dules for housing services. Hence, real estate valuations, in theory at least,, are a function of the forces determining the basic demand for and supply of housing services.
This observation is not at all surprising, for the same elementary principles apply equally well to pricing in all commodity markets. Nevertheless, the extreme durability of housing inventories gives rise
The determination of the "appropriate" discount factor is a subject for analytical study, whether it relates to lending rates, borrowing rates, short or long rates, or some other economic variable. See the
to certain distinguishing market characteristics. Real estate markets are largely dominated by the behavior of a vast standing stock, and
annual additions or diminutions to this inventory appear relatively insignificant. This observation is easily verified by considering the ratio of annual nonfarm housing starts to existing stocks. Even in 1950, when an all-time high of
1.4
million units were started in the nation,new construction represented but 3.5 per cent of the standing inventory of 39.4 million dwelling units.1
Not only is the total stock of housing relatively inflexible in
number but it is also fixed as to location. Automobiles, furniture and other consumer durables are relatively mobile as families move about, while a house can be moved only at great expense, if at all.
Prefab-ricated housing has facilitated a more responsive adjustment of production 2
to changes in location of demand concentration,, but under existing
1
Compare data on housing starts presented in Chart I with the total stock of 29.7 million units in 1940 and 39.4 million in 1950. The durability of housing assets is demonstrated by the following age distribution of over 28 million urban dwelling units, as of 1950: Year Built Per cent of Drelling Units Reporting
All years 100.0% 1945 or later 11.8 1940 to 1944 7.7 1930 to 1939 11.8 1920 to 1929 22.2 1919 or earlier 46.4
Source: Bureau of the Census, presented in Economic Almanac 1951-1952, National Industrial Conference Board, p. 410.
2
Some folding houses are designed to permit repeated moving even after the unit has once been assembled, e.g., Acorn Houses.
technology, factory-built homes have enjoyed only limited public acceptance.
As a result of this extreme stock-flow relationship, supply
schedules of housing services change but slowly over a period of time.
As a consequence, dollar rentals in a free market are largely demand determined, and may display erratic behavior at times. In the very
short run, the physical stock of housing is absolutely fixed and the only adjustment in market offering to various prices involves doubling-up
or vacancies among the standing units.
The Rate of Utilization of Housing Facilities
In a theoretical equilibrium situation, the existing stock of housing facilities would be used to best advantage, with rents and home prices tending to remain unchanged. Under such circumstances, the
"rate of utilization" of the standing stock -would be at an optimal level, and instances of involuntary doubling-up or property vacancy
would be only transitory and of minor significance in the aggregate. On the other hand, it is entirely probable that a certain amount of
doubling-up would persist even under equilibrium conditions, for some members of the economy may be unable or ill-advised to seek their owri
2 housing accommodations for long periods of time.
'The concept "rate of utilization," which might be defined as the degree to which the existing stock of housing is being occupied or used up, was used by Professor Ernest Fisher in an address before the 1951 Convention of Massachusetts Savings Bankers. Reprinted in U.S. Investor, September 29, 1951, pp. 1861-4.
2
1f general equilibrium were obtained throughout the economy, relative prices would be established so as to stimulate sufficient new
construc-tion to offset the real depreciaconstruc-tion of the hitherto standing stock. In a growth economy, because of pressures of population growth, rising incomes, etc., new construction would exceed this depreciation; and
If the supply of housing services were to become excessive relative
to the equilibrium level (or alternatively if the demand were to become
ddficient), the "rate of utilization" of existing facilities would fall
below the theoretical optimal level. In this event, vacancies would mount and dollar rentals as well as current market valuations on housing as-sets would display a downward tendency. Such an"unemployment"situa-tion may persist for long periods of time, as the housing stock
has a
long average life and is seldom diminished by an appreciable extent during any one year. Natural catastrophes, such as fires, floods, and storms, destroy some units, while others are intentionally demolished in connection with changes in land use or urban redevelopment. During the decade of the twenties, however, the total number of dwelling units withdrawn from use for all reasons probably represented less than 102 per cent of the number of new units put in place.
In the past, the economy seldom had to wait upon full physical depreciation of standing stock before the rate of utilization would
rise again. Ordinarily rising incomes and population pressures would
induce a secular increase in overall demand for housing services.
This outward shift in demand would intersect the relatively stationary1By 1940, the net vacancy ratio in the U. S. had declined to
4.8
percent, and by 1950, only 1.77 per cent of all nonfarm dwelling units were involuntarily vacant. The corresponding ratios for Massachusetts
and Metropolitan Boston in 1950 were 2.4 and 2.0 per 'cent, respectively.
1950 Census of Housing, Preliminary Reports, Series, HC-1, No. 28.
2
L. J. Chawner, "Economic Factors Related to Residential Building," The Annals of the American Academy of Political and Social Science, March 1937, pp. 27-2b.
supply schedule at a higher price and at a point of more complete utilization of the standing stock. Hence, dollar rentals would once
again rise to the equilibrium level, and asset valuations would begin to turn up.
If, on the other hand, the demand for housing services were to be-come excessive relative to the equilibrium level (or if supply were to become deficient), the rate of utilization would rise above the
theore-tical optimum level. Under such circumstances, rentals would mount
significantly, a "housing shortage" would develop,
and doubling-up
would become widespread in the areas concerned.
Once again, a
dis-equilibrium situation may prevail for several years, despite the fact
that new production would take place as soon as rental prospectsl risesufficiently to push capitalized values of housing assets above current
costs of construction.
As has been true of the postwar housing boom,
builders continue to put up new dwelling units as long as anticipated
market conditions permit their sale at a profit. This situation obtains
notwithstanding the restraints of Regulation X and other governmental
2
credit regulations. Construction activity is not confined to new dwelling units alone, for during such boom periods existing properties undergo extensive repair, modernization and conversion.
Although new construction is undertaken and maintained only so
long as anticipated market valuations exceed total production costs,
the latter hardly functions as an upper limit to
the former. As data
It is to be remembered that rentals in this connection refer to
compensation for housing services, whether the
occupants are
tenants
or owners.2
If direct controls over prices, wages, materials allocations, etc.,
were assumed, this statement would require modification.
on new construction indicate, construction activity even in peak years adds but a small amount to the aggregate housing inventory. Hence, it may take several years before the rate of utilization and dollar rentals fall sufficiently so that selling prices drop to a level approximating
current costs of production. The fact that market valuations may exceed production costs for long periods of time reflects not only the length of the planning and construction period, but also imperfect knowledge, financing difficulties, heavy risk, etc. Furthermore, the return to equilibrium may be indefinitely extended if active building operations are accompanied by outward demand shifts, which in turn tend to increase the rate of utilization. This type of inflationary race has charac-terized much of the postwar housing boom. As late as 1950, nearly 2 million families across the nation were still doubled up, despite an unprecedented volume of new home building. Indeed, only after market valuations drop below the level of current costs of construction mould new production be curtailed or eliminated.
It is precisely this derivative nature of new construction, as well as its undisciplined, localized operations, that subjects the
industry to such a feast and famine existence. The severity of the
Sample surveys of doubling-up have revealed these statistics for selected years:
Date Estimated Number of Families
Doubled Up (C06)
April 1, 1940
1,846
April 15, 1947 2,712
April 15, 1949 2,0o
March 15, 1950 (preliminary) 1, 880
Source: Savings Bank Trust Company, Mortgage Statistics Bulletin,
swings in private home construction is vividly illustrated by Chart I on private home building in the country. Costs of production perform
the same function in housing just as in all other commodity markets. In the case of most consumer items, however, market price fluctuates
quite closely about reproduction costs. Inventories undergo fairly
rapid turnover as consumers purchase these non-durables frequently,
and consumption accordingly follows production and distribution very closely.
In the construction industry, however, a relative surplus of standing inventories distributed throughout the economy may render new production unprofitable for long periods of time. Construction costs tend to remain fairly stable in the short run, while capitalized values fluctuate widely, as a result of shifts in prospective net rentals or in the rate of discount applied to these revenues. In de-pressed periods, costs seldom decline as rapidly as do real estate values, and similarly cost advances rarely keep pace with boom price
movements. Indeed, current wage rates and material costs are deter-mined by forces operating without as well as within the home building industry, and hence tend to follow overall economic developments rather
2
than home construction activity alone. As new construction is revived
Or within certain regions.
2The rigidity of wage rates is also heavily influenced by labor union
Chart I. NUMBER OF PRIVATE NEW PERMANENT NONFARM IYELLING UNITS STARTED ANNUALT1 IN THE UNITED STATES, 1920-1951
1
2_:
_ __ - _/2-
___ ___ - __ - _ _ - _F,/q2J-
/13qk
Source: National Industrial Conference Board, Road Map of Industry,
following a period of inactivity, factor resources are initially absorbed from unemployed pools at existing prices. But as operations expand, these factors of production must be bid away from alternate uses by offering higher factor prices. Hence in the later stages of a boom, costs of construction gradually approach and in practice may surpass capitalized values of housing assets.
There is undoubtedly a considerable lag between the point of
stimulus and the time when newly-constructed units are available for
occupancy. This period of gestation has frequently been analyzed by students to determine its role in aggravating economic fluctuations.
Inadequate market knowledge coupled with other imperfections may give rise to overinvestment and an ensuing painful period of readjustment. A careful examination of cyclical behavior in the housing industry
cannot be included in this study, but several empirical investigations have been conducted in this field.
Anticipating Price Changes
Professor Ernest Fisher has formulated a series of tables demon-strating the influence of anticipated price changes on current market valuations.2 If an individual home buyer expected real estate prices
to remain constant for several years, he would feel justified in
lSee W. H. Newman, The Building Industry and Building Cycles, University
of Chicago Press, 1939; C. I). Long, Building Cycles and the Theory of Investment, Princeton University Press, 1940; J. R. RiggTlean, "Build-ing Cycles in the United States," 1875-1932, Journal of the American
Statistical Association, June 1933; and others.
2E. M. Fisher, Urban Real Estate Markets and Their Financing Needs,
0k. cit., Chapter I.
paying no more than the prevailing price. If he believed a subsequent resale of the property would bring in a sizeable capital gain he may be willing to pay a little more. If he believed market price would advance
at a rate of
5
per cent per year for5
successive years and then remain steady, a house costing $10,000 could be sold for $12,760 at the end of the 5-year period. If this inflationary expectation were shared by buyer and seller alike, the prospective capital gain would bere-flected in the current price. Assuming a
4
per cent discount rate, theprice would approach $12,271, the exact amount depending upon the rela-tive bargaining strength of the two parties as well as the firmness of their convictions. Largely because of an acute lack of knowledge in the real estate market, this process tends to accelerate rates of price
change, whether in expanding or declining periods. Once such a price rise is underway, buyers and sellers may alter their convictions in the direction of a more rapid or of a more enduring inflationary spiral.
Although he may not always calculate the precise discounted value
of these prospective increments, the actual home buyer certainly con-siders resale value as a vital factor in arriving at a maximum offering
One of two tables presented in Fisher's study will be reproduced in
part here, from which the above example has been drawn:
Index of Price in Period Index of Pres Period N (Assuming 5% Rise per Period) Price (where disco
0
100.0
100.00
105.00 lo4.81 2 110.25 109.483
115.76114.0l
4
121.55 118.42 5 127.63 122-71Source: Ibid. The index is found directly by this formula:
.2.=
/If
[f/
o
"/,
where
r expected rate of change in price, and i= rate of discount.
ent