Publisher’s version / Version de l'éditeur:
BMC Systems Biology, 8, 1, pp. 1-12, 2014-09-14
READ THESE TERMS AND CONDITIONS CAREFULLY BEFORE USING THIS WEBSITE. https://nrc-publications.canada.ca/eng/copyright
Vous avez des questions? Nous pouvons vous aider. Pour communiquer directement avec un auteur, consultez la première page de la revue dans laquelle son article a été publié afin de trouver ses coordonnées. Si vous n’arrivez pas à les repérer, communiquez avec nous à PublicationsArchive-ArchivesPublications@nrc-cnrc.gc.ca.
Questions? Contact the NRC Publications Archive team at
PublicationsArchive-ArchivesPublications@nrc-cnrc.gc.ca. If you wish to email the authors directly, please see the first page of the publication for their contact information.
This publication could be one of several versions: author’s original, accepted manuscript or the publisher’s version. / La version de cette publication peut être l’une des suivantes : la version prépublication de l’auteur, la version acceptée du manuscrit ou la version de l’éditeur.
For the publisher’s version, please access the DOI link below./ Pour consulter la version de l’éditeur, utilisez le lien DOI ci-dessous.
https://doi.org/10.1186/s12918-014-0109-z
Access and use of this website and the material on it are subject to the Terms and Conditions set forth at
13C metabolic flux analysis shows that resistin impairs the metabolic
response to insulin in L6E9 myotubes
Guzmán, Shirley; Marin, Silvia; Miranda, Anibal; Selivanov, Vitaly A.;
Centelles, Josep J.; Harmancey, Romain; Smih, Fatima; Turkieh, Annie;
Durocher, Yves; Zorzano, Antonio; Rouet, Philippe; Cascante, Marta
https://publications-cnrc.canada.ca/fra/droits
L’accès à ce site Web et l’utilisation de son contenu sont assujettis aux conditions présentées dans le site LISEZ CES CONDITIONS ATTENTIVEMENT AVANT D’UTILISER CE SITE WEB.
NRC Publications Record / Notice d'Archives des publications de CNRC:
https://nrc-publications.canada.ca/eng/view/object/?id=5ed7c525-8610-4de2-98b8-b6fcc8e143d3 https://publications-cnrc.canada.ca/fra/voir/objet/?id=5ed7c525-8610-4de2-98b8-b6fcc8e143d3R E S E A R C H A R T I C L E
Open Access
13
C metabolic flux analysis shows that resistin
impairs the metabolic response to insulin in
L6E9 myotubes
Shirley Guzmán
1,2†, Silvia Marin
1,2†, Anibal Miranda
1,2, Vitaly A Selivanov
1,2, Josep J Centelles
1,2,
Romain Harmancey
3,4, Fatima Smih
3,4, Annie Turkieh
3,4, Yves Durocher
5, Antonio Zorzano
1,6, Philippe Rouet
3,4and Marta Cascante
1,2*Abstract
Background: It has been suggested that the adipokine resistin links obesity and insulin resistance, although how resistin acts on muscle metabolism is controversial. We aimed to quantitatively analyse the effects of resistin on the glucose metabolic flux profile and on insulin response in L6E9 myotubes at the metabolic level using a tracer-based metabolomic approach and our in-house developed software, Isodyn.
Results: Resistin significantly increased glucose uptake and glycolysis, altering pyruvate utilisation by the cell. In the presence of resistin, insulin only slightly increased glucose uptake and glycolysis, and did not alter the flux profile around pyruvate induced by resistin. Resistin prevented the increase in gene expression in pyruvate
dehydrogenase-E1 and the sharp decrease in gene expression in cytosolic phosphoenolpyruvate carboxykinase-1 induced by insulin.
Conclusions: These data suggest that resistin impairs the metabolic activation of insulin. This impairment cannot be explained by the activity of a single enzyme, but instead due to reorganisation of the whole metabolic flux distribution.
Keywords: Resistin, Insulin resistance, Glucose metabolism, Fluxomics, Bioinformatics, Tracer-based metabolomics Background
Obesity is increasing to epidemic proportions [1,2], starting from young ages [3,4], and is associated with an increase in the prevalence of type-2 diabetes mellitus (T2DM) throughout the world [2,5]. In recent years, active participation of immune cells in obesity and T2DM has become evident [6,7]. This chronic activation of the innate immune system can lead to insulin resistance (IR), im-paired tolerance to glucose and, eventually, T2DM [8,9].
Adipose tissue produces a vast array of adipocyte-derived factors (“adipokines”) that regulate the metabol-ism, inflammation and body mass [10,11]. One of these
adipokines, resistin, belongs to a family of cysteine-rich proteins shown to be involved in inflammation and al-tered insulin sensitivity in rodents [12,13]. Resistin is produced from adipose tissue in rodents whereas, in humans, it is secreted by the mononuclear lymphocytes and stromal cells within adipose tissue [14,15]. Studies in humanised resistin mice suggest that, even though the site of resistin production differs between species, hu-man resistin exacerbates inflammation in white adipose tissue and contributes to IR, thereby impairing its nor-mal effects [16,17].
IR is defined as the genetic or learned inability of tar-get tissues to respond normally to the action of circulat-ing hormones. It has been described in skeletal muscle but also in liver and adipose tissues [18]. Some studies have shown that resistin affects glucose transport and insulin-stimulated oxidation of glucose in L6 skeletal muscle cells [19-22]. It also decreases the uptake and
* Correspondence:martacascante@ub.edu
†
Equal contributors
1
Department of Biochemistry and Molecular Biology, Faculty of Biology, Universitat de Barcelona, Av Diagonal 643, 08028 Barcelona, Spain
2Institute of Biomedicine of Universitat de Barcelona (IBUB) and
CSIC-Associated Unit, Barcelona, Spain
Full list of author information is available at the end of the article
© 2014 Guzmán et al.; licensee BioMed Central Ltd. This is an Open Access article distributed under the terms of the Creative Commons Attribution License (http://creativecommons.org/licenses/by/4.0), which permits unrestricted use, distribution, and reproduction in any medium, provided the original work is properly credited. The Creative Commons Public Domain Dedication waiver (http://creativecommons.org/publicdomain/zero/1.0/) applies to the data made available in this article, unless otherwise stated.
oxidation of long-chain fatty acids [23] and glycogen synthase kinase-3-β, as well as insulin-stimulated insulin receptor substrate-1 (IRS-1) tyrosine phosphorylation [19,22] in the same cell line. Furthermore, high levels of resistin in rats leads to IR involving impaired insulin sig-nalling in skeletal muscle, liver and adipose tissues, resulting in glucose intolerance, hyperinsulinemia and hypertriglyceridemia [24]. These observations link resis-tin in muscle-cell metabolism to IR.
Changes in the metabolome (i.e., the whole set of me-tabolites) have been described as the “ultimate” response of an organism to various events, such as genetic alter-ations as well as disease-based or environmental influ-ences [25]. However, the metabolome is dynamic and metabolites are transformed continuously in the cell. Comprehensive characterisation of the metabolic net-works and their functional states requires quantitative knowledge of intracellular metabolic fluxes. These intra-cellular fluxes can be quantified by analysing incorpor-ation of labelled substrates in metabolic products using appropriate bioinformatic tools [26].
Skeletal muscle is considered to be the main tissue in-volved in the maintenance of glucose homeostasis because its contribution to glucose uptake is ≈ 75% of the total contribution of peripheral tissues [27], and it is the main tissue responsible for insulin-dependent glucose use. Also, pyruvate homeostasis-related fluxes in skeletal muscle play a critical part in glucose homeostasis [28-32]. A better un-derstanding of how these fluxes work together in muscle cells is needed to understand this process.
The aim of the present study was to examine the effect of resistin on the central carbon metabolic network of rat skeletal muscle cells, and to ascertain how resistin alters the response of muscle cells to insulin at the metabolic level. We used [1,2-13C2]-glucose as a tracer, analysed iso-topomer distributions by gas cromatography (GC) coupled with mass spectrometry (MS), and quantified metabolic fluxes using Isodyn software [26,33-36]. In the model of the glucose metabolic network in skeletal muscle we in-cluded the glycolytic pathway and pentose phosphate pathway (PPP). Pyruvate dehydrogenase complex (PDC)-, phosphoenolpyruvate carboxykinase (PEPCK)- and pyruvate carboxylase (PC)-catalysed reactions were also included to account for pyruvate homeostasis-related fluxes. Resistin-induced alterations in the profile of metabolic fluxes of rat skeletal muscle cells were identi-fied, and were complemented by analyses of the expres-sion of certain genes.
The study presented here offers a wider vision than pre-viously published of the metabolic reorganisation that resistin induces in rat skeletal muscle cells and in the metabolic response of these cells to insulin. Our observa-tions provide new data for a more precise understanding of the effect of resistin on metabolic-network adaptations
of skeletal muscle cells, and help to explain the role of resistin in the IR described in myocytes. Our work reveals the importance of tackling the study of complex biological systems from a systems-biology point of view to fully understand multifactorial diseases and identify new thera-peutic targets.
Results
For analyses of the effect of resistin on glucose metabol-ism and on the metabolic response of muscle cells to in-sulin, L6E9 myotubes were pretreated for 8 h with or without resistin (100 nM). After preincubation, myo-tubes were incubated for a further 6 h with glucose (10 mM) that was 50% enriched in [1,2-13C2]-glucose in the absence or presence of 100 nM insulin and in the continued presence or absence of resistin.
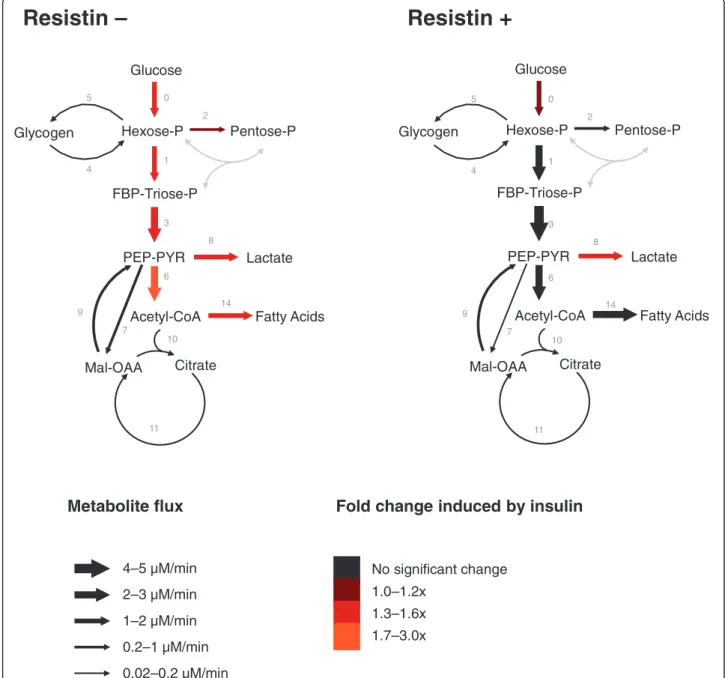
After 6 h of incubation, glucose consumption, lactate production, intracellular levels of glycogen and glucose-6-phosphate (G6P) were determined (Table 1), as were the mass-isotopomer distributions in glucose and lactate from the incubation medium, as well as glycogen glucose and ribose isolated from RNA in cell pellets (Table 2). Analyses of the obtained data by Isodyn determined the distribution of the metabolic flux profile of L6E9 myo-tubes under various incubation conditions (Table 3). Figure 1 summarises the qualitative changes in metabo-lites and fluxes.
Basal metabolic flux profile of L6E9
Isodyn quantified the metabolic-flux distribution in L6E9 myotubes incubated in the presence of glucose (10 mM) and in the absence of insulin or resistin (Table 3, first column). Under this incubation condition, cells had a glucose phosphorylation of 1.500 nmol · mL–1· min–1. This flux was maintained throughout the subse-quent steps of “upper glycolysis” (of which flux-1 is repre-sentative) until the split of fructose-1,6-bisphosphate into two triose-phosphates by aldolase. From this reaction on-wards, the glycolytic flux (hereafter referred to as “lower glycolysis”) increased twofold (as shown in flux-3). Add-itionally, the flux across the oxidative branch of the PPP was around eight-times lower than the upper glycolytic flux. With regard to glycogen metabolism, glycogen phos-phorylase (GP) (flux-4) and glycogen synthase (GS) (flux-5) were active, and glycogen recycling was estimated to be ≈ 2% of the total glucose phosphorylation flux.
However, the most important contribution of Isodyn for interpretation of experimental data was the possibil-ity of flux quantification around the final steps of lower glycolysis and the tricarboxylic acid (TCA) cycle. In that regard, Isodyn revealed that ≈ 49% of phosphoenolpyr-uvate (PEP) and pyrphosphoenolpyr-uvate entered the TCA cycle through the reactions catalysed by PDC (flux-6) or PC (flux-7), with a relative PDC:PC ratio of 8:1. Around 44% of the
PEP–pyruvate flux was diverted to the synthesis and out-put of lactate towards the cell culture medium (flux-8), and pyruvate cycling flux (flux 9). This finding accounted for the fact that feedback of molecules from the TCA cycle back towards the PEP–pyruvate pool was around ten-times higher than the flux of the TCA cycle towards cit-rate synthesis (flux-10).
Effect of resistin on the metabolic flux profile of L6E9 L6E9 myotubes treated with 100 nM resistin showed 13% higher flux of glucose phosphorylation (1.700 nmol · mL–1· min–1). Fitting of the experimental data from this incuba-tion condiincuba-tion using Isodyn (Table 3, second column) sug-gested that resistin increased the glycolytic flux, with a significant increase in the glucose phosphorylation flux, and a proportional increase of glycolytic fluxes. Resistin induced changes in the non-oxidative branch of the PPP (data not shown), but the relative flux through the oxidative branch (flux-2) was unchanged. Glycogen recycling-related fluxes (fluxes 4 and 5) remained unchanged, as indicated by the fact that the net 13C incorporation in glycogen was very similar to the control condition.
Moreover, resistin increased lactate production (Table 1), which translated to an increase in the lactate dehydrogen-ase flux (flux-8), though it was not significant. The most significant metabolic change after Isodyn fitting was ob-served in the PDC-related flux (flux-6), which was in-creased significantly (99% confidence). If we consider the relative ratios of the two main pyruvate incorporation fluxes (PDC and PC, fluxes 6 and 7, respectively), there was an increase of the PDC prevalence to 20:1. This find-ing was also supported by the level of pyruvate dehydro-genase kinase isozyme 4 (Pdk4) mRNA (Figure 2E), and was observed as a trend in the level of pyruvate dehydro-genase Pdha1 mRNA (Figure 2C). Despite the large change in this ratio, the effect on fluxes in the TCA cycle was almost negligible even though there was an increase in the acetyl-CoA output flux (flux-14). The pyruvate cyc-ling flux was unchanged by resistin treatment alone, which was supported by the level of Pepck mRNA (Figure 2H). Effect of resistin on the metabolic response of insulin in L6E9 myotubes
Having investigated the alterations caused by resistin on the metabolic profile of L6E9 myotubes, we examined its effect on the metabolic response of myotubes to insulin.
First we ascertained if resistin affected stimulation of insulin-induced glucose transport. Thus, induction of 2-Table 1 Biochemical parameters in L6E9 myotubes after different incubations with resistin and/or insulin
Incubation condition
Ins- Ins+
Res- Res+ Res- Res+
Glucose consumption (mM) 0.50 ± 0.04 0.61 ± 0.06* 0.78 ± 0.03** 0.70 ± 0.09 Lactate production (mM) 0.48 ± 0.01 0.56 ± 0.02** 0.75 ± 0.06** 0.79 ± 0.02†
Glycogen (μg glucose/mg prot) 9.88 ± 1.99 9.97 ± 0.98 11.34 ± 0.59 11.62 ± 1.21 Glucose-6-phosphate (nmol/mg prot) 0.92 ± 0.14 1.44 ± 0.28 2.30 ± 0.29** 2.10 ± 0.19†
L6E9 myotubes were treated (Res+) or not treated (Res–) with 100 nM resistin for 8 h and then incubated for 6 h in the absence (Ins–) or presence (Ins+) of 100 nM insulin. Glucose consumption, lactate production, and intracellular contents of glycogen and glucose-6-phosphate were determined as described in the
Methodssection. Results are the mean ± standard deviation (n = 3). Units of glucose consumption and lactate production refer to the volume of the incubation medium. (*) indicates p < 0.05 and (**) p < 0.01 compared with the condition of neither resistin nor insulin. (†) indicates p < 0.05 compared with the L6E9 myotubes treated only with resistin.
Table 2 Mass isotopomer distribution of lactate, glycogen and ribose after incubations with resistin and/or insulin
Mass isotopomer distributions (%) Incubation condition
Ins- Ins+
Res- Res+ Res- Res+ Lactate m0 88.56 ± 0.98 88.74 ± 0.25 87.68 ± 0.22 87.63 ± 0.17 m1 0.70 ± 0.34 0.48 ± 0.11 0.63 ± 0.06 0.52 ± 0.14 m2 10.53 ± 0.30 10.85 ± 0.15 11.69 ± 0.05* 11.78 ± 0.11 m3 0.21 ± 0.63 0.07 ± 0.18 0.00 ± 0.11 0.07 ± 0.13 Glycogen m0 67.28 ± 0.65 69.20 ± 1.41 65.14 ± 1.08 64.48 ± 0.45 m1 0.29 ± 0.03 0.36 ± 0.14 0.96 ± 0.10 0.84 ± 0.10 m2 31.78 ± 0.74 29.91 ± 1.02 33.20 ± 1.18 33.78 ± 0.76 m3 0.53 ± 0.19 0.43 ± 0.28 0.43 ± 0.07 0.60 ± 0.20 m4 0.00 ± 0.02 0.00 ± 0.06 0.17 ± 0.05 0.15 ± 0.02 Ribose m0 96.13 ± 0.55 94.28 ± 0.76 94.47 ± 0.48 92.83 ± 1.18 m1 1.34 ± 0.23 1.45 ± 0.11 2.56 ± 0.14 2.97 ± 0.15 m2 0.68 ± 0.19 1.14 ± 0.16* 1.18 ± 0.09* 1.40 ± 0.23 m3 1.17 ± 0.63 1.56 ± 0.58 0.87 ± 0.17 1.14 ± 0.32 m4 0.50 ± 0.44 1.17 ± 0.22* 0.61 ± 0.14 1.17 ± 0.41
L6E9 myotubes were treated (Res+) or not treated (Res–) with 100 nM resistin for 8 h and then incubated for 6 h with 10 mM glucose, 50%-enriched in [1,2-13C
2]-glucose in the absence (Ins–) or presence (Ins+) of 100 nM insulin.
Mass isotopomer distributions at the end of incubations were determined, as described in theMethodssection. Results are the mean ± standard deviation (n = 3). (*) indicates p < 0.05 compared with the condition of neither resistin nor insulin.
deoxy-D-[2,6-3H]-glucose (2-DG) transport was assayed 30 min after incubation with 100 nM insulin in L6E9 myotubes treated or not treated with 100 nM resistin. Insulin induced an increase in 2-DG transport in L6E9 myotubes of 79.27 ± 0.04%. However, it induced an in-crease in glucose transport in cells that had been pre-treated with 100 nM resistin for 8 h of 48.00 ± 0.05%. Subsequently, we analysed changes in the metabolic flux profile induced by insulin in L6E9 myotubes treated or not treated with 100 nM resistin.
In the absence of resistin, insulin stimulated an increase in glucose consumption and lactate production in L6E9 myotubes. There were no changes in glycogen content, but a 150% increase in intracellular G6P content (Table 1). Fitting of experimental data using Isodyn (Table 3, third column) revealed that the flux of lactate production (flux-8) was 48% higher than that in cells not treated with insulin. Insulin also increased the flux of glucose phosphorylation (determined to be 2.300 nmol · mL–1· min–1) and glycolytic
fluxes (fluxes 1 and 3) by ≈ 59%, and induced a 25% increase in the oxidative PPP flux (flux-2). Moreover, fluxes related to glycogen metabolism (fluxes 4 and 5) did not change significantly after insulin treatment (albeit the me-dian values were apparently higher than in the control con-dition). Insulin increased the flux through PDC (flux-6) by around 1.5-fold, but did not affect the remainder of TCA cycle-related fluxes significantly, as confirmed by the reduction in levels of Pdk4 mRNA and the increasing ten-dency of levels of Pdha1 mRNA (Figure 2E and C, respect-ively). The relative ratio of PDC:PC fluxes increased from 8:1 to 13:1 after insulin treatment. Insulin also led to a 59% increase in the acetyl-CoA output fluxes.
In the presence of resistin, insulin increased the flux of glucose phosphorylation by 16% more than when cells were treated with resistin alone. Glycolysis fluxes did not increase significantly compared with the resistin condition, but the lactate dehydrogenase flux increased by 45% (flux-8). The increase induced by resistin treatment in the oxidative PPP Table 3 Metabolic fluxes adjusted by Isodyn for different incubation conditions
Metabolic fluxes (nmol · mL-1· min-1) Incubation condition
Ins – Ins +
Flux num Flux reaction Res – Res + Res – Res +
Median [min–max] Median [min–max] Median [min–max] Median [min–max] 0 Glucose phosphorylation 1.500 [1.500–1.500] 1.700** [1.700–1.700] 2.300** [2.300–2.300] 1.975††
[1.975–1.975] Glycolytic and PPP fluxes:
1 Phosphofructokinase 1.674 [1.442–3.004] 2.018 [1.679–2.586] 2.664* [2.537–2.670] 1.907 [1.874–1.919] 2 Oxidative branch of PPP 0.199 [0.196–0.199] 0.200 [0.198–0.200] 0.248** [0.246–0.298] 0.198 [0.192–0.199] 3 Pyruvate kinase 3.078 [3.026–3.262] 3.582 [2.644–4.126] 4.671** [4.573–4.873] 4.337 [4.087–4.468] Glycogen-related fluxes: 4 Glycogen phosphorylase 0.038 [0.034–0.052] 0.034 [0.024–0.066] 0.043 [0.037–0.046] 0.032 [0.029–0.035] 5 Glycogen synthase 0.040 [0.036–0.053] 0.035 [0.024–0.067] 0.050 [0.043–0.058] 0.038 [0.034–0.040] Pyruvate homeostasis-related fluxes:
6 Pyruvate dehydrogenase complex 1.511 [1.421–1.843] 2.354** [2.118–2.363] 2.479* [1.785–2.987] 2.125 [1.575–2.494] 7 Pyruvate carboxylase 0.200 [0.113–0.291] 0.117 [0.027–0.201] 0.197 [0.155–0.254] 0.031 [0.028–0.055] 8 Lactate dehydrogenase 1.366 [1.292–1.451] 1.511 [1.446–1.654] 2.033** [1.620–2.738] 2.192††
[1.722–2.739] 9 Pyruvate cycling 0.228 [0.200–0.377] 0.474 [0.222–0.884] 0.296 [0.264–0.389] 0.538 [0.303–0.594] Tricarboxylic acid cycle fluxes:
10 Citrate synthase 0.022 [0.019–0.386] 0.012 [0.001–0.023] 0.099 [0.022–0.172] 0.009 [0.002–0.037] 11 Citrate - > Malate 0.035 [0.032–0.462] 0.072 [0.050–0.400] 0.185 [0.110–0.298] 0.370 [0.082–0.395] 12 Malate - > OAA 0.640 [0.481–2.088] 1.152 [0.453–3.104] 1.509 [0.780–2.413] 2.078 [0.477–3.095] 13 OAA - > Malate 0.605 [0.446–1.776] 1.080 [0.294–2.800] 1.324 [0.668–2.115] 1.708 [0.336–2.773] 14 Acetyl-CoA output 1.489 [1.313–1.625] 2.344** [2.114–2.355] 2.380** [1.760–2.851] 2.116 [1.565–2.485]
Principal fluxes of central carbon metabolism calculated in L6E9 myotubes treated (+Res) or not treated (–Res) with 100 nM resistin for 8 h and then incubated for 6 h with 10 mM glucose, 50%-enriched in [1,2-13C
2]-glucose in the absence (–Ins) or presence (+Ins) of 100 nM insulin. Glucose phosphorylation flux was fixed
according to the glucose consumption measured (Table1). Remaining fluxes are expressed by median values as well as minimum and maximum values from the 20 best flux sets. Fluxes are expressed in nmol · mL–1· min–1, where volume is the volume of the incubation medium. χ2values for the averages were: Ins– Res–: 11.35; Ins– Res+: 5.42; Ins + Res–: 22.50; Ins + Res+: 25.56. (**) indicates that the flux is different to the control condition with a 99% confidence interval (CI), (*) indicates that the flux is different to the control condition with a 95% CI, and (††) indicates that the flux differs from the condition in which cells were treated only with resistin with a 99% CI. PPP, pentose phosphate pathway; OAA, oxaloacetate.
pathway was not significantly altered if cells were also treated with insulin. Similarly, the GS and GP fluxes did not change significantly after resistin treatment.
Interestingly, there was no change in the PDC flux (flux-6) or the acetyl-CoA production flux (flux-14), and no change was observed in the remainder of TCA cycle-related fluxes. If the ratio between PDC and PC fluxes is taken into account, it shifted from 20:1 towards 70:1 after
resistin was combined with insulin. The final metabolic state of insulin-stimulated L6E9 did not match the one of cells treated with resistin. Some fluxes were equal in resistin-treated and -untreated cells: oxidative PPP flux, GS flux, GP flux, and TCA cycle-related fluxes. Most of the quantified fluxes were lower in resistin, but significant changes were found only in the lactate dehydrogenase flux, and the PDC:PC ratio.
No significant change 1.0–1.2x 1.3–1.6x 1.7–3.0x 4–5 µM/min 2–3 µM/min 1–2 µM/min 0.2–1 µM/min 0.02–0.2 µM/min
Fold change induced by insulin
Metabolite flux
Glucose Hexose-P FBP-Triose-P PEP-PYR Glycogen Pentose-P Fatty Acids Citrate Lactate Acetyl-CoA Mal-OAAResistin –
0 2 5 4 1 3 6 8 10 11 7 9 14Resistin +
Glucose Hexose-P FBP-Triose-P PEP-PYR Glycogen Pentose-P Fatty Acids Citrate Lactate Acetyl-CoA Mal-OAA 0 2 5 4 1 3 6 8 10 11 7 9 14Figure 1 Metabolic fluxes in L6E9 myotubes not treated and treated with resistin and/or insulin. L6E9 myotubes were treated (resistin+) or not treated (resistin–) with 100 nM resistin for 8 h and then incubated for 6 h with 10 mM glucose, 50%-enriched in [1,2-13C
2]-D-glucose in the
absence or in the presence of 100 nM insulin. Fluxes were estimated using the software Isodyn. Arrow sizes indicate net fluxes in L6E9 myotubes not treated or treated with resistin that were incubated in the absence of insulin. Colours indicate flux fold-changes in response to insulin. Fluxes plotted are the median values from the 20 best flux sets (Table 3). Grey-coloured fluxes have not been measured. FBP, fructose-1,6-bisphosphate; Hexose-P, glucose-6-phosphate and its isomers; Mal, malate; OAA, oxaloacetate; Pentose-P, ribose-5-phosphate and its isomers; PEP, phosphoenolpyruvate; PYR, pyruvate; Triose-P, glyceraldehyde-3-phosphate and dihydroxyacetone phosphate.
0 3 6 9 12 15
- Res + Res - Res + Res
P d k 4 /1 8 S ( A .U .) * ** # 0 2 4 6 8 10
- Res + Res - Res + Res
M e1/18 S ( A .U .) 0 2 4 6 8 10
- Res + Res - Res + Res
Idh1 /1 8 S ( A .U .) 0 2 4 6 8 10
- Res + Res - Res + Res
P d k 2 /1 8 S ( A .U.) ** ## 0 2 4 6 8 10
- Res + Res - Res + Res
Pd h a 1 /1 8 S ( A .U .) ** 0 15 30 45 60 75 90
- Res + Res - Res + Res
P c k 1 /1 8 S ( A .U .) * 0 5 10 15 20 25 30
- Res + Res - Res + Res
P k m 2 /1 8 S ( A .U .) 0 3 6 9 12 15 18
- Res + Res - Res + Res
P c /18S ( A. U. ) Ins- Ins+
B
A
C
D
E
F
G
H
Ins- Ins+ Ins- Ins+ Ins- Ins+ Ins- Ins+ Ins- Ins+Ins- Ins+
Ins-Ins+ 0 3 6 9 12 15
- Res + Res - Res + Res
P d k 4 /1 8 S ( A .U .) * ** # 0 2 4 6 8 10
- Res + Res - Res + Res
M e1/18 S ( A .U .) 0 2 4 6 8 10
- Res + Res - Res + Res
Idh1 /1 8 S ( A .U .) 0 2 4 6 8 10
- Res + Res - Res + Res
P d k 2 /1 8 S ( A .U.) ** ## 0 2 4 6 8 10
- Res + Res - Res + Res
Pd h a 1 /1 8 S ( A .U .) ** 0 15 30 45 60 75 90
- Res + Res - Res + Res
P c k 1 /1 8 S ( A .U .) * 0 5 10 15 20 25 30
- Res + Res - Res + Res
P k m 2 /1 8 S ( A .U .) 0 3 6 9 12 15 18
- Res + Res - Res + Res
P c /18S ( A. U. )
Ins-Ins- Ins+Ins+ Ins-Ins- Ins+Ins+
Ins-Ins- Ins+Ins+
Ins-Ins- Ins+Ins+
Ins-Ins- Ins+Ins+
Ins-Ins- Ins+Ins+
Ins-Ins- Ins+Ins+ Ins-
Ins-Ins+ Ins+
Effect of resistin on gene expression of the enzymes involved in the PDC, PC and pyruvate cycling fluxes in L6E9 To investigate further if the observed effects in metabolic-flux distribution were prompted by a change in the gene expression of any of the enzymes involved in their activ-ities, we analysed the gene expression of several enzymes involved in pyruvate homeostasis at the end of the four in-cubation conditions tested.
Neither insulin, nor resistin, nor combination of the two hormones had a significant effect on levels of pyruvate carboxylase (Pc) mRNA or pyruvate kinase muscle iso-zyme (Pkm2) mRNA (Figure 2A and B). However, insulin (but not resistin) increased levels of pyruvate dehydrogen-ase E1 (Pdha1) and decredehydrogen-ased pyruvate dehydrogendehydrogen-ase kinase isozyme 2 (Pdk2) mRNA (Figure 2C and D). Pres-ence of resistin did not alter the decrease in levels of Pdk2 mRNA caused by insulin, but prevented the increase in levels of Pdha1 mRNA. mRNA expression of pyruvate de-hydrogenase kinase isozyme 4 (Pdk4) decreased after treatment with both hormones (Figure 2E), with an addi-tive effect if both were combined. These results suggest that resistin prevents the insulin-induced increase in Pdha1 expression, and does not prevent the increase in PDC activity caused by a reduction of expression of Pdk2 and Pdk4 genes.
Moreover, mRNA levels of cytosolic NADP-isocitrate dehydrogenase (Idh1) and NADP-dependent malic en-zyme (Me1), both causes of pyruvate cycling increasing NADPH production, were not affected by any of the hor-mones tested under these conditions (Figure 2F and G). However, insulin significantly decreased (by 50%) levels of Pck1mRNA in the absence of resistin, but not in the pres-ence of resistin (Figure 2H). These results suggest that resistin prevents inhibition of expression of the Pck1 gene. Hence, cytosolic flux in PEPCK may be active in the pres-ence of resistin independent of the prespres-ence of insulin.
Discussion
After the discovery of several adipocyte-secreted mole-cules (including lipid metabolites and adipokines), adipo-cytes were recognized as part of endocrine tissue [9,11,37]. These molecules enable adipocytes to communicate with other tissues and organs, and to regulate: the metabolism of lipids and glucose; energy balance; insulin action; cell proliferation. Resistin was identified as an adipokine, and
it was suggested that it might link obesity and IR [12,13]. However, the role of resistin in the pathophysiology of IR in humans and animals, and how it acts in muscle, liver and fat, is controversial [15,16].
Here, we investigated the effect of resistin on basal and insulin-stimulated glucose metabolism in L6E9 rat myotubes. We used tracer-based metabolomics and our in-house Isodyn software to analyse quantitatively meta-bolic flux distribution in this cell line under different in-cubation conditions. The response to insulin and other hormone stimuli in L6E9 cells is similar to that observed in skeletal muscle in vivo [38]. Hence, L6E9 cells are considered to be suitable models for analyses of the ef-fect of resistin on glucose metabolism and on the meta-bolic response of muscle cells to insulin.
Analyses with Isodyn data provided an overview of the central carbon metabolism of L6E9 skeletal muscle cells. Analyses were undertaken assuming a metabolic steady state (though not assuming an isotopic steady state), and rapid mixing of isotopic isomers of the same metabolite throughout different intracellular compartments. Incuba-tion with a large excess of glucose ensured the required glucose uptake throughout the incubation. The other con-ditions of incubation did not change, so the assumption of a metabolic steady state seemed reasonable. Rapid mixing of isotopic isomers of the same species throughout the cell is accepted for analyses of data of stable isotopes [39]. Fit-ting of experimental data in the framework of these as-sumptions suggested a set of metabolic fluxes underlying the measured distributions of isotopic isomers.
The effect of insulin on L6E9 myotubes increases glycolysis, PPP, and incorporation of pyruvate to the TCA cycle through PDC and fatty-acid synthesis
Our results suggested that L6E9 myotubes were highly glycolytic, with active synthesis and degradation of glyco-gen, and showed TCA-cycle activity and acetyl-CoA out-put. Oxidative PPP was weakly active in this cell type. Furthermore, use of the same tools revealed that insulin activated the uptake and phosphorylation of glucose, gly-colysis and lactate production, the oxidative branch of the PPP, pyruvate incorporation towards the TCA cycle and increased acetyl-CoA output (which is used for fatty-acid synthesis). We observed that insulin altered the ratio be-tween PDC and PC fluxes by increasing the PDC flux
(See figure on previous page.)
Figure 2 Gene expression of enzymes related to pyruvate homeostasis. L6E9 myotubes were treated (Res+) or not treated (Res–) with 100 nM resistin for 8 h and then incubated for 6 h with 10 mM glucose in the absence (Ins–) or presence (Ins+) of 100 nM insulin. RT-qPCR monitoring of mRNA levels of pyruvate carboxylase (Pc) (A), pyruvate kinase muscle isozyme (Pkm2) (B), pyruvate dehydrogenase E1 alpha 1 (Pdha1) (C), pyruvate dehydrogenase kinase isozyme 2 (Pdk2) (D), pyruvate dehydrogenase kinase isozyme 4 (Pdk4) (E), cytosolic NADP-isocitrate dehydrogenase (Idh1) (F), NADP-dependent malic enzyme (Me1) (G) and cytosolic phosphoenolpyruvate carboxykinase 1 (Pck1) (H) are shown. Results from three experiments are expressed as the mean ± S.E.M. (*) indicates p < 0.05 and (**) p < 0.01 compared with the condition of neither resistin nor insulin. (#) indicates p < 0.05 and (##) p < 0.01 compared with L6E9 myotubes treated only with resistin.
through an increase of levels of Pdha1 and decrease of Pdk2and Pdk4 mRNA. The effects of insulin on the meta-bolic flux distribution of L6E9 myotubes reported in the present study correlate with the known activation of PDC by profound suppression of Pdk4 expression in skeletal muscle [40], inhibition of expression of the Pck1 gene, and the increase in glucose uptake and lactate production ob-served using other approaches [38,41].
The effect of resistin on L6E9 myotubes increases glycolysis and fatty-acid synthesis and alters the ratio between PDC and PC, tilting it towards direct incorporation of pyruvate through PDC
Our results revealed that, in the absence of insulin, resis-tin activated glucose phosphorylation and the glycolytic pathway. Also, resistin did not affect the glycogen con-tent in skeletal muscle. Even though enrichment of the glycogen label (reflected in the m2 values of the glyco-gen molecule) was not significantly different to the con-trol condition, the tendency was for glycogen-related fluxes to be lower, a result that was in accordance with other works [22]. Furthermore, our approach showed that, even though many of the TCA-cycle fluxes remained un-changed, the ratio between the PDC and PC fluxes was sig-nificantly altered, effectively increasing the incorporation of pyruvate through PDC into mitochondria (as suggested by the reduction observed in levels of Pdk4 mRNA). PC activ-ity is finely regulated by mechanisms such as allosteric acti-vation by acetyl carnitine, which was not tested in this study. The acetyl-CoA output for fatty-acid synthesis was also increased after resistin treatment, which would explain the higher flux towards the TCA cycle.
The effect of resistin impairs normal insulin metabolic actions
We showed that resistin affects the normal metabolic re-sponse of L6E9 myotubes to insulin. Thus, the increase in glucose uptake and glycolytic flux induced by insulin was lower than that observed in resistin-treated myotubes. These results are in accordance with those published by other authors for L6 muscle cells [19,21,22]. Resistin treat-ment, however, did not affect the insulin-stimulated con-tent and recycling of glycogen.
Moreover, in resisttreated cells, insulin did not in-crease the PDC flux. After resistin treatment, levels of Pdk2 mRNA and Pdk4 mRNA were lower, accompanied with a reduction in levels of Pdha1 mRNA. The reduc-tion in expression of the main enzyme and key regula-tors of its activity resulted in a null net effect on the final flux. The ratio between the PDC and PC fluxes was also altered, showing reduction in the PC anaplerotic en-trance into the cycle.
Fluxes through the TCA cycle and acetyl-CoA output fluxes were not increased, but instead maintained or
reduced, by insulin in resistin-treated cells. This lack of metabolic activation in response to insulin can be ex-plained by the slight decrease observed in glucose up-take and the increase of lactate dehydrogenase flux directed to lactate production, which impaired the in-crease in the levels of glycolytic intermediates that could be metabolized through other metabolic pathways. Our results provide mechanistic explanations for the observa-tions of Palanivel and co-workers [22], who reported that the insulin-stimulated oxidation of glucose via the TCA cycle was reduced by resistin, and that this reduc-tion would compromise oxidative respirareduc-tion in the cell.
Conclusions
Several studies have identified positive correlations be-tween resistin levels and IR in vivo [24] and in vitro [19-22]. Overall, our results showed that resistin sig-nificantly alters glucose metabolism in L6E9 myotubes and their response to insulin. Of the whole set of meta-bolic changes induced by resistin in L6E9 myotubes, the imbalance in PDC and PC fluxes as well as the higher acetyl-CoA output flux for fatty-acid synthesis and other metabolic processes should be emphasized. Resistin im-pairs the normal metabolism of insulin, and the metabol-ism is directed to try to maintain the imbalance between the PDC and PC fluxes. In this way, L6E9 reduces TCA-cycle fluxes and acetyl-CoA output fluxes, which leads to an important metabolic imbalance in the central carbon metabolic pathways of L6E9 myotubes.
It has been reported that IR in skeletal muscle, liver and adipose tissue is usually accompanied by glucose in-tolerance and hypertriglyceridemia [24]. In this way, our results showed the importance of the balance of PDC and PC in glucose metabolism.
Our results support the idea that metabolic disorders such as T2DM are caused by complex multi-molecular in-teractions that cannot be explained readily by an alteration in expression of a single gene or gene product, or even al-teration of a single enzymatic cascade. The robustness of results obtained on the effects of insulin on L6E9 metabol-ism found by combining tracer-based metabolomic data and flux analyses using Isodyn showed that this approach is a suitable tool to study the effects of hormones on the central carbon metabolism network in myocytes.
Methods
Cells and reagents
Myoblastic cell line L6E9 was kindly provided by Dr. Nadal-Ginard (Harvard University, Boston, MD, USA). Rat recombinant resistin was produced in a HEK293 cell line. The purity of resistin was controlled by sodium dode-cyl sulfate–polyacrylamide gel electrophoresis (SDS-PAGE) and estimated to be >99%. Biological activity was validated as described [42]. Resistin was tested for endotoxin using a
ToxinSensor Chromogenic LAL Endotoxin Assay kit (bio-Nova científica, Madrid, Spain). This assay indicated low levels of endotoxins (0.0015 EU/mL) at the final concentra-tion used, which is below current USA Food and Drug Administion (FDA) limits that require eluates from medical devices to be <0.5 EU/mL. [1,2-13C2]-D-glucose and [U-13C-2H7]-D-glucose were purchased from Isotec (Miamisburg OH, USA) and 2-deoxy-D-[2,6-3 H]-glu-cose (2-DG) from GE Healthcare (Barcelona, Spain). Conditions for cell culture and incubation
Myoblastic cell line L6E9 was grown as described [38]. For biochemical and mass isotopomer assays, L6E9 myo-blasts were seeded at 104cells/cm2in 60-mm diameter dishes with 4 mL Dulbecco’s modified Eagle medium (DMEM) without glucose or glutamine (Biological In-dustries, Kibbutz Beit Haemek, Israel) supplemented with 10% heat-inactivated foetal bovine serum (FBS) (Life Technologies, Madrid, Spain), 10 mM glucose, 4 mM asparagine and 5% penicillin/streptomycin (Sigma–Aldrich, Saint Louis MO, USA). Cell differentiation was induced by lowering FBS to a final concentration of 2% when myo-blasts were pre-confluent [38].
Cells at day-4 of differentiation were washed four times in phosphate-buffered saline (PBS) and pre-treated or not with 100 nM resistin dissolved in DMEM without FBS and supplemented with 10 mM glucose, 4 mM as-paragine, 2% HEPES (Sigma–Aldrich) and 1% penicillin/ streptomycin. After 8 h, the medium was replaced by an-other with the same composition, but now with 10 mM glucose 50%-enriched in [1,2-13C2]-glucose in the pres-ence or abspres-ence of 100 nM insulin (Sigma–Aldrich). At the end of 6-h incubation, media were collected and dishes washed twice with PBS before freezing in liquid nitrogen. Incubation media and dishes were stored at – 80°C until biochemical and mass isotopomer analyses.
Glucose transport assay
To carry out the glucose transport assay, 105L6E9 cells/ dish were cultured on six-well plates. At day-4 of differen-tiation, cells were pre-treated or not with 100 nM resistin for 8 h, as described above. Next, uptake of 100 μCi 2-DG by myotubes incubated with or without 100 nM insulin for 30 min was measured as described [38].
Biochemical determinations of glucose, lactate and G6P Concentrations of glucose and lactate in incubation media at the beginning and end of 6-h incubations were measured as described previously by spectrophotometric methods coupled to a Cobas Mira Plus Chemical Analyzer (HORIBA ABX, Montpellier, France). Intracellular G6P content was determined by enzymatic means as described [43].
Mass isotopomer analyses of lactate, medium and glycogen glucose, and RNA ribose, and determination of glycogen content by GC/MS
Mass spectral data were obtained on a QP2010 Shimadzu Mass Selective Detector connected to a GC-2010 Gas Chromatograph (Shimadzu, Kyoto, Japan) using helium as the carrier gas and isobutane 0.0016 Pa as reagent gas in chemical ionization analyses. The settings were: GC inlet, 250°C for glucose, ribose and deoxyribose, and 200°C for lactate; transfer line, 250°C; MS source, 200°C. A Varian VF-5 Capillary Column (30-m length, 250-μm diameter, 0.25-μm film thickness) was used to analyze all compounds. Glucose from the frozen media was purified using a tan-dem set of Dowex-1X8/Dowex-50WX8 (Sigma–Aldrich) ion-exchange columns. The glucose from media was con-verted to its glucose aldonitrile pentaacetate derivative as described [43]. Ion clusters around m/z 328 (carbons 1–6 of glucose, chemical ionization) were monitored.
Lactate from the media was extracted with ethyl acet-ate after acidification with hydrochloric acid (HCl) and derivatized to its propylamide-heptafluorobutyric form. Clusters around m/z 328 (carbons 1–3 of lactate, chem-ical ionization) were monitored [43].
RNA ribose was isolated by acid hydrolysis of cellular RNA after Trizol purification of cell extracts. Ribose isolated from RNA was derivatized to its aldonitrile-acetate form using hydroxylamine in pyridine and acetic anhydride. We monitored ion clusters around m/z 256 (carbons 1–5 of ri-bose, chemical ionization) to find the molar enrichment and positional distribution of13C labels in ribose as described [44]. Glycogen in frozen cell monolayers from different ana-lytical conditions was extracted and quantified as de-scribed [44]. Extraction was done by direct digestion of sonicated extracts with amyloglucosidase. Mass isotopo-mer analyses of glycogen glucose was undertaken as de-scribed above for medium glucose. Measurement of glycogen content was carried out using the isotopomer [U-13C-2H7]-glucose as recovery standard and internal standard quantification procedures. The ion cluster for the [U-13C-2H7]-glucose of the glucose aldonitrile-pentaacetate derivative was monitored from m/z 339 to m/z 341.
Spectral data were corrected using regression analysis to extract natural 13C enrichment from results [45]. Meas-urement of13C label distribution determined the different relative distribution percentages of the mass isotopomers, m0 (without any13C labels), m1 (with one13C), m2 (with two13C), etc., which were reported as molar fractions. Analyses and modelling of data using Isodyn
Transfer of13C from [1,2-13C2]-glucose medium into intra-cellular metabolites was simulated by Isodyn, a software program written in C++ and designed for analyses of data from stable isotopic tracers [26,33,34]. Latest modifications of this software have been described in detail [35,36].
This software automatically constructs and solves the large system of ordinary differential equations describing the evolution of isotopomer concentrations of metabolites produced in glycolysis, TCA cycle, and PPP (Figure 1). All the reactions of the non-oxidative branch catalyzed by transketolase and transaldolase are accounted for, assum-ing pentose-5-phosphates to be a sassum-ingle pool. The reac-tions of the oxidative branch are passed to one reaction leading from G6P to pentose-phosphates. At this initial moment, all metabolites (except added labeled substrate) are assumed to be non-labeled, and the latter is set in ac-cordance with the known isotopomer composition of the used labeled substrate. Initial total concentrations of intra-cellular metabolites are calculated as functions of model pa-rameters assuming a steady state at the initial moment. Functions designed especially for each type of reaction (e.g., carboxylation, decarboxylation, transketolase-type) simulate transformation of the carbon skeleton (specific transitions of labeled carbons), and the production and consumption rate for each isotopomer of the considered system. These transformations redistribute13C isotopes in all metabolites. Individual rates are computed for each isotopomer, and these rates determine the values of the derivatives for the isotopomers. This system is solved using a method of numerical integration that can be chosen arbitrarily (Runge-Kutta, BDF, Dassl). Starting from the initial values corresponding to the experimental conditions of incuba-tion, Isodyn simulates a real-time course of label propaga-tion. Experimental and computed data for corresponding time points are compared. In this way, reaching an isotopic steady state is not required.
RNA extraction and real-time RT-qPCR gene-expression analyses
Total RNA was isolated from L6E9 cells using an RNeasy Mini kit and a QIAcube Automat (Qiagen, Venlo, the Netherlands). RNA integrity was checked by capillary electrophoresis (Experion; Bio-Rad, Hercules, CA, USA). Concentrations were checked with Ribogreen (Molecular Probes, Eugene, OR, USA) and a Victor-X5 Multilabel Reader (PerkinElmer, Waltham, MA, USA). Labelled cDNA was synthesized from 600 ng of total RNA using SuperScript-II, reverse transcriptase and random hexamers (Life Technologies, Madrid, Spain).
Oligonucleotide sequences for the reverse transcriptase reaction, synthesized by Eurogentec (Angers, France), were: pyruvate carboxylase (PC), Pc, rPC-F, TTCCGTGTC CGAGGTGTAAAG, and rPC-R, CGCTAGGAACTGCT GGTTGTT; pyruvate kinase muscle isozyme, Pkm2, 784F, GAGCAGGACGTGGACATGGT, and rPKm-864R, CTCTCCCAGGACCTTCCTAACC; pyruvate de-hydrogenase E1 alpha 1, Pdha1, rNm_001004072.2F, TTTGTCTTCTGTGCTGGGAGACTG and rNm_00100 4072.2R, GTAGATGGGTGGCTTCAAGTTTGC; pyruvate
dehydrogenase kinase isozyme 2, Pdk2, rNm_030872.1F, CATGGCTAAGCTCCTGTGTGAC, and rNm_030872.1R, GGACGTAGACCATGTGAATGGG; pyruvate dehydro-genase kinase isozyme 4, Pdk4, rNm_053551.1F, TGCT CATGAACCAGCACATCCTC and rNm_053551.1R, TCC CAATGTGGCTTGGGTTTCC; cytosolic NADP-isocitrate dehydrogenase, Idh1, rNm_031510.1F, AGACGTCCACCA ATCCCATTGC, and rNm_031510.1R, TCAAGCTTTG CTCTGTGGGCTAAC; NADP-dependent malic enzyme, Me1, rNm_012600.2F, TGCAAGACCATGGTTCCCAG AC, and rNm_012600.2R, AAGCTAAGCCCAGGGACA TTAGGG; cytosolic phosphoenolpyruvate carboxykinase (PEPCK) 1, Pck1, rPEPCK1-2228F, TGGTTCCACTTCG AGGTCACT, and rPEPCK1-2310R, CAAGTATGTTTT CTGTGCACTTTAGCT.
Real-time PCR (qPCR) was conducted with a Sybr-green Master Mix Reagent using Sureprime Core kit (MP Biomedical, III Kirch, France) in an iCycler (Bio-Rad, Marnes-la-Coquette, France) apparatus. The stand-ard curve method was used for relative quantification of PCR products, and gene expressions normalized to 18S RNA quantification, which has been found to be a reli-able internal control gene in our hands and by other scholars [46-48].
Statistical analyses
Experiments relating to glucose transport were carried out using three cultures each time for each treatment regimen and then repeated thrice. Metabolic characterization as-says were carried out in triplicate and repeated twice. RNAs for RT-qPCR assays were isolated from three inde-pendent extracts. Statistical analyses of glucose transport as well as biochemical and metabolite mass isotopomer distributions were calculated by two-way ANOVA be-tween groups. Data for real-time PCR were analyzed by the one-way ANOVA between groups. Confidence inter-vals at a confidence level of 95% or 99% (p < 0.05 and p < 0.01, respectively) were taken as indicating significant dif-ferences in each parameter analyzed. Difdif-ferences from the mean were considered significant for p < 0.05.
In the case of the metabolic fluxes estimated using Isodyn, the difference between calculated and experi-mental data (χ2) was minimized using a simulated anneal-ing algorithm. The goodness of best fit (correspondanneal-ing to the minimal deviation of calculated isotopomer fractions from the experimental ones) was checked based on the value of χ2 and number of degrees of freedom [36]. In the case that, according to this checking, the fit was deemed acceptable, the metabolic fluxes corresponding to the best fit were accepted as consistent with the mea-sured isotopomer distribution. The confidence intervals for the fluxes were determined as the upper and lower limits of fluxes that produced χ2that was less than the fixed threshold [36].
Abbreviations
2-DG:2-deoxy-D-[2,6-3H]-glucose; G6P: Glucose-6-phosphate; GP: Glycogen
phosphorylase; GS: Glycogen synthase; IR: Insulin resistance; PC: Pyruvate carboxylase; PDC: Pyruvate dehydrogenase complex; PEP: Phosphoenolpyruvate; PEPCK: Phosphoenolpyruvate carboxykinase; PPP: Pentose phosphate pathway; T2DM: Type-2 diabetes mellitus; TCA: Tricarboxylic acid.
Competing interests
The authors declare that they have no competing interests.
Authors’ contributions
SG, SM, FS, AZ, PR and MC conceived and designed the research. SG, SM, AM, RH, FS, AT and YD undertook the experiments. SG, SM, VS, AM, RH, FS, AT, YD and MC analysed data. SG, SM, AM, VS, JC, AZ, PR, and MC interpreted the results of the experiments. SG, SM, JC, AM, RH, FS, AT, YD and PR prepared the figures. SG, SM, AM, VS, PR and MC drafted the manuscript. SG, SM, AM, VS, JC, AZ, PR and MC edited and revised the manuscript. All authors read and approved the final manuscript.
Acknowledgements
This study was supported by European Union-funded project ETHERPATHS (FP7-KBBE-222639) and from Agència de Gestió d'Ajuts Universitaris i de Recerca (AGAUR)-Generalitat de Catalunya (2014SGR1017 and 2006ITT-10007). MC aknowledges the support received through the prize "ICREA Academia" for excellence in research, funded by ICREA foundation-Generalitat de Catalunya. We also thank Region Midi-Pyrenees for financial support of this work. Author details
1
Department of Biochemistry and Molecular Biology, Faculty of Biology, Universitat de Barcelona, Av Diagonal 643, 08028 Barcelona, Spain.2Institute
of Biomedicine of Universitat de Barcelona (IBUB) and CSIC-Associated Unit, Barcelona, Spain.3Institut National de la Santé et de la Recherche Médicale
(INSERM), UMR 1048, Toulouse, France.4Université Toulouse III Paul-Sabatier, Institut des Maladies Métaboliques et Cardiovasculaires (I2MC), Equipe n°7, Toulouse, France.5Animal Cell Technology Group, Biotechnology Research Institute, National Research Council Canada, Montreal, QC, Canada.6Institute
for Research in Biomedicine (IRB Barcelona) and CIBER of Diabetes and Associated Metabolic Diseases (CIBERDEM), Barcelona, Spain. Received: 12 May 2014 Accepted: 29 August 2014
References
1. Sorensen TI: The changing lifestyle in the world. Body weight and what else? Diabetes Care 2000, 23(Suppl 2):B1–B4.
2. Lavie CJ, Milani RV, Ventura HO: Obesity and cardiovascular disease: risk factor, paradox, and impact of weight loss. J Am Coll Cardiol 2009, 53:1925–1932.
3. Wijnhoven TM, van Raaij JM, Spinelli A, Rito AI, Hovengen R, Kunesova M, Starc G, Rutter H, Sjoberg A, Petrauskiene A, O´Dwyer U, Petrova S, Farrugia SV, Wauters M, Yngve A, Rubana IM, Breda J: WHO European Childhood Obesity Surveillance Initiative 2008: weight, height and body mass index in 6–9-year-old children. Pediatr Obes 2013, 8:79–97.
4. Poyrazoglu S, Bas F, Darendeliler F: Metabolic syndrome in young people. Curr Opin Endocrinol Diabetes Obes 2014, 21:56–63.
5. Chen L, Magliano DJ, Zimmet PZ: The worldwide epidemiology of type 2 diabetes mellitus–present and future perspectives. Nat Rev Endocrinol 2012, 8:228–236.
6. Gauthier MS, Ruderman NB: Adipose tissue inflammation and insulin resistance: all obese humans are not created equal. Biochem J 2010, 430:e1–e4.
7. Lolmede K, Duffaut C, Zakaroff-Girard A, Bouloumie A: Immune cells in adipose tissue: key players in metabolic disorders. Diabetes Metabol 2011, 37:283–290.
8. Donath MY, Shoelson SE: Type 2 diabetes as an inflammatory disease. Nat Rev Immunol 2011, 11:98–107.
9. Samaras K, Botelho NK, Chisholm DJ, Lord RV: Subcutaneous and visceral adipose tissue gene expression of serum adipokines that predict type 2 diabetes. Obesity 2010, 18:884–889.
10. Cao H: Adipocytokines in obesity and metabolic disease. J Endocrinol 2014, 220:T47–T59.
11. Coelho M, Oliveira T, Fernandes R: Biochemistry of adipose tissue: an endocrine organ. Arch Med Sci 2013, 9:191–200.
12. Holcomb IN, Kabakoff RC, Chan B, Baker TW, Gurney A, Henzel W, Nelson C, Lowman HB, Wright BD, Skelton NJ, Frantz GD, Tumas DB, Peale FV Jr, Shelton DL, Hébert CC: FIZZ1, a novel cysteine-rich secreted protein associated with pulmonary inflammation, defines a new gene family. EMBO J 2000, 19:4046–4055.
13. Steppan CM, Bailey ST, Bhat S, Brown EJ, Banerjee RR, Wright CM, Patel HR, Ahima RS, Lazar MA: The hormone resistin links obesity to diabetes. Nature 2001, 409:307–312.
14. Lazar MA: Resistin- and obesity-associated metabolic diseases. Horm Metab Res 2007, 39:710–716.
15. Schwartz DR, Lazar MA: Human resistin: found in translation from mouse to man. Trends Endocrinol Metab 2011, 22:259–265.
16. Qatanani M, Szwergold NR, Greaves DR, Ahima RS, Lazar MA: Macrophage-derived human resistin exacerbates adipose tissue inflammation and insulin resistance in mice. J Clin Invest 2009, 119:531–539.
17. Park HK, Ahima RS: Resistin in rodents and humans. Diabetes Metab J 2013, 37:404–414.
18. DeFronzo RA: Lilly lecture 1987. The triumvirate: beta-cell, muscle, liver. A collusion responsible for NIDDM. Diabetes 1988, 37:667–687.
19. Fan HQ, Gu N, Liu F, Fei L, Pan XQ, Guo M, Chen RH, Guo XR: Prolonged exposure to resistin inhibits glucose uptake in rat skeletal muscles. Acta Pharmacol Sin 2007, 28:410–416.
20. Jorgensen SB, Honeyman J, Oakhill JS, Fazakerley D, Stockli J, Kemp BE, Steinberg GR: Oligomeric resistin impairs insulin and AICAR-stimulated glucose uptake in mouse skeletal muscle by inhibiting GLUT4 translocation. Am J Physiol Endocrinol Metab 2009, 297:E57–E66.
21. Moon B, Kwan JJ, Duddy N, Sweeney G, Begum N: Resistin inhibits glucose uptake in L6 cells independently of changes in insulin signaling and GLUT4 translocation. Am J Physiol Endocrinol Metab 2003, 285:E106–E115.
22. Palanivel R, Maida A, Liu Y, Sweeney G: Regulation of insulin signalling, glucose uptake and metabolism in rat skeletal muscle cells upon prolonged exposure to resistin. Diabetologia 2006, 49:183–190. 23. Palanivel R, Sweeney G: Regulation of fatty acid uptake and metabolism
in L6 skeletal muscle cells by resistin. FEBS Lett 2005, 579:5049–5054. 24. Satoh H, Nguyen MT, Miles PD, Imamura T, Usui I, Olefsky JM:
Adenovirus-mediated chronic “hyper-resistinemia” leads to in vivo insulin resistance in normal rats. J Clin Invest 2004, 114:224–231.
25. Dettmer K, Hammock BD: Metabolomics–a new exciting field within the “omics” sciences. Environ Health Perspect 2004, 112:A396–A397. 26. Selivanov VA, Marin S, Lee PW, Cascante M: Software for dynamic analysis
of tracer-based metabolomic data: estimation of metabolic fluxes and their statistical analysis. Bioinformatics 2006, 22:2806–2812.
27. DeFronzo RA: Insulin resistance: a multifaceted syndrome responsible for NIDDM, obesity, hypertension, dyslipidaemia and atherosclerosis. Neth J Med 1997, 50:191–197.
28. Constantin-Teodosiu D: Regulation of muscle pyruvate dehydrogenase complex in insulin resistance: effects of exercise and dichloroacetate. Diabetes Metab J 2013, 37:301–314.
29. Huang B, Wu P, Bowker-Kinley MM, Harris RA: Regulation of pyruvate dehydrogenase kinase expression by peroxisome proliferator-activated receptor-alpha ligands, glucocorticoids, and insulin. Diabetes 2002, 51:276–283.
30. Crabtree B, Newsholme EA: The activities of phosphorylase, hexokinase, phosphofructokinase, lactate dehydrogenase and the glycerol 3-phosphate dehydrogenases in muscles from vertebrates and invertebrates. Biochem J 1972, 126:49–58.
31. Hakimi P, Yang J, Casadesus G, Massillon D, Tolentino-Silva F, Nye CK, Cabrera ME, Hagen DR, Utter CB, Baghdy Y, Johnson DH, Wilson DL, Kirwan JP, Kalhan SC, Hanson RW: Overexpression of the cytosolic form of phos-phoenolpyruvate carboxykinase (GTP) in skeletal muscle repatterns en-ergy metabolism in the mouse. J Biol Chem 2007, 282:32844–32855. 32. Minet AD, Gaster M: Pyruvate carboxylase is expressed in human skeletal
muscle. Biochem Biophys Res Commun 2010, 402:196–197.
33. Selivanov VA, Meshalkina LE, Solovjeva ON, Kuchel PW, Ramos-Montoya A, Kochetov GA, Lee PW, Cascante M: Rapid simulation and analysis of isotopomer distributions using constraints based on enzyme mechanisms: an example from HT29 cancer cells. Bioinformatics 2005, 21:3558–3564.
34. Selivanov VA, Puigjaner J, Sillero A, Centelles JJ, Ramos-Montoya A, Lee PW, Cascante M: An optimized algorithm for flux estimation from isotopomer distribution in glucose metabolites. Bioinformatics 2004, 20:3387–3397. 35. Selivanov VA, Vizan P, Mollinedo F, Fan TW, Lee PW, Cascante M:
Edelfosine-induced metabolic changes in cancer cells that precede the overproduction of reactive oxygen species and apoptosis. BMC Syst Biol 2010, 4:135.
36. de Mas IM, Selivanov VA, Marin S, Roca J, Oresic M, Agius L, Cascante M: Compartmentation of glycogen metabolism revealed from 13C isotopologue distributions. BMC Syst Biol 2011, 5:175.
37. Rosen ED, Spiegelman BM: Adipocytes as regulators of energy balance and glucose homeostasis. Nature 2006, 444:847–853.
38. Suarez E, Bach D, Cadefau J, Palacin M, Zorzano A, Guma A: A novel role of neuregulin in skeletal muscle. Neuregulin stimulates glucose uptake, glucose transporter translocation, and transporter expression in muscle cells. J Biol Chem 2001, 276:18257–18264.
39. van Winden W, Verheijen P, Heijnen S: Possible pitfalls of flux calculations based on (13)C-labeling. Metab Eng 2001, 3:151–162.
40. Lee FN, Zhang L, Zheng D, Choi WS, Youn JH: Insulin suppresses PDK-4 expression in skeletal muscle independently of plasma FFA. Am J Physiol Endocrinol Metab 2004, 287:E69–E74.
41. Quinn PG, Yeagley D: Insulin regulation of PEPCK gene expression: a model for rapid and reversible modulation. Curr Drug Targets Immune Endocr Metabol Disord 2005, 5:423–437.
42. Cifani C, Durocher Y, Pathak A, Penicaud L, Smih F, Massi M, Rouet P, Polidori C: Possible common central pathway for resistin and insulin in regulating food intake. Acta Physiol 2009, 196:395–400.
43. Marin S, Lee WN, Bassilian S, Lim S, Boros LG, Centelles JJ, FernAndez-Novell JM, Guinovart JJ, Cascante M: Dynamic profiling of the glucose metabolic network in fasted rat hepatocytes using [1,2-13C2]glucose. Biochem J 2004, 381:287–294.
44. Vizan P, Sanchez-Tena S, Alcarraz-Vizan G, Soler M, Messeguer R, Pujol MD, Lee WN, Cascante M: Characterization of the metabolic changes under-lying growth factor angiogenic activation: identification of new potential therapeutic targets. Carcinogenesis 2009, 30:946–952.
45. Lee WN, Byerley LO, Bergner EA, Edmond J: Mass isotopomer analysis: theoretical and practical considerations. Biol Mass Spectrom 1991, 20:451–458. 46. Harmancey R, Senard JM, Rouet P, Pathak A, Smih F: Adrenomedullin
inhibits adipogenesis under transcriptional control of insulin. Diabetes 2007, 56:553–563.
47. Schmittgen TD, Zakrajsek BA: Effect of experimental treatment on housekeeping gene expression: validation by real-time, quantitative RT-PCR. J Biochem Biophys Methods 2000, 46:69–81.
48. Aerts JL, Gonzales MI, Topalian SL: Selection of appropriate control genes to assess expression of tumor antigens using real-time RT-PCR. BioTechniques 2004, 36:84–86. 88, 90–81.
doi:10.1186/s12918-014-0109-z
Cite this article as: Guzmán et al.:13C metabolic flux analysis shows that
resistin impairs the metabolic response to insulin in L6E9 myotubes. BMC Systems Biology 2014 8:109.
Submit your next manuscript to BioMed Central and take full advantage of:
• Convenient online submission
• Thorough peer review
• No space constraints or color figure charges
• Immediate publication on acceptance
• Inclusion in PubMed, CAS, Scopus and Google Scholar
• Research which is freely available for redistribution
Submit your manuscript at www.biomedcentral.com/submit