Publisher’s version / Version de l'éditeur:
Technical Report, 2009-01-01
READ THESE TERMS AND CONDITIONS CAREFULLY BEFORE USING THIS WEBSITE. https://nrc-publications.canada.ca/eng/copyright
Vous avez des questions? Nous pouvons vous aider. Pour communiquer directement avec un auteur, consultez la
première page de la revue dans laquelle son article a été publié afin de trouver ses coordonnées. Si vous n’arrivez pas à les repérer, communiquez avec nous à [email protected].
Questions? Contact the NRC Publications Archive team at
[email protected]. If you wish to email the authors directly, please see the first page of the publication for their contact information.
NRC Publications Archive
Archives des publications du CNRC
For the publisher’s version, please access the DOI link below./ Pour consulter la version de l’éditeur, utilisez le lien DOI ci-dessous.
https://doi.org/10.4224/18227293
Access and use of this website and the material on it are subject to the Terms and Conditions set forth at
Vertical pipe in pipe marine riser - NRC tow tank experiments
Derradji-Aouat, A.
https://publications-cnrc.canada.ca/fra/droits
L’accès à ce site Web et l’utilisation de son contenu sont assujettis aux conditions présentées dans le site LISEZ CES CONDITIONS ATTENTIVEMENT AVANT D’UTILISER CE SITE WEB.
NRC Publications Record / Notice d'Archives des publications de CNRC:
https://nrc-publications.canada.ca/eng/view/object/?id=b42a51ff-bb9c-44a0-b991-5954d0a82d60 https://publications-cnrc.canada.ca/fra/voir/objet/?id=b42a51ff-bb9c-44a0-b991-5954d0a82d60
National Research Council Canada Institute for Ocean Technology Conseil national de recherches Canada Institut des technologies oc ´eaniques
TR-2009-22
Technical Report
Vertical Pipe in Pipe Marine riser - NRC Tow Tank
Experiments.
Derradji-Aouat, A.
Derradji-Aouat, A., 2009. Vertical Pipe in Pipe Marine riser - NRC Tow Tank
Experiments. St. John's, NL : NRC Institute for Ocean Technology. Technical Report, TR-2009-22.
DOCUMENTATION PAGE
REPORT NUMBER TR-2009-22
NRC REPORT NUMBER DATE
October 2009 REPORT SECURITY CLASSIFICATION
Unclassified
DISTRIBUTION Unlimited TITLE
VERTICAL PIPE IN PIPE MARINE RISER – NRC TOW TANK EXPERIMENTS
AUTHORS
Ahmed Derradji-Aouat
CORPORATE AUTHOR(S)/PERFORMING AGENCY(S)
Institute for Ocean Technology, National Research Council, St. John’s, NL PUBLICATION
SPONSORING AGENCY(S)
Institute for Ocean Technology, National Research Council, St. John’s, NL
IOT PROJECT NUMBER NRC FILE NUMBER
KEY WORDS
Marine risers, Vortex Induced Vibrations,pipe-in-pipe, spacers, loads, stresses
PAGES iii, 10 FIGS. 9 TABLES 3 SUMMARY
Marine environments with harsh conditions such as those off the coast of Newfoundland and Labrador, NL, Canada, place serious operating and performance demands on offshore structures built for oil and gas production. Marine risers for floating offshore platforms in such harsh conditions are subjected to continuous and various forms of excitations and vibrations, induced by severe waves, strong currents, high winds, sea ice, and iceberg collisions.
Vortex Induced Vibrations (VIV) enhance stress fatigue in marine risers and mooring systems, and consequently, shorten their expected design lifetime and increase the project’s overall capital cost. An alternate solution to the traditional “single pipe risers” is the use of pipe-in-pipe (PIP) marine risers. PIP design is based on the idea that an Inner Pipe (IP) and an Outer Pipe (OP), with floating spacers sandwiched in between, work together to reduce reacting/operating loads and fatigue stresses, increase the expected design lifetime of the riser, and maintain competitive capital costs for risers destined to operate in extremely harsh ocean environments.
A model for a PIP riser was fabricated and tested at the NRC-IOT (www.nrc.ca). The test program, instruments, test results, and analysis are presented in this paper.
ADDRESS National Research Council Institute for Ocean Technology Arctic Avenue, P. O. Box 12093 St. John's, NL A1B 3T5
National Research Council Conseil national de recherches Canada Canada Institute for Ocean Institut des technologies Technology océaniques
VERTICAL PIPE IN PIPE MARINE RISER –
NRC TOW TANK EXPERIMENTS
TR-2009-22
Ahmed Derradji-Aouat
TABLE OF CONTENTS
ABSTRACT ...1
1.0 INTRODUCTION...1
2.0 MDTF AND TEST PROGRAM...2
3.0 INSTRUMENTS AND DATA ACQUISITION ...4
3.1 Differential Variable Reluctance Transducers (DVRTs) ...5
3.2 Vicon System of Video Cameras and Motion Tracking Software ...5
3.3 Other Instruments ...5
4.0 PIP RISER MODEL – GENERAL VIV PARAMETERS...6
4.1 Riser Slenderness...6
4.2 Reynolds Number ...6
4.3 Vortex Shedding Frequency...6
4.4 Model Reduced Velocity ...6
5.0 TEST RESULTS AND TEST REPEATABILITY...6
5.1 In-Line Oscillations And Results (Measured Drag Force, Fy)...8
6.0 DISCUSSION AND CONCLUSIONS...9
ACKNOWLEDGEMENTS ...10
REFERENCES...10
LIST OF TABLES
Page
Table1. Geometric Parameters... 1
Table2. Series
#3
Test Matrix... 3
Table3. Sample
Test Results... 7
LIST OF FIGURES
Page
Figure1.
Design concept for the PIP marine riser system ... 2
Figure2.
PIP marine riser model – inner and outer components... 3
Figure3a.
A schematic for the MDTF and PIP model in the tow tank... 4
Figure3b.
Actual MDTF and PIP model in the tow tank ... 4
Figure4. Test
series – PIP project... 5
Figure5. Instrumentation
plan – PIP project... 5
Figure6.
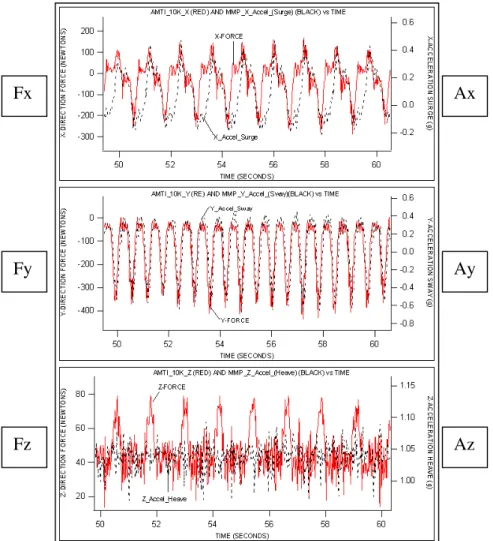
Forces (Fx, Fy, Fz) and accelerations (Ax, Ay, Az) Vs. time... 7
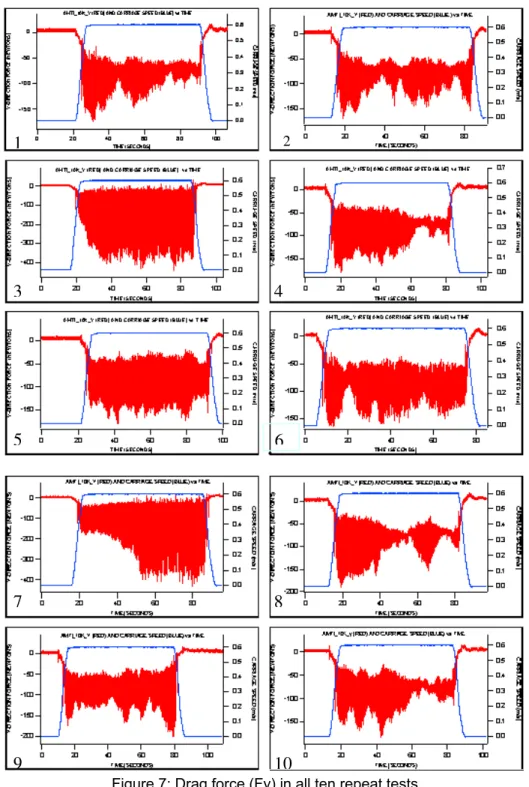
Figure7.
Drag force (Fy) in all ten repeat tests... 8
Figure8. Schematics
for enhanced drag force ... 9
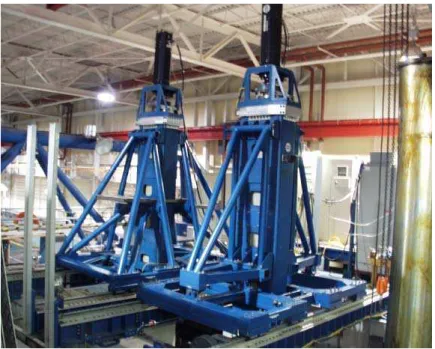
Figure9.
The MDTF – Marine Dynamics Test Facility at the NRC-IOT ... 10
1
VERTICAL PIPE IN PIPE MARINE RISER – NRC TOW TANK EXPERIMENTS
Ahmed Derradji-Aouat
National Research Council, Institute for Ocean Technology, St. John’s, Newfoundland and Labrador, Canada
ABSTRACT
Marine environments with harsh conditions such as those off the coast of Newfoundland and Labrador, NL, Canada, place serious operating and performance demands on offshore structures built for oil and gas production. Marine risers for floating offshore platforms in such harsh conditions are subjected to continuous and various forms of excitations and vibrations, induced by severe waves, strong currents, high winds, sea ice, and iceberg collisions.
Vortex Induced Vibrations (VIV) enhance stress fatigue in marine risers and mooring systems, and consequently, shorten their expected design lifetime and increase the project’s overall capital cost. An alternate solution to the traditional “single pipe risers” is the use of pipe-in-pipe (PIP) marine risers. PIP design is based on the idea that an Inner Pipe (IP) and an Outer Pipe (OP), with floating spacers sandwiched in between, work together to reduce reacting/operating loads and fatigue stresses, increase the expected design lifetime of the riser, and maintain competitive capital costs for risers destined to operate in extremely harsh ocean environments.
A model for a PIP riser was fabricated and tested at the NRC-IOT (www.nrc.ca). The test program, instruments, test results, and analysis are presented in this paper.
1.0 INTRODUCTION
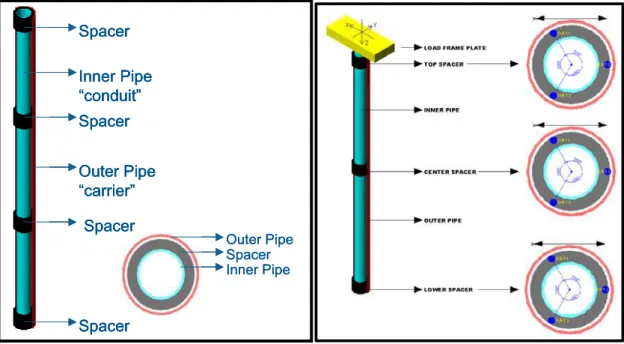
The present “Marine PIP” riser model is comprised of 3 main components. A 3.5m long OP, a 3.4 m long IP, and a series of hard rubber spacers placed between the two pipes at 500 mm centre-to-centre spacing (figures 1 and 2). Table 1 shows the geometric parameters of the two pipes and the spacers.
Table 1: Geometric Parameters
Parameter OP IP Spacers
Outer Diameter (OD) 101.6 mm (4”) 63.5 mm (2.5”) 88.9 mm (3.5”) Inner Diameter (ID) 95.25 mm (3.75”) 57.15 mm (2.25”) 63.5 mm (2.5”) Wall thickness 3.175 mm (0.125”) 3.175 mm (0.125”) 25.4 mm (1.0”)
Length 3.5 m 3.4 m 63.5 mm (2.5”)
Mass, kg 9.2775 5.5237 0.2414
The spacers are fixed only to the IP using small screws. There is a gap between the hard rubber spacers and the OP (figure 1). The gap allows the IP to move relatively free within the confines of the OP. This is a relatively new design concept, as opposed to the traditional “Land
PIP” systems where both IP and OP are fixed rigidly together at regular intervals.
The fundamental design concept of the “Marine PIP” riser is based on a bifurcation solution methodology (bifurcation means that multiple equilibrium loading states may exist during the riser operations). Essentially, the IP is in a constant search for a state of loading equilibrium (Derradji-Aouat et al., 2006a). At any given time during oscillations, one or more spacers impact the OP, and since the IP is not fixed to the OP, the spacers in contact with the OP act as temporary reaction points. The loads on these reaction points build up momentarily, and if the
frictional forces between the spacers and the OP are exceeded, then the IP slips into a new position of load equilibrium, and a set of new reaction points are formed (new set of spacers will be in contact). This continuous search for (and interchange of) reactions points is a key design feature that leads to protecting the IP from stress concentrations and build up of high reaction loads. Consequently, extending the design life of the riser (Derradji-Aouat et al., 2006a).
Also, the current “Marine PIP” riser design is intended to provide the IP with the capability to move relatively free within the OP. More importantly, while the OP is subjected to external vibrations drivers such as (VIV), the IP oscillations could be out of phase with that of the OP, and the result is that VIV will be reduced “or even prevented”.
Spacer Spacer Spacer Spacer Inner Pipe “conduit” Outer Pipe “carrier” Outer Pipe Spacer Inner Pipe Spacer Spacer Spacer Spacer Inner Pipe “conduit” Outer Pipe “carrier” Spacer Spacer Spacer Spacer Inner Pipe “conduit” Outer Pipe “carrier” Outer Pipe Spacer Inner Pipe
Figure 1. Design concept for the PIP marine riser system
2.0 MDTF AND TEST PROGRAM
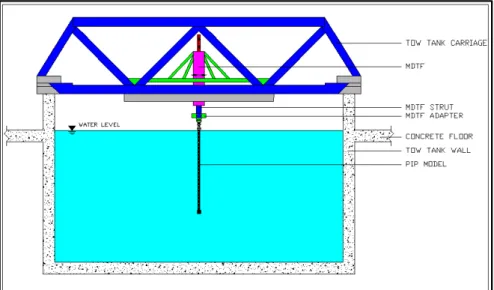
The Marine Dynamics Testing Facility, MDTF (figures 3a and 9), is the device that was used to provide forced lateral oscillations to the PIP riser model (figure 4). The tank carriage, however, provided the longitudinal movement of the PIP model. Together (the MDTF and the PIP model), they provided the possibility to conduct large and versatile marine riser test programs.
Originally, the MTDF was developed for the purpose to conduct submarine captive model testing (Derradji-Aouat et al., 2007a). An adaptor was used to connect the PIP model to the MDTF (figure 3b). The adaptor fits between the two vertical struts of the MDTF, and the 3.5 m long PIP riser model was hung freely from a plate rigidly bolted to the adaptor (figure 3b). Three types of test series were performed in the 200 m long (12 m wide and 7 m deep) clear water tow tank (CWTT) at the NRC-IOT (www.nrc.ca). The picture in figure 3b is typical of the PIP test program performed at the NRC-IOT tow tank using the MDTF.
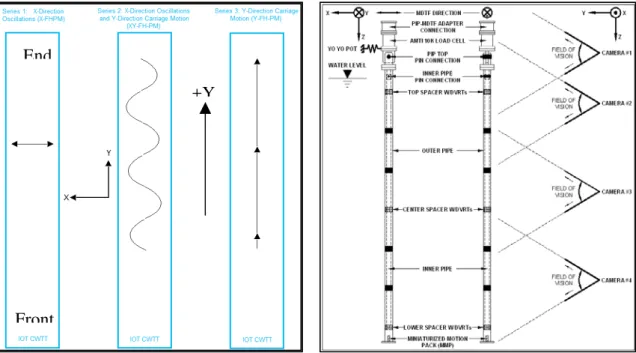
The test series were defined as per the combined lateral movement of the MDTF and the longitudinal travel of the carriage, figure 4. Also, the same figure shows an illustration for the lateral (X) and longitudinal (Y) directions in the CWTT.
The three types of test series performed for the present PIP project are depicted in figure 4, and they are:
• Series # 1: MDTF oscillations are provided in the X lateral direction of the tank and the tow carriage is not moving.
• Series # 2: MDTF oscillations are provided in the lateral X direction while the tow carriage is traveling in the longitudinal Y direction at a constant velocity.
• Series # 3: Tow carriage is travelling (at constant velocity) in the longitudinal Y direction of the tank and the MDTF is not moving at all.
Series # 1 tests are a sequence of experiments directly comparable to those conducted in air (no water) using the same PIP model (Derradji Aouat et al, 2007b).
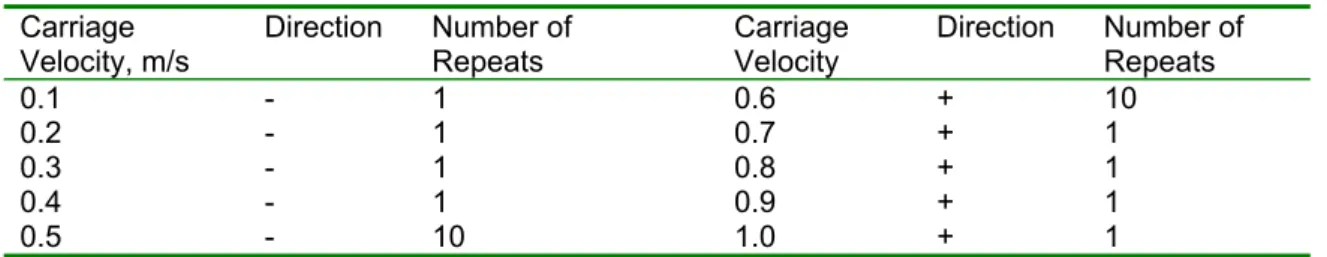
For series # 2 and # 3, the VIV parameters such as vortex shedding frequency and Reynolds numbers are varied through the carriage speed (as shown later). In both series, the speed of the carriage was varied between 0.1 to 1.0 m/s, in increments of 0.1 m/s.
Figure 2. PIP marine riser model - inner and outer components Table 2: Series # 3 Test Matrix
Carriage Velocity, m/s Direction Number of Repeats Carriage Velocity Direction Number of Repeats 0.1 - 1 0.6 + 10 0.2 - 1 0.7 + 1 0.3 - 1 0.8 + 1 0.4 - 1 0.9 + 1 0.5 - 10 1.0 + 1
The limits of the MDTF (operational envelope of the MDTF with regards to frequency and amplitude that can be achieved safely) were unknown prior to testing. This is due to the fact that the MDTF was never utilized for testing riser models (up to now only submarines were attached to the MDTF). Therefore, some test runs in series # 1 and # 2 were determined during testing in the tank as the MDTF revealed its real operating capacity.
For this paper, only the results from test series # 3 are analysed and discussed. Information and test data from series # 1 and # 2 are yet to be presented. The test matrix for series # 3 is given in Table 2. Note that in series #3, some test runs were conducted normally (carriage moving in the positive Y direction from front to back end of the tank, figure 4). However, some tests were conducted using the carriage in reverse (carriage moving from the back end of the tank to its front end, in the negative Y direction, figure 4). This was necessary in order to save time and conduct the maximum number of tests within the tank time planned for this program. Test runs conducted using the carriage in reverse have (-) sign velocity value in Table 2.
Figure 3a. A schematic for the MDTF and PIP model in the tow tank
Figure 3b. Actual MDTF and PIP model in the tow tank
3.0 INSTRUMENTS AND DATA ACQUISITION
A schematic for the instrumentation plan is given in figure 5. The list of instruments included: • Differential Variable Reluctance Transducers (DVRTs),
• A Six-Component Load Balance (AMTI force dynamometer), • Miniaturized Motion Pack (MMP),
• Two yoyo potentiometers, and
• Vicon system of video cameras and motion tracking software.
Both DVRTs and the Vicon system are non-intrusive (non-contact) instruments. Brief description of all instrumentations is given in the following subsections:
+Y
End
Front
Figure 4. Test series - PIP project Figure 5. Instrumentation plan - PIP project 3.1 Differential Variable Reluctance Transducers (DVRTs)
A DVRT is a sensor used to measure the gap between the outer diameter of the spacer and the OP inner wall. It measures the change in reluctance due to the change in position between the sensor and the ferrous OP material. The change in reluctance is converted to an electric signal, and in turn, the signal is converted into displacement using the calibration constants.
In this project, the DVRTs are embedded into the hard rubber spacers. Each spacer is fitted with 3 DVRTs, positioned at 120º relative to one another (figure 1). Nine (9) DVRTs were used; the top, middle and bottom spacers were instrumented (figure 1). Derradji-Aouat et al (2008) gave the details for the DVRTs and their calibration curves.
Distance time histories from all DVRTs are recorded during testing. Since each spacer includes 3 DVRTs (positioned at 120º relative to one another), and using some basic trigonometry equations (Derradji-Aouat et al., 2007b), the location of the geometric centre of the IP relative to the OP can be calculated at any given time.
Equally important, it should be noted that distance measurements by the DVRTs give indication for the IP mode shape tendencies inside the OP at any given time during testing. Further, from the distance measurements, velocities and accelerations of the IP, at the DVRTs locations, can be calculated (1st and 2nd derivatives of displacement). An added benefit for using the DVRTs is that their output can be used to monitor where, when, and if the spacers actually contacted the OP. At the time of spacer-OP contact, the measured distance at the contact location is zero. 3.2 Vicon System of Video Cameras and Motion Tracking Software
Tracking the motion of the OP during testing was accomplished by using three video cameras mounted vertically in such away that the entire length of the pipe is always in their field of view (figure 5). The colour of the OP was black, and white dots (called nodes) were painted along its length. The white dots provided high contrast so that the motion of these points can be tracked in the video images using the motion tracking software (MOTUS, http://www.vicon.com/). The software was also used to digitize automatically the movement of the white dots. Thus, displacements histories, velocities and accelerations were determined at each white dot location along the OP length. The video recording and digitations processes were calibrated as reported by Derradji-Aouat et al (2007b and 2008), and the overlapping cameras field of views allow the software to combine “stitch” all of the field views from each camera into one overall field view for the entire length of the model.
3.3 Other Instruments
• The Miniaturized Motion Pack (MMP, it is a cube shaped box with sides of about 3.5 inches) was placed at the bottom of the PIP model (figures 2 and 5). The MMP was used to measure accelerations and rates in all three directions at the bottom of the PIP model. • Two yo-yo potentiometers were installed at the top end of the PIP model (figure 5) to
measure displacements and velocities in both x and z directions. Each potentiometer has a stroke of about 2.54 m and a specified manufacturer accuracy of + 2%.
• The AMTI MC8 6-component force dynamometer (www.amti.biz) was used to measure both forces and moments in all 3 (x, y, and z) directions. The load cell was mounted at the top of the PIP riser model (figure 5).
4.0 PIP RISER MODEL - GENERAL VIV PARAMETERS 4.1 Riser Slenderness
From the geometric parameters (Table 1), the slenderness of the PIP riser model is L/D = 34.5. Generally speaking, for offshore oil and gas platforms, the PIP rise model used in this project is somewhat short. Riser slenderness in practical offshore applications is usually over 500. In deep-water operations, the slenderness ratio (D/L) of the riser is in the thousands.
Obviously, in this test program, the length of the PIP model was limited by the physical space (height available in the tank facility). The diameter was chosen to provide measurable and meaningful interactions (impacts) between the hard rubber spacers and OP.
From the PIP project objectives and the VIV stand point, the length and diameter of the PIP model (3.5 m) is very good, this is due to the fact that the relatively short PIP model did not have very high mode shapes and the cross flow oscillations were clearly visible and measurable at first modes. Earlier finite element analysis by Derradji-Aouat et al. (2006b) showed that the length of 3.5 m is acceptable.
4.2 Reynolds Number
The flow velocity “U” ranged between 0.1 m/s and 1.0 m/s, increments of 0.1 m/s. Reynolds numbers, , in this project are between 104 and 106 (ρ = water density ~ 1000 kg/m3, U = flow velocity, D = OP diameter, μ is dynamic viscosity = 1.003 103 Pa.s @ 20o C).
μ
ρ
=
/
Re
U
In the literature, Lienhard (1966) showed that in the range of Re 3.0 102 to 3.0 105, vortex-street is fully turbulent. However, for Re 3.0*105 < Re < 3.5*106, the laminar boundary layer has undergone all the turbulent transition and the wake is narrower and disorganised. Lienhard observation is important to this PIP project, in which all PIP test runs are within the “transition to
turbulence regime”.
4.3 Vortex Shedding Frequency
For Re numbers between 104 and 105, the Strouhal number is taken as 0.2 s. Strouhal number is , where fs is the shedding frequency. For the PIP model, the shedding frequency, fs, should be between 0.2/s and 2.5/s. (since U is varied between 0.1 and 1.0 m/s).
U
D
fs
St
=
*
/
4.4 Model Reduced Velocity
The reduced velocity where fn is the natural frequency, its value is estimated
at 0.3 Hz (Derradji-Aouat et al, 2007b), and therefore Vr should be between 3 and 32.
D
f
U
Vr
=
/
n*
5.0 TEST RESULTS AND TEST REPEATABILITY
The picture in figure 3b is typical of the PIP test program at the NRC-IOT tow tank using the MDTF. Derradji-Aouat et al (2008) gave the complete picture for the PIP tow tank test program and detailed analyses of the online test results. However, two particular tests were chosen as a sample for discussion in this paper. They are two tests conducted at 0.5 m/s and 0.6 m/s carriage speed (NV0P5_001 and PV0P6_002). Table 3 shows the general information for the two test runs.
Table 3. Sample Test Results
NV0P5 PV0P6 • Tests conducted at a carriage velocity of
0.5m/s (NV0P5 = carriage moved in reverse, negative Y direction at 0.5 m/s) • Any observed movements in lateral
X-direction is attributed to VIV • Test was repeated 10 times.
• Test conducted at a carriage velocity of 0.6m/s (PV0P6 = carriage moved in positive Y direction, at 0.6 m/s)
• Any observed movement of the PIP riser in x-direction is attributed to VIV
• Test was repeated 10 times.
The above two tests were chosen because each test was repeated 10 times. There are two main objectives for these repeats:
• Investigate whether or not the VIV phenomenon can be repeated at these Re numbers, for the present test configuration and test conditions.
• Investigate the degree of repeatability for experimental uncertainty analysis (EUA), as per ISOP-GUM (1995).
Only results from tests PV0P6 are discussed (because of paper space limitation). By and large, the same conclusions have been reached for NV0P5 (details for all test results are given by Derradji-Aouat et al, 2008 in an NRC-IOT internal report).
Fx
Ax
Fy
Ay
Fz
Az
Figure 6: Forces (Fx, Fy, Fz) and accelerations (Ax, Ay, Az) Vs. time
Figure 6 shows the “typical” measured forces from the AMTI force dynamometer and the “typical” measured accelerations from the MMP (from test PV0P6 - test repeat # 2). A very interesting note of confidence can be observed from the consistent trends and correlations
between the two measurements (in the lateral X and Y directions) that were obtained from two independent devices (AMTI force dynamometer and the NRC-IOT MMP).
1
23
4
5
6
7
8
9
Figure 7: Drag force (Fy) in all ten repeat tests
10
The following is an analysis for the measured drag forces Fy in all ten repeats (figure 7). Only drag forces (Fy) are discussed, those are forces attributed to in-line (Y direction) oscillations. 5.1 In-Line Oscillations and Results (Measured Drag Force, Fy)
Figure 7 shows the drag force (Fy) in all 10 repeat tests. Minimum drag force of about 50 to 60 N (mean of about 55 N) is obtained in all-repeats. However, it was noted that all forces are enhanced by as much as 2 to 3 times depending on the carriage speed (max drag force is about 150 N to 200 N in repeats 1,2,4,5,6,8,9,10). In 2 different repeats, the drag force was enhanced by about 6 times (Max drag force of about 350N to 400 N) in repeats 3 and 7.
During testing, the magnitude of the enhance drag is not constant but somewhat modulated (see sketch in figure 8). It is hypothesized that vibrations induced by cross flow oscillations (or VIV) is the source for this drag forces magnification. Cross flow oscillations were found to be function of the carriage speed and it reached maximum amplitude when the frequency for lateral oscillations is close to the natural frequency of the PIP model in the water.
It seems that a travelling wave (with frequency and mode) that magnifies drags forces and creates a modulated drag time history (figure 8). This traveling magnitude is probably a result of mode shape jumping and how that affects the type of vortices being shed (either 2S, 2P or combined), and introduces vertical asymmetric shedding along the PIP.
When analyzing data from repeat # 3, the augmented VIV effect is constant throughout the test. Although the nominal drag stays at 50 to 60 N, the VIV enhanced drag is substantial (from 55 N to 350 N). In repeat # 7, the nominal drag is also about 50 to 60 N, but the VIV enhanced drag increased gradually to a value of about 350 N, and then stayed constant. In repeat # 8, the nominal drag is 55 N. However, a decaying VIV enhanced drag is observed. Drag at the beginning of the tests was about 150N, then as the test progressed, the VIV enhanced drag decayed to the nominal drag of 55 N. This pattern is also observed in repeats 1, 4, and 10. Most of the VIV enhanced drag time histories are modulated (by some long term travelling wave and or facility bias). At this point, there is a need for more analysis to determine the exact physical mechanisms responsible for this observed “modulated” and/or “increased/decayed” patterns.
Figure 8. Schematics for enhanced drag force
6.0 DISCUSSION AND CONCLUSIONS
It is aimed that the current PIP design system could lead to a VIV self-mitigating marine riser design. This is easily achieved if the inner pipe (IP) works against the outer pipe (OP). The tow tank test results revealed many of the complex trends associated with the VIV phenomenon. By and large, the PIP test program was completed as planned. It included a large test matrix of 102 different test runs that spanned over three different series of tests (this is very versatile and information rich test program).
The versatility of the test program will, most certainly, provide the opportunity to conduct an in-depth analysis on the VIV phenomenon and the positive benefits for the PIP design to suppress (or minimize, or control) the cross flow oscillations.
One of the most interesting and revealing observations from the present test program is the modulated enhanced/decayed drag force due to cross flow motions of the PIP system (figure 8). This random modulated time histories of drag forces may lead to the belief that a long term traveling wave is governing the VIV (cross flow oscillations) process and the type of vortices
10
being shed. Although this may be very well true, the modulated results gave also the impression that non steady state (non stable mechanism) is governing the short-term behaviour of the PIP riser model. The short-term VIV phenomena, however, may be better understood as a part of the long-term review of the behaviour of PIP marine riser systems. Therefore, flume tank tests (longer time of testing) or long term field tests may be a better option for the PIP riser testing rather than testing in finite length tow tanks with a moving carriage.
ACKNOWLEDGEMENTS
The financial support and in-kind resources provided by the NRC-IOT, NRCan (Natural Resources Canada), and its CTTI (Climate Change Technology Innovation) grant are highly acknowledged and very much appreciated.
Figure 9. The MDTF - Marine Dynamics Test Facility at the NRC-IOT (www.nrc.ca)
REFERENCES
Derradji-Aouat A., Konuk I., Beresford R., Slade T. (2006a). Performance of Pipe In Pipe Riser Systems. Part I: Apparatus Design And Pre Tests Study. Institute for Ocean Technology, TR-2006-19.
Derradji-Aouat A., Konuk I., Beaton S. (2006b). Performance of Pipe in Pipe Riser Systems Part 2: Preliminary Numerical Modeling Development. Institute for Ocean Technology, TR-2006-24.
Derradji-Aouat A., Kuczora A., Williams C.D., Kirby C., and Pallard R. (2007a). Performance of Pipe in Pipe Riser Systems Phase 1: In-Air Test Program. Institute for Ocean Technology, TR-2007-21. Derradji-Aouat A., Bursey I., Wolf L., Konuk I. (2007b). Performance of Pipe in Pipe Riser Systems Phase
1: In-Air Test Program. Institute for Ocean Technology, TR-2007-21.
Derradji-Aouat A., Bursey I., Quinlan S., Konuk I. (2008). Performance of Pipe in Pipe Riser Systems Phase II: In-Water Test Program. Institute for Ocean Technology, TR-2007-21.
ISO, 1995, “Guide to the Expression of Uncertainty in Measurement”, International Organization for Standardization, Genève, Switzerland.
Lienhard J.H. (1966). Synopsis of lift, drag and vortex frequency for rigid circular cylinders. College of Engineering Research Division bulletin 300, Techn. Extension Service, Washington State University. Yettou E., Derradji-Aouat A., Williams C. D. (2008). Fluid-structure interactions modeling of pipe in pipe
riser systems operating in ocean environment. 8th International Conference on Hydrodynamics, Ecole Central de Nantes, France.