Publisher’s version / Version de l'éditeur:
Vous avez des questions? Nous pouvons vous aider. Pour communiquer directement avec un auteur, consultez la première page de la revue dans laquelle son article a été publié afin de trouver ses coordonnées. Si vous n’arrivez pas à les repérer, communiquez avec nous à PublicationsArchive-ArchivesPublications@nrc-cnrc.gc.ca.
Questions? Contact the NRC Publications Archive team at
PublicationsArchive-ArchivesPublications@nrc-cnrc.gc.ca. If you wish to email the authors directly, please see the first page of the publication for their contact information.
https://publications-cnrc.canada.ca/fra/droits
L’accès à ce site Web et l’utilisation de son contenu sont assujettis aux conditions présentées dans le site LISEZ CES CONDITIONS ATTENTIVEMENT AVANT D’UTILISER CE SITE WEB.
INFRA 2008 [Proceedings], pp. 1-12, 2008-11-17
READ THESE TERMS AND CONDITIONS CAREFULLY BEFORE USING THIS WEBSITE.
https://nrc-publications.canada.ca/eng/copyright
NRC Publications Archive Record / Notice des Archives des publications du CNRC : https://nrc-publications.canada.ca/eng/view/object/?id=fd93ced7-c45e-45d2-be6e-587aaa049fca https://publications-cnrc.canada.ca/fra/voir/objet/?id=fd93ced7-c45e-45d2-be6e-587aaa049fca
NRC Publications Archive
Archives des publications du CNRC
This publication could be one of several versions: author’s original, accepted manuscript or the publisher’s version. / La version de cette publication peut être l’une des suivantes : la version prépublication de l’auteur, la version acceptée du manuscrit ou la version de l’éditeur.
Access and use of this website and the material on it are subject to the Terms and Conditions set forth at
Continuous condition assessment of highway bridges using field
monitoring
http://irc.nrc-cnrc.gc.ca
C o n t i n u o u s c o n d i t i o n a s s e s s m e n t o f h i g h w a y b r i d g e s
u s i n g f i e l d m o n i t o r i n g
N R C C - 5 0 8 6 3
C u s s o n , D . ; D a i g l e , L . ; L o u n i s , Z .
2 0 0 8 - 1 1 - 1 9
A version of this document is published in / Une version de ce document se trouve dans:
INFRA 2008, Quebec city, Nov. 17-19, 2008, pp. 1-12
The material in this document is covered by the provisions of the Copyright Act, by Canadian laws, policies, regulations and international agreements. Such provisions serve to identify the information source and, in specific instances, to prohibit reproduction of materials without written permission. For more information visit http://laws.justice.gc.ca/en/showtdm/cs/C-42
Les renseignements dans ce document sont protégés par la Loi sur le droit d'auteur, par les lois, les politiques et les règlements du Canada et des accords internationaux. Ces dispositions permettent d'identifier la source de l'information et, dans certains cas, d'interdire la copie de documents sans permission écrite. Pour obtenir de plus amples renseignements : http://lois.justice.gc.ca/fr/showtdm/cs/C-42
17 AU 19 NOVEMBRE
LOEWS LE CONCORDE QUÉBEC
Continuous Condition Assessment of Highway Bridges Using Field Monitoring
Évaluation continue de l’état des ponts autoroutiers par surveillance in situ Daniel Cusson, Lyne Daigle, Zoubir Lounis
Institute for Research in Construction, National Research Council, Ottawa, Canada
Abstract: The ageing and deterioration of highway bridges can have serious consequences in terms of
reduced safety and serviceability. The objectives of this paper are to present an approach for the structural health monitoring of concrete bridge structures; and to demonstrate the effective use of field monitoring data for the updating of service life prediction models, which accuracy can be significantly improved. A case study on a major highway bridge is also presented and used to illustrate the approach.
Key words: field monitoring; condition assessment; concrete bridges; performance prediction. INTRODUCTION
Many bridges built in the 1960’s and 1970’s are considered deficient by today’s standards, as a result of ageing, increased traffic loads, deterioration, and more stringent bridge design codes. This can have serious consequences in terms of reduced safety, serviceability and functionality. The widespread deterioration and some recent bridge collapses have highlighted the importance of developing and implementing effective structural health monitoring strategies, which can identify structural problems before they become critical and endanger public safety. Continuous monitoring programs are necessary due to the ageing of highway bridges, increasing traffic loads, and the changing environmental conditions and material properties. The implementation of monitoring programs can assist in optimizing the in-depth inspection, maintenance, repair, rehabilitation and replacement of bridges. The continuous and simultaneous measurements at critical discrete points of a deteriorating bridge system can allow the assessment of its performance with respect to different limit states, including safety and serviceability. Moreover, deterioration prediction models can be calibrated from such monitoring data, which can optimize intervention strategies as to how and when to repair or rehabilitate, thus extending service life. The objectives of this paper are: (i) to present an approach for the structural health monitoring of concrete bridge structures; and (ii) to demonstrate the effective use of field monitoring data for the calibration and updating of service life prediction models. A case study on a major highway bridge is also presented and used to illustrate the approach.
FIELD MONITORING STRATEGY
In Canada, investments in bridges and overpasses have been under the level required to hold their average age constant, according to Statistics Canada. Hence, their average age rose from 21.3 in 1985 to 24.5 in 2007 with a mean service life of 43.3 years, suggesting that Canada’s bridges have passed 57% of their useful life on average (Gagnon et al. 2008). In North America, there is presently an urgent need for monitoring highway bridges, since nearly 25% of them in the USA are either structurally deficient or functionally obsolete (according to the FHWA NBIS database, Dec. 2007). A FHWA report on corrosion protection of concrete bridges estimated that the total cost to eliminate the backlog of deficient concrete bridges in the U.S. ranged between $78 billion and $112 billion, depending on the time required to carry out the task (Virmani and Clemena 1998).
The prohibitive costs needed to upgrade highway bridges require the development of innovative decision support tools for bridge owners and engineers. Such tools will enable them to assess the condition of their structures, predict future performance and allocate limited funds in order to better manage the maintenance of their structures and achieve adequate reliability and minimum life cycle costs. Causes of bridge failure include: inadequate design of materials and structural systems, heavy traffic loads, inadequate inspection and maintenance, lack of effective management systems, and inadequate funding available to address the above issues. The consequences include: increased risk of fatalities/injuries, reduced level of service, increased maintenance and user costs, and larger impact on the environment. Proper monitoring of bridge structures can actually contribute to reduce the risk of failure.
Structural health monitoring (SHM), either with embedded sensors or by actual field testing, is an evolving technology that allows monitoring the condition of existing or new civil engineering infrastructure. Implementation of SHM as an essential part of infrastructure design will be key to the development of the next generation of smart civil engineering structures. Intelligent sensing systems are composed of four main elements: (i) sensors and actuators that collect data and take action in an environment of interest; (ii) a network infrastructure for the transmission of data and control signals; (iii) systems for data management and visualization; and (iv) specific analysis and decision making applications. Figure 1 illustrates the concept of SHM of concrete bridge structures.
The selection of the required types and number of sensors located at discrete and critical points in a given structure relies mainly on the experience of engineers and their knowledge of the physical, chemical and mechanical processes, and on the budget allocated for SHM. In a larger context, monitoring data can be considered similar to quality assurance and acceptance sampling, since it is not realistically feasible to monitor all performance indicators in all sections of an entire structural system (Frangopol et al. 2008). For in-depth information on the design of SHM systems and specific applications to concrete bridges, the reader is referred to the ISIS guidelines on SHM (Mufti 2001). Structural health monitoring can benefit owners and users of concrete bridge structures in four different areas described below.
Ensuring public safety
For bridge owners, SHM can allow many structures to be monitored from a central site via Internet, thereby reducing the number of site visits for visual inspections and destructive- and non-destructive testing, providing key information on structural performance (e.g. girder deformation, column buckling, foundation settlement) and for durability assessment (e.g. concrete cracking, reinforcement corrosion, freeze-thaw damage), ensuring safety of users, and allowing timely decisions on corrective measures before problems become critical and endanger public safety. Bridges are safety-critical systems which should be monitored to ensure that the likelihood of failure of critical load bearing elements is kept very low, especially for bridges in urban areas, long-span bridges, or non-redundant systems for which failure can have catastrophic consequences (injuries and fatalities).
Development and adoption of new construction technologies
For the industry and research community, SHM can provide a structured approach to assessing the performance of various emerging technologies applied in demonstration projects, whether they are conducted on old concrete structures, or new construction. Research on concrete bridge structures involves the use of sensors and data acquisition systems for continuous monitoring of selected performance parameters (Afhami and Cheng 1998; Tennyson et al. 2001; Cusson et al. 2007). Sensors can provide detailed knowledge of: (i) the conditions under which the structure is being evaluated, including: applied loads, imposed displacements, ambient relative humidity and temperature; and (ii) selected performance parameters, which could give insights about the performance of a newly-developed concrete technology used in the structure, or the overall behaviour of the structure as a result of strengthening or repair.
Development and calibration of prediction models
The vital information acquired by SHM can foster a better understanding of damage initiation and growth in concrete bridge structures and calibration of service life prediction models. The continuous updating of service life predictions with monitored field data can have a strong influence on intervention planning. More details will be given in the next section of this publication.
Update of loading data for the design of concrete structures
Another benefit of SHM is to help assess the live loads on bridge structures as well as environmental loads, and identify any major variations from the values that are assumed in bridge design codes. This is becoming an important issue given the growing concerns with climate change and its potential impact on the safety and serviceability of concrete bridge structures due to increases in wind loads, flooding, thermal gradients, freeze-thaw cycles, deicing salt use, etc.
CASE STUDY
The purpose of this section is to illustrate the benefits of SHM in improving the reliability of service life predictions and, more specifically, to point out that some of the input data which are commonly used in service life prediction models (e.g. surface chloride content, chloride diffusion coefficient, chloride threshold and corrosion rate) can be somewhat different from reality, as some parameters can vary widely in time and space and can also be highly uncertain, stressing the importance of continuous model updating with field monitoring data.
Description of test structure
In the fall of 1996, the Ministry of Transportation of Québec undertook the rehabilitation of the Vachon bridge, which is a major highway bridge located North of Montreal, Québec. Part of the rehabilitation work consisted in rebuilding the barrier walls, of which ten consecutive spans (each 35 m in length) were selected as the test site for the application of different commercial corrosion inhibiting systems. The barrier wall reinforcement consisted of eight 15-mm longitudinal bars in the cross-section, and 15-mm transverse bars spaced at 230 mm along the barrier wall length (Figure 2). The concrete had a water-cement ratio (w/c) of 0.36 (selected to obtain low permeability), a CSA Type 10 water-cement content of 450 kg/m3, an air content of 6.5%, and an average 28-day compressive strength of 45 MPa. More details on this study can be found in Cusson et al. (2008).
Summary of experimental program
On-site corrosion surveys of the barrier wall were performed annually in May or June from 1997 to 2006, including measurements of half-cell potential and corrosion rate in the test sections of barrier wall, for which the concrete cover to the reinforcement was 75 mm. For early detection of corrosion, sets of rebar ladders were embedded in the barrier wall during construction. The ladder bars had concrete cover thicknesses of 13 mm, 25 mm, 38 mm, and 50 mm (Figure 2), enabling additional measurements of half-cell potential and corrosion rate to be taken (more details in Cusson et al. 2008).
ANALYSIS OF SELECTED TEST DATA
Measurement and prediction of chloride ingress in concrete
Concrete cores have been taken from the bridge barrier walls after 1, 2, 4, 5, 8 and 10 years of exposure to deicing salts in order to test a number of parameters, including chloride concentration. Of the 10 spans of barrier wall under study, three of them had identical concrete formulations and concrete surface conditions (referred to as Spans 12, 19 and 21 in Cusson et al. 2008). Only the test results obtained on these three test spans will be used in this paper.
Figure 3 presents the mass of total chlorides per volume of concrete measured after 10 years of exposure to deicing salts, where each data point is an average from two concrete cores. A best-fit curve was obtained by linear correlation using the measured chloride concentrations at depths of 18 mm or greater, and Crank’s solution to Fick’s second law of diffusion (Crank 1975):
⎥ ⎥ ⎦ ⎤ ⎢ ⎢ ⎣ ⎡ ⎟ ⎟ ⎠ ⎞ ⎜ ⎜ ⎝ ⎛ − = t D x erf C t x C C S 2 1 ) , ( (Eq. 1)
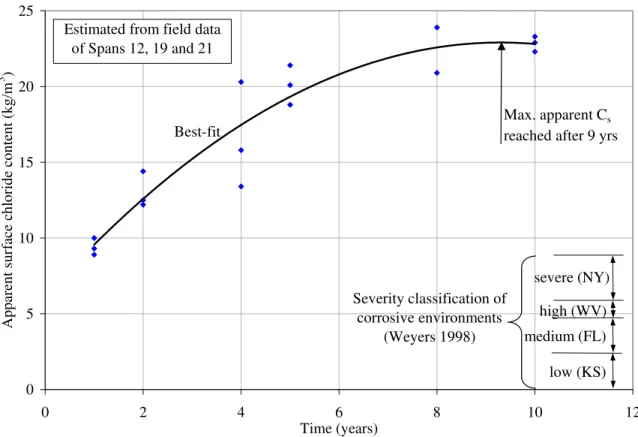
where C(x,t) is the chloride concentration at depth x after time of exposure t; Cs is the apparent chloride concentration at the surface; erf is the error function, and Dc is the apparent chloride diffusion coefficient. From this data, an average apparent surface chloride content of 20.7 kg/m3 and an average apparent chloride diffusion coefficient of 0.93 cm2/year were obtained. Note that the chloride concentrations measured at the 6-mm depth were not used in the correlation since mechanisms other than diffusion can affect the chloride concentration near the surface, such as capillary action and leaching due to cycles of wetting and drying of concrete. In reality, the maximum surface chloride content is estimated to be at least 16.8 kg/m3 in the barrier wall (Figure 3), which is already quite higher than the maximum value of 8.9 kg/m3 suggested by Weyers (1998) for regions with severe levels of exposure to deicing salts. Note that these guidelines were developed for the US and may not apply to regions like Canada or other northern countries, where de-icing salts are used in larger quantities and for longer winter periods.
Similarly, the apparent chloride diffusion coefficient measured for the concrete barrier wall is found to be much larger than those obtained from the literature on similar concretes. For instance, an apparent chloride diffusion coefficient of 0.38 cm2/year for a 0.36 w/c concrete (with no supplementary cementing materials) is found when using the proposed relationship of Boulfiza et al. (2003) developed from a very large set of literature data. For this case, Figure 3 presents the prediction of the chloride profile using Crank’s solution of Fick’s second law of diffusion with Dc = 0.38 cm2/year and Cs = 20.7 kg/m3. It can be seen that the chloride concentration at the main reinforcement level (75 mm) is largely underestimated after only ten years. These discrepancies can be explained by the large fluctuations of many factors influencing chloride ingress in concrete, including concrete mixture formulation, hydration and curing characteristics, temperature and humidity conditions, and surface chloride concentrations. Another prediction is also shown in Figure 3 using a mean Cs = 7.4 kg/m3 from Meyers (1998) for severe exposure
conditions and a Dc = 0.21 cm2/year measured by Dhir et al. (1990) on similar concrete. It can be concluded that determining the chloride profile for a given concrete structure using carefully-selected literature values, even from apparently-similar concrete, can result in inaccurate estimations, thus resulting in poor predictions of the remaining service life of the structure.
Figure 4 presents the measured apparent surface chloride concentrations as a function of time. It can be observed that the surface concentrations increased with time and tend to reach a maximum value of 23.2 kg/m3 after approximately 10 years of salt exposure. The apparent Cs values obtained after 2 years and 5 years represent 55% and 85% of the 10-year value, respectively. Figure 5 shows that the apparent chloride diffusion coefficient reduced with time by a factor of 2 from Year 2 to Year 10, which could be explained in part by the continuing cement hydration and corresponding reduction in concrete porosity. Knowing that most chloride diffusion prediction models use constant values of Cs and Dc, the above observations suggest that simplified models may give inaccurate predictions if input values of Cs and Dc are not updated with adequate field data or based on one set of field data taken too early in the structure’s life). Figure 6 confirms the above and shows that using more recent updates of Cs and Dc (e.g. Year 5 values instead of Year 2 values) in the chloride diffusion model can improve the accuracy of the chloride profile predicted for Year 10, especially for thin concrete cover depths. It is also interesting to see that for depths larger than 50 mm in this concrete barrier wall, the accuracy is not much improved by the update process (at least for values measured after two years of exposure).
Prediction of corrosion initiation and concrete spalling
To predict the time of reinforcement corrosion initiation (ti), Eq. 1 was rearranged by setting C(x,t) equal to a chloride threshold value (Cth), at which the corrosion of the reinforcing steel is expected to initiate, and x equal to the effective cover depth of the reinforcing steel (dc). Assuming that concrete in tension behaves like a homogeneous elastic material and that corrosion products are equally distributed around the perimeter of the reinforcing bars (Bažant 1979), stresses generated in the concrete by corrosion products were estimated using the thick-wall cylinder model (Timoshenko 1956). This model allows the calculation of the increase in the rebar diameter (Δd) related to the initiation of the different stages of corrosion-induced damage.
The corrosion propagation times (tp), corresponding to the onset of internal cracking, surface cracking, and delamination/spalling, respectively, were found as follows:
⎥ ⎦ ⎤ ⎢ ⎣ ⎡ − Δ = s r r p j S d d t
ρ
α
ρ
π
1 2 ) ( (Eq. 2)where d is the rebar diameter; S is the rebar spacing; jr is the rust production rate per unit area (Bažant 1979); ρr is the density of corrosion products (assumed at 3600 kg/m3 for Fe(OH)3); ρs is the density of steel (7860 kg/m3); and α is the molecular weight ratio of metal iron to the corrosion product (assumed at 0.52). The total time to reach a given corrosion-induced damage level is the sum of the corrosion initiation time (ti) and the individual corrosion propagation times (tp) up to that level. Work by Allan and Cherry (1992) showed that there may be a porous zone around the steel reinforcement at the steel/concrete interface, in which a specific quantity of corrosion products can accumulate before tensile stresses actually develop in concrete, thus delaying the damage initiation of the concrete cover. The thickness of the porous zone may be in the order of 12.5 μm according to Liu and Weyers (1998).
Figure 7 presents a sensitivity analysis of the times to reach reinforcement corrosion initiation and concrete spalling depending on several factors: (i) depth of reinforcement; (ii) chloride threshold (based on measured Cs and Dc); and (iii) corrosion rate. At the 75 mm depth (location of main rebars), the
prediction indicates a time for corrosion initiation ranging between 6 and 10 years based on the chloride threshold values suggested by ACI (2001) and CEB (1992). This prediction is highly questionable since no significant corrosion was observed on sections of reinforcing bars cut from the bridge barrier wall after 10 years (Cusson and Qian 2007). Combined with the observation that the concrete surfaces over the 25-mm deep bars were still free of defects after 10 years (Cusson and Qian 2007), it seems that chloride threshold values larger than 2 kg/m3 would be more representative in this case than the more conservative values of ACI and CEB. It can also be observed that for bars with very thin concrete cover (e.g. 25 mm in this case), the times to corrosion initiation and concrete spalling are much less dependent of the chloride threshold due to the relatively short time needed for the chlorides to diffuse through short distances. A review of the literature shows a strong disagreement amongst researchers on the range of values to consider for the chloride threshold of conventional reinforcing steel in concrete. For example, the following values have been reported: 0.6-4.9 kg/m3 (Stratfull et al. 1975), 0.7-5.25 kg/m3 (Vassie 1984), 6.3-7.7 kg/m3 (Lukas 1985), 0.87 kg/m3 (West and Hime 1985), and 1.05-1.75 kg/m3 (Henriksen 1993). There are many reasons explaining these differences, including the variability of several concrete properties and exposure conditions, such as pH level, w/c, type of cementing materials and content, temperature, relative humidity (Tuutti 1993), as well as the uncertainty associated with the definition of chloride threshold (Alonso et al. 2000).
At a depth of 75 mm, the models predicted spalling of concrete after 15 to 17 years of exposure, based on the commonly-used value of corrosion rate of 0.50 μm/cm2
and indirectly on the ACI and CEB chloride threshold values. Again, this event is highly unlikely in this case. In fact, the average corrosion rates measured in the bridge barrier walls (near cracks) were 0.25 μm/cm2
for the 75-mm deep reinforcement (and 0.3 μm/cm2
for the 25-mm deep test bars). With this field data, and assuming a chloride threshold larger than 2 kg/m3, the models predict spalling at 25 years (at least) for the 75-mm deep bars. Another factor affecting prediction accuracy is the high variability of the corrosion rate, which depends on many factors, including the location on the reinforcement relative to a crack, and the time of the year related to ambient temperature and relative humidity (Shiessl and Raupach 1990). The corrosion rate can be expected to reach maximum values during the warm season and minimum values during the cold season, and possibly negligible values if the concrete is frozen.
DISCUSSION
Improvement of service life prediction of concrete structures with updated field data
In the previous section, it was shown that some of the input data that are commonly used in service life prediction models (e.g. surface chloride content, chloride diffusion coefficient, chloride threshold and corrosion rate) could be very different from actual field values, because these parameters vary widely in time and location and are highly uncertain.
To deal with the high variability and uncertainty of input data, two approaches could be used in combination. As mentioned before, structure health monitoring is one approach that can provide valuable information on several key parameters simultaneously, and on a regular basis. For example, corrosion rates are usually ‘manually’ measured during the summer time for convenience. This could result in overly conservative predictions of service life. On the other hand, remote monitoring of the corrosion rate with embedded instrumentation on a daily basis could provide a meaningful value of the yearly average, which can still be expected to increase as reinforcement corrosion and concrete deterioration develop over the years. The second approach is the use of probabilistic models accounting for this variability using average values and coefficient of variations of key parameters as well as their stochastic correlation in time and space (Lounis and Daigle 2008). Such models are more robust than deterministic models. SHM can be used to calibrate these probabilistic models.
Early adoption of intelligent sensing systems in concrete structures
Another point of discussion is related to factors that may slow down the adoption of intelligent sensing systems as an essential element in the design and construction of concrete bridge structures. Following is a list, which identifies some of the needs that should be addressed by the sensor industry:
Instrumentation costs: Today, monitoring a short-span bridge with a 100 sensors and a main data
acquisition system may cost over $10,000 in purchase. Taking into account sensor installation, wiring, maintenance, data analysis and reporting, the total monitoring cost can increase up to over $100,000. Although the cost of sensors has come down greatly, it can be easily shown that this initial investment can lead to decreased life cycle costs, since SHM can help reduce inspection costs and optimize intervention planning, possibly resulting in longer service life for the structure.
Miniaturization of sensors: Some properties are best monitored inside concrete elements rather than
from the surface. Bulky sensors, however, can disturb the environment being measured (e.g. strains, stresses) and even induce cracks. It is therefore crucial to develop small, compact sensors for applications in thin concrete sections, or in thick sections with non-uniform properties. Sensors, ideally, should not exceed the size of the largest particle in concrete, for example, coarse aggregate or reinforcing bars. Nanotechnology is now being considered for the fabrication of microelectromechanical sensors (Norris et al. 2008).
Wireless technology: Bundles of sensor wires can also be problematic in thin concrete sections, as they
can induce cracks or weaknesses in concrete. When concrete cracks (as a result of excessive loading or restrained shrinkage), sensor wires can be sectioned easily, thus rendering useless the attached embedded sensors. The routing of sensor wires in concrete is always a delicate and labour-intensive task in field projects, thus increasing costs. The wireless technology for sensor activation, sensor excitation and transmission of data is now ready for applications in concrete structures (Pakzad 2008), but very few sensors are presently equipped with this technology, and their high costs often prohibits their use.
Durability of embedded sensors: Many sensors work well in open-air environment, however, very few
are durable when embedded in concrete due to many factors such as: high stress, high relative humidity, and high concentrations of chemicals (chloride ions, sulphates, pH, admixtures). Several types of embedded sensors cannot be removed from the structure for replacement or calibration. Today, the service life of conventional electric-based sensors may range from 1 to 10 years at most, while critical concrete bridge structures are designed for 75 to 100 years.
Development of new types of sensors: Several concrete properties that are important for durability
assessment of concrete bridge structures can now only be measured by conventional destructive testing (e.g. chloride concentration, pH, carbonation depth) or by the use of expensive non-destructive equipment (corrosion current density of embedded reinforcement). Bridge owners are reluctant to use destructive testing on their structures or may not have the resources to obtain and maintain expensive testing equipment, stressing the need for the development of new sensors. Fibre-optic sensors, so far, can only measure strain, displacement and temperature in concrete structures.
Universal data acquisition systems: Commercially available data acquisition systems that can read
both electrical sensors and fibre optic sensors are uncommon and very expensive. To monitor a wide range of strength and durability related properties in concrete bridge structures, it is often necessary to use both fibre-optic sensors and conventional electrical sensors, thus requiring the use of different and independent data acquisition systems, resulting in a substantial increase in complexity and cost of instrumentation.
CONCLUSIONS
The ageing and deterioration of highway bridges can have very serious consequences in terms of reduced safety and serviceability. Structural health monitoring (SHM), either with embedded sensors or by actual field testing, is an evolving technology that allows monitoring the health of existing or new civil engineering infrastructure. SHM can benefit the owners and users of concrete bridge structures by ensuring public safety and optimizing the inspection and maintenance of bridges. SHM can help assess the performance of new construction/rehabilitation technologies, the development and calibration of service life prediction models, and the updating of loading data for use in the design of concrete structures. It was shown by the use of a case study that some of the input data, commonly used in service life prediction models, could be very different from reality, because these parameters vary widely in time and location and are highly uncertain. It was also shown that service life predictions can be improved by updating the models with field monitoring data.
REFERENCES
ACI, “Protection of Metals in Concrete Against Corrosion”, American Concrete Institute, ACI Report 222R-01, Farmington Hills, 2001, 41 p.
Afhami, S., Cheng, J.J.R., Field instrumentation and monitoring of crowchild bridge in Calgary, 5th Intl Conference on Short and Medium Span Bridges, July 13-16, 1998, Calgary, Canada.
Allan, M.L., Cherry, B.W., “Factors controlling the amount of corrosion for cracking in reinforced concrete”, Journal of Corrosion Engineering, 1992, p. 426-430.
Alonso, C., Andrade, C., Castellote, M., Castro, P., Chloride threshold values to depassivate reinforcing bars embedded in a standardized OPC mortar, Cement and Concrete Research, 30(7), July 2000, p. 1047-1055. Bažant, Z.P., “Physical model for steel corrosion in concrete sea structures – theory”. Journal of the Structural
Division, 105(ST6), 1979, p. 1137-1153.
Boulfiza, M., Sakai, K., Banthia, N., Yoshida, H., “Prediction of chloride ions ingress in uncracked and cracked concrete”, ACI Materials Journal, 100(1), January-February 2003, p. 38-48.
CEB, Design guide for durable concrete structures, 2nd ed., Thomas Telford Publishers, 1992.
Crank, J., The mathematics of diffusion, Second edition, Oxford University Press, London, 1975, 414 p.
Cusson, D. Glazer, R., Hoogeveen, T., Field performance of hydrophobic concrete slabs of a parking structure evaluated by remote monitoring’, 12th International Conference on Chemistry of Cement, Montreal, Canada, July 2007, p. 1-12.
Cusson, D., Qian, S.Y., Corrosion inhibiting systems for concrete highway bridges - 10 years of field performance evaluation," 5th International Conference on Concrete Under Severe Conditions Environment and Loading, Tours, France, June 4-6, 2007, 10 p.
Cusson, D., Qian, S., Chagnon, N., Corrosion inhibiting systems for durable concrete bridges – Part 1: Field performance evaluation, ASCE Journal of Materials, 20(1), January 2008, p. 20-28.
Dhir, R.K., Jones, M.R., Ahmed, H.E.H., Seneviratne, A.M.G., Rapid estimation of chloride diffusion coefficient in concrete, Magazine of Concrete Research, Vol. 42, 1990, p. 177-185.
Frangopol, D.M., Strauss, A., Kim, S., Bridge reliability assessment based on monitoring, Journal of Bridge Engineering, ASCE, May-June 2008, p. 258-270.
Henriksen, C.F., Chloride corrosion in Danish bridge columns, in Chloride Penetration into Concrete Structures, L.-O. Nilsson (ed.), Göterborg, Sweden, 1993.
Liu, Y., Weyers, R.E., “Modeling time-to-corrosion cracking in chloride contaminated reinforced concrete structures”, ACI Materials Journal, 95(6), 1998, p. 675-681.
Lounis, Z., Daigle, L., Reliability-based decision support tool for life cycle design and management of highway bridge decks, Annual Conference of the Transportation Association of Canada (TAC), Toronto, Canada, Sept. 2008, 19 p.
Lukas, W., Relationship between chloride content in concrete and corrosion in untensioned reinforcement on Austrian bridges and concrete road surfacings, Betonwerk und Fertigteil-Technik, 51(11), 1985, p. 730-734. Mufti, A., Guidelines for structural health monitoring, ISIS Manual No. 2, 2001,
Norris, A., Saafi, M., Romine, P., Temperature and moisture monitoring in concrete structures using embedded nanotechnology/microelectromechanical systems (MEMS) sensors, Construction and Building Materials, 22, 2008, p. 111-120.
Pakzad, S.N., Fenves, G.L., Kim, S., Culler, D.E., Design and implementation of a scalable wireless sensor network for structural monitoring, Journal of Infrastructure Systems, ASCE, March 2008, p. 89-101.
Shiessl, P., Raupach, M, Influence of concrete composition and microclimate on the critical chloride content in concrete,” In: Corrosion of Reinforcement in Concrete, Ed.: C.L. Page, K.W.J. Treadaway, & P.B. Bamforth, Society of Chemical Industry, Elsevier Applied Science, London, England, 1990, p. 49-58.
Gagnon, M., Gaudreault, V., Overton D., Age of public infrastructure: A provincial perspective, Statistics Canada, Investment and Capital Stock Division, Ottawa, no. 11-621-MIE - No. 067, 2008.
Stratfull, R.F., Jurkovich, W.J., Spellman, D.L., Corrosion testing of bridge decks, Transportation Research Record, No. 539, 1975, p. 50-59.
Timoshenko, S.P., Strength of Materials. Part II: Advanced Theory and Problems, Princeton, NJ, 1956.
Tennyson, R.C., Mufti, A.A., Rizkalla, S., Tadros, G., Benmokrane, B., Structural health monitoring of innovative bridges in Canada with fiber optic sensors, Smart materials and Structures, 10, 2001, p. 560-573.
Tuutti, K., The effect of individual parameters on chloride induced corrosion, in Chloride Penetration into Concrete Structures, L.-O. Nilsson (ed.), Göteborg, Sweden, 1993, p. 18-25.
Vassie, P., Reinforcement corrosion and the durability of concrete bridges, Proc. Inst. Civil Engnrs, Part I, 76, 1984, p. 713-723.
Virmani, Y.P., Clemena, G.G. Corrosion protection – Concrete bridges,” Report No. FHWA-RD-98-088, Federal Highway Administration, Sept. 1998, 72 p.
West, R.E., Hime, W.G., Chloride profiles in salty concrete, Mater. Perf., 24(7), 1985, p. 29-36.
Weyers, R.E., “Service life model for concrete structure in chloride laden environments”, ACI materials journal, 95(4), July-August 1998, p. 445-453. FIGURES - Wireless sensor node A Ammbbiieenntt e exxcciittaattiioonn b byyttrraaffffiicc,, w wiinndd
Supernode
Automatic modal identification Life estimation Damage detection Reports, Alarmswind, etc.
Figure 1: Concept of structural health monitoring of concrete structures
325 mm 550 mm 890 mm Depths of ladder bars: 13 mm 25 mm 38 mm 50 mm Depth of main bars: 75 mm
Figure 2: Cross-section of reconstructed barrier wall (Vachon Bridge, Laval, QC)
10-year exposure to deicing salts
0 5 10 15 20 25 0 10 20 30 40 50 60 70 Depth (mm)
Total chloride content (kg/m
3 )
Apparent surface chloride content from field data
80 Field data of chloride content Best-fit of measured data Prediction (Dc from Boulfiza) Prediction using Dc & Cs from litterature Depth of main reinforcement (75 mm) Depth of test bars (13 mm) Depth of test bars (25 mm)
0 5 10 15 20 25 0 2 4 6 8 10 Time (years)
Apparent surface chloride content (kg/m
3 )
Max. apparent Cs
reached after 9 yrs
12 Estimated from field data
of Spans 12, 19 and 21 Best-fit low (KS) medium (FL) high (WV) severe (NY) Severity classification of corrosive environments (Weyers 1998)
Figure 4: Measured apparent surface chloride contents over 10 years
0.0 0.5 1.0 1.5 2.0 0 2 4 6 8 10 Time (years)
Apparent chloride diffusion coefficient (cm
2 /year)
Time-dependence best-fit
12 Estimated from field data
of Spans 12, 19 and 21
Not used for best-fit
0 5 10 15 20 25 0 25 50 75 Depth (mm)
Total chloride content (kg/m
3 ) Depth of main reinforcement 10-yr prediction based on Cs & Dc measured at 2 yrs 10-yr prediction based on Cs & Dc measured at 5 yrs
Profile obtained from field data measured at 10 yrs
100
Figure 6: Predictions of 10-year chloride profiles based on different measurement times
0 5 10 15 20 25 30 35 40 45 50 55 60 0 1 2 3 4 5 6 7 8 9 Chloride Threshold (kg/m3) Time (years) Corrosion initiation (from measured Dc & Cs)
Spalling (Icorr = 0.25 μA/cm 2
)
Spalling (Icorr = 0.50 μA/cm2)
(commonly used) 10 Cth = 0.9 kg/m 3 (ACI 2001) Cth = 1.8 kg/m3 (CEB 1992) Reinforcement at 75 mm Reinforcement at 25 mm Corrosion initiation Spalling (Icorr = 0.25 μA/cm2)
Spalling (Icorr = 0.50 μA/cm2)
Observations from field testing (at 10 yrs) at 75 mm: - no apparent corrosion; at 25 mm: - spalling not observed, - corrosion not severe.