Nanomedicine (Lond.) (Epub ahead of print) ISSN 1743-5889 part of Research Article 10.2217/nnm-2017-0158 © 2017 Future Medicine Ltd Nanomedicine (Lond.) Research Article 12 15 2017
Aim: Determination of the physicochemical parameters governing growth factors (GFs) adsorption and release from mesoporous calcium phosphate ceramics. Materials & methods: Six mesoporous calcium phosphate ceramics prepared by soft and hard templating were loaded with two different physiological concentrations of TGF-β1 or VEGF165 and their in vitro kinetics of adsorption/release were studied. Results: This low GF loading promotes adsorption on the highest binding sites. The usually encountered detrimental burst release is thus considerably reduced for samples prepared by hard-templating method. Conclusion: Our findings highlight that the strong affinity of GFs with the ceramic surfaces, demonstrated by a slow GFs release, is enhanced by the large surface area, confinement into mesopores of ceramics and high difference of surface charge between ceramic surfaces and GFs.
First draft submitted: 3 May 2017; Accepted for publication: 14 June 2017; Published online: 13 July 2017
Keywords: adsorption • bone regeneration • calcium phosphate • hard template • in vitro • mesopore • release • soft template • TGF • VEGF
Calcium phosphate (CaP)-based ceram-ics, especially like hydroxyapatite (HA), are widely used in bone regeneration due to their good biocompatibility and resorption capac-ity [1]. However, the performance of CaP as implants can be improved if they are com-bined with active molecules such as antibiot-ics or bioactive proteins [2]. The association of CaP and growth factors (GFs) is efficient for both in vitro and in vivo animal experi-ments [3,4]. Among GFs, the members of the TGF-β superfamily such as bone morpho-genetic proteins (BMP) have been most fre-quently used in bone tissue engineering [4,5]. Nevertheless, the range of GFs used alone and in various combinations for bone tis-sue engineering is extensive. These include BMP-2, BMP-4, BMP-7, FGF-2, TGF-β1, TGF-β2, TGF-β3, VEGF, IGF-1, PDGF and SDF-1 [4,6]. BMP-2 and BMP-7 clinical delivery systems for human applications are being currently used for osteoinduction;
how-ever, they are far from being satisfactory [7]. Indeed, like other GFs, BMPs are labile with a short half-life in vivo. Surface-deposited pro-teins from functionalized surfaces are released too rapidly, in a single high-dose burst [8], resulting in dramatic clinical complications like ectopic bone formation, abnormal stimu-lation of bone resorption, etc. [9]. In this work, we chose to focus on TGF-β1, a member of the TGF family, and VEGF. TGF-β1 is a multi-functional protein that has a pivotal role in bone remodeling as it has effects on both bone resorption and formation [10]. Even though VEGF is not directly related to bone regenera-tion, it still helps in stimulating angiogenesis and formation of new blood vessels or branch-ing from existbranch-ing vessels that are essential for bone formation [11]. It has also been shown to improve bone maturation when associated with bioactive glass carriers [12].
In previous studies, GFs were either com-bined with nonporous CaP surfaces or with
Physicochemical regulation of TGF and
VEGF delivery from mesoporous calcium
phosphate bone substitutes
Janina Möller-Siegert1,
Julien Parmentier1, Patrice
Laquerrière2, Ali Ouadi2,
Olivier Raisslé3, Edouard
Jallot4, Jean-Marie Nedelec3,
Cathie Vix-Guterl1 & Karine
Anselme*,1 1Institut de Science des Matériaux de Mulhouse (IS2M), Université de Strasbourg, Université de Haute Alsace, UMR CNRS 7361, F-68057 Mulhouse, France 2Université de Strasbourg, CNRS, IPHC UMR 7178, F-67000 Strasbourg, France 3Université Clermont Auvergne, CNRS, SIGMA Clermont, ICCF, F-63000 Clermont-Ferrand, France 4Université Clermont Auvergne, CNRS/ IN2P3, Laboratoire de Physique de Clermont, F-63000 Clermont-Ferrand, France *Author for correspondence: Tel.: +33 3 8960 8766 Fax: +33 3 8960 8799 [email protected]
macroporous scaffolds that featured pores of sev-eral hundred micrometers in diameter [13–18]. Com-posite scaffolds associating CaP and biodegradable polymers have also been used as a release carrier for GFs [19–24]. In this case, simple mixture, co-electro-spinning, double emulsion or covalent cross-linking methods were used to associate GFs with polymer and control GFs release with polymer degradation rate. However, on pure CaP materials the GFs are simply adsorbed onto scaffolds by impregnation from solution [14,15,18,20]. They are generally released by desorption followed by diffusion in the liquid media. A smarter release system was achieved by the encap-sulation of GFs into CaP through the co-precipita-tion method as proposed by Wernike et al. [13,25]. The authors encapsulated and released VEGF from CaP/ VEGF composites by comparing co-precipitated and impregnated samples. The co-precipitation improves the immobilization of the GF inside the CaP com-posite both in terms of adsorbed quantity and limited burst release [25].
Here, we chose a different method for the control of GF release from porous CaP using pore diameters close to the size of the GF molecules. The adsorp-tion of individual GF molecules by this method in each pore should then limit uncontrolled release of the biomolecules by desorption–diffusion and link the biomolecule release to in vivo dissolution of the CaP [18]. As most biomolecules have sizes above 2 nm, the mesopore range (pores size between 2 and 50 nm) is targeted for these porous materials. More-over, mesoporous materials are a promising and easier to use alternative as compared with co-precipitated HA/GF samples. The powders for these materials can be prepared in advance, calcined and stored without any precautions (no need for refrigeration or sterile conditions) and then sterilized before to be extempo-raneously impregnated with the GF solution during implantation. The interest of mesoporosity for con-trolling delivery of GFs has largely been demonstrated the last 10 years on silica- or bioactive glass-based materials [26–32]. Compared with silica-based materi-als, the development of mesoporous HA is much more recent and different preparation routes based on the use of soft or hard templates have been developed for the same purpose [14,33]. Poh et al. have recently taken advantage of this using a mesoporous HA material prepared by soft-templating for the controlled release of VEGF in in vitro experiments [14]. Nevertheless, comparison of results from literature on GFs suffers from limitation due to the use of different adsorp-tion and release protocols and sometimes incomplete description of the physicochemical characteristics of the tested materials. Moreover, there is a lack of
com-parative studies that focus on GFs adsorption/release properties on a panel of mesoporous HA ceramics and especially those that are prepared by hard-templating process. Thus, the key physical and chemical param-eters that govern the GF adsorption and release at the physiological low concentrations (μg/ml) could be examined to increase our understanding of GF release from mesoporous CaP and to improve the control of loading and releasing steps.
In this study, we investigated the adsorption and release of two GFs on a panel of six different meso-porous CaP ceramics having interparticle and intra-particle mesoporosity for one of them. We compared mesoporous CaP prepared using soft [14] or hard templates [33] or by co-precipitation method [25]. The versatile synthesis of mesoporous materials allowed us to prepare CaP ceramics with tunable physico-chemical properties such as pore diameter (mesopore range), composition (partly carbonate substituted HA) and crystallinity (low to high). All materials were impregnated with TGF-β1 and VEGF165. These GFs were chosen because of their good performance upon implantation when associated with CaP-based ceram-ics and their sizes (7 × 5 × 3 nm for TGF-β1 [34] and 10 × 6 × 3 nm for VEGF165) [35] that fit the porosi-ties of the tested mesoporous materials. The GFs were used at two different concentrations (1 μg/ml and 11 or 20 ng/ml). The high concentration was selected due to its good release in vitro [25]. The lower concentra-tion (ng/ml range) was chosen to fit more closely with very low-physiological GF concentration met in blood plasma (0.004–0.4 ng/ml and 15–40 ng/ml for VEGF and TGF, respectively) [36–41], in interstitial fluid (0.07 ng/ml for VEGF) [42] and in tissue (0.01 ng/mg of TGF in rat fracture callus) [43]. Appropriate analysis techniques such as specific antibody binding (ELISA) or liquid scintillation were used to determine the GF concentrations in the supernatant after adsorption or release. These data were cross-verified by quantifying the amounts of GFs remaining on the ceramic after its digestion in acid.
To our knowledge, this is the first study combining a panel of mesoporous CaP with different pore sizes, crystallinities and compositions prepared by three dif-ferent methods using two GFs at two difdif-ferent physio-logical concentrations. The parameters for a controlled in vitro delivery of GF up to 6 days are defined for six mesoporous CaP ceramics using established and cali-brated protocols. We propose that good GFs retention is due to their adsorption on the strongest binding energy sites of the ceramics. This behavior is believed to be promoted by the low surface coverage of GFs on mate-rials, possible confinement of GFs in the mesopores and high surface charge of the ceramics.
10.2217/nnm-2017-0158 www.futuremedicine.com
future science group
Physicochemical regulation of TGF & VEGF delivery from mesoporous calcium phosphate bone substitutes Research Article
Materials & methods
Material synthesis & characterization
Six different CaP ceramics were synthesized using co-precipitation, soft- and hard-templating methods. Samples A and B were obtained by co-precipitation starting from calcium hydroxide and ammonium dihy-drogen phosphate precursor solutions as described pre-viously [44]. Sample A was freeze-dried before calcina-tion at 650°C, and sample B was dried in air at 100°C before calcination at the same temperature. Sample C was obtained using the soft-templating approach with calcium pantothenate containing dipotassium hydrogen phosphate solutions in the presence of a soft template, which was the nonionic surfactant denoted Pluronic F127 (PEO106PPO70PEO106) [45]. The result-ing solid was calcined at 300°C for 12 h. The synthesis of the ceramic samples D, E and F was obtained using the hard-templating route that has been described pre-viously [33]. Briefly, samples D, E and F were obtained from a sol made from calcium nitrate and triethyl phosphite, which was gelified in the presence of meso-porous solids used as hard templates. Samples D and E were synthesized in mesocellular silica foam. In con-trast to sample D which was only dried at 80°C, sam-ple E was calcined at 500°C before the silica template was removed by NaOH leaching. Sample F was pre-pared in the presence of a mesoporous carbon replica derived from the carbon chemical vapor infiltration of silica foam. The carbon was introduced into the foam by chemical vapor deposition of propylene. The silica template was etched with hydrofluoric acid to isolate the carbon that was further used as template. After filling it with HA precursors, the carbon template was removed by oxidation in air at 500°C.
The zeta potential of the six ceramics was measured after soaking the ceramics in water or in a liquid simu-lating the composition of body fluid by using DMEM, which is a cell culture medium containing salts, vitamins, glucose and amino acids.
The XRD diffraction patterns of ceramics were recorded on a X’pert MPD (PANalytical S.A.S., Limeil-Brevannes, France) using Cu kα-radiation (l = 1.5406 Å).
Macro- and mesoporosity of the samples were inves-tigated by mercury intrusion porosimetry technique using the Autopore IV from Micromeritics (GA, USA). This technique is well adapted for this pore size range and is based on the progressive mercury intrusion into the material pores under controlled pressure. With the assumption that the pores are cylindrical, the applied pressure can be converted into the pore diameter by using the Washburn equation:
p= 2s q ,- cos /r
where P is the pressure required to force mercury into a pore of radius r, γ is the surface tension of mercury and θ is the contact angle between mercury and the pore walls.
Specific surface areas and mesopore volumes were determined by N2 physisorption technique (77 K) using the Brunauer–Emmett–Teller (BET) and Barrett-Joyner-Halenda (BJH) methods (desorption isotherm), respectively. Surface area was calculated assuming a cylindrical pore shape.
Transmission electron microscopy (TEM) was car-ried out on a Philips CM200 (Philips, Eindhoven, The Netherlands) with an acceleration voltage of 20 kV. Samples were prepared by dispersing the powder in chloroform using sonication, putting a drop of the dis-persion onto an observation grid and drying at room temperature.
Protein adsorption & release
Model proteins such as bovine serum albumin, lyso-zyme or cytochrome C are generally used in rela-tively high concentration to determine adsorption isotherms and to evaluate release properties of HA ceramics. Considering the expensiveness and low-physiological concentration of GFs (ng/ml to μg/ml range), no adsorption study at high concentration was performed here. The amount of GFs adsorbed by the ceramics was calculated by the difference of protein concentration in the supernatant solution. We used different concentrations of each GF that were denoted hereafter as high (1 μg/ml for both GFs) and low (0.011 μg/ml for VEGF165 and 0.02 μg/ml for TGF-β1) concentrations.
High-concentration experiments with detection by ELISA
Adsorption
All experiments were performed under sterile condi-tions. The ceramics were dry sterilized at 130°C for 90 min. The proteins were purchased from PeproTech (Neuilly-Sur-Seine, France) and were used as soon as they were received. The GFs were reconstituted in 10 mM citric acid solution (pH 3.9) or distilled water (pH 6) for TGF-β1 and VEGF165, respectively. The protein aliquots were stored at -20°C. The pro-teins were thawed at room temperature and diluted in water (VEGF) or citric acid (TGF) to a working con-centration of 1 μg/ml. The ceramic powder samples had masses between 9 and 11 mg and were put into 1.5 ml microtubes. After that, 300 μl of protein solu-tion was added to each sample followed by shaking at room temperature at 90 r.p.m. using a tumbling shaker. After the desired time period, the tubes were centrifuged and the supernatant was carefully retrieved
using a micropipette. Two samples were used at every time point. The protein concentration was determined with sandwich ELISA kits obtained from R&D Sys-tems (Lille, France). The instructions provided by the manufacturer were used for each kit. Each experiment was performed in duplicate. If all of the protein in the solution is adsorbed, then the maximal GF loading concentration corresponds to approximately 33 μg/g of ceramic.
Release
For the GF release experiments, the adsorption was performed priorly for 24 h at room temperature as described before. For each GF-adsorbed powder, two tubes (10 ± 1 mg) were put in contact with a DMEM without phenol red solution (300 μl) for different times (0 [referred as washout], 1, 2, 3 days [and 4 days for TGF]) and agitated on a tumbling shaker at 90 r.p.m. at 24°C. After the desired time period, the two tubes were centrifuged at 1200 r.p.m. for 5 min. The super-natant was retrieved using a micropipette and frozen until use in the ELISA assay. Therefore, for high GF concentrations, the percentage of release was drawn for each time point and curve lines were plotted to guide the eye.
Low-concentration experiments with radio-labeled GFs & detection by liquid scintillation To evaluate the release of GFs at low concentrations, the adsorption experiments were conducted as described before but using 125I-labeled GFs instead. The pro-teins were purchased from PerkinElmer (Courtaboeuf, France) with an activity of 185 kBq and stabilized with 0.25% of bovine serum albumin. The proteins were diluted to 2 ml with distilled water (VEGF) or citric acid (TGF) to working concentrations of 0.011 μg/ml (VEGF) and 0.02 μg/ml (TGF), respectively. For the release experiments, a different procedure than previ-ously described for high concentration was used. Only two samples for each powder were adsorbed with radio-active VEGF and TGF during 20 h (10 mg of HA for 300 μl of solution at 0.011 and 0.02 μg/ml for VEGF and TGF, respectively). These samples were centri-fuged to remove the GF solution. Then, the powders were washed with 300 μl of fresh DMEM and cen-trifuged immediately. The supernatant was retrieved for radioactivity measurement. This supernatant will be referred to as ‘washout’ or time 0. Desorptions from these loaded samples were measured successively after different contact times (4 h, 1, 2, 3 and 6 days) in DMEM. With this aim, aliquots of 10 μl were taken from the supernatant solutions and mixed with 9 ml of Ultima Gold AB scintillation cocktail (Perkin-Elmer, Courtaboeuf, France). The concentration was
calcu-lated by referring to the activity of the stock solution and by correcting it for radioactive decay. Therefore, true cumulative release curves could be drawn for low GF concentrations.
Validation of the procedure
The amount of GF absorbed (μg of GF/g of ceramic) on the six different powders at the end of the release experiments was measured and compared with the val-ues determined from the supernatants. The powders were first separated from the supernatant and allowed to dry in ambient air for several days. Then, they were transferred into new tubes to separate powders from proteins that might have attached to the tube wall. Then, the powders were dissolved in 200 μl of 4 M HCl. The scintillation liquid was directly added to the solutions and measured. The concentration was calculated after correction for decay by referring to the initial activity of the protein (as indicated by the manufacturer). These additional tests were conducted with a selection of samples (A, B and D), and TGF-β1 was used at an initial concentration of 0.02 μg/ml. We found that the values of the GF amount still adsorbed after 6 days agreed reasonably well with the calculated values from the supernatants. The differences were less than 20%, which suggested accuracy of the measure-ments when considering the extremely low concen-tration and numerous manipulation steps. This also confirmed that the fraction of GFs adsorbed on the container walls during experiments could be neglected. Results
Physicochemical characteristics of the ceramic samples
The ceramics were characterized by different tech-niques, and the results are shown in Table 1. All ceram-ics composed of HA are shown by x-ray diffraction (Supplementary Figure 1 in supporting information part). Due to the synthesis conditions performed in air without CO2 removal, carbonate species were also detected by infrared (IR) spectroscopy (Supplementary Figure 2), suggesting that the HA samples are partly substituted with carbonate species. Moreover, when carbon templates were used, the calcination in air led to a CO2-rich atmosphere that promoted the formation of carbonate as evidenced on the XRD pattern of sam-ple F, which showed the presence of minor amounts of CaCO3. The HA crystallinity is related mainly to the calcination temperature, with the lowest long-range ordering for sample D prepared at room temperature.
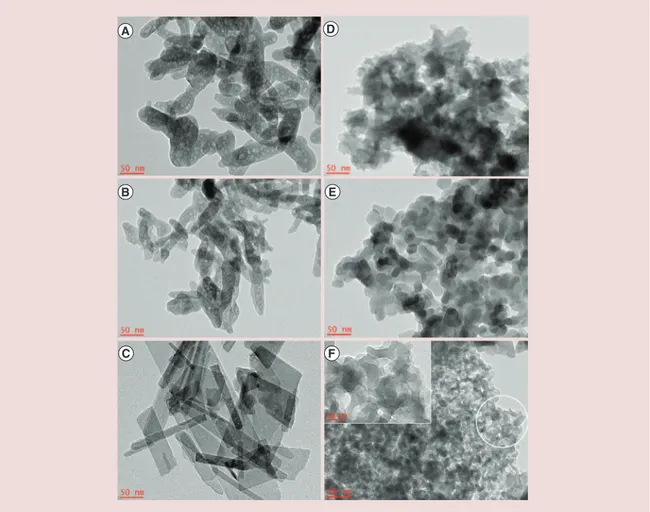
TEM observations evidenced the nanostructure nature of CaP crystallites with at least one dimension in the range 20–60 nm (Figure 1), revealing different morphologies related to the synthesis conditions. We
10.2217/nnm-2017-0158 www.futuremedicine.com
future science group
Physicochemical regulation of TGF & VEGF delivery from mesoporous calcium phosphate bone substitutes Research Article
Ta b le 1 . P h ys ic al p ro p er ti es o f t h e m es o p o ro u s c er am ic s u se d f o r t hi s s tu d y. C er am ic (pr o ce ss ) C al cin at io n te m p er at ur e (°C ) SBET 2(m /g ) M eso p or e vo lu m e † (cm 3/g ) M eso p or e di am ete r ‡ (n m) M eso p or e vo lu m e § (cm 3/g ) Ma in me so -ma cr o p or e di am ete rs § (n m) Sur fa ce ar ea (m 2/g ) § C ry st alli n it y ¶ C ry st allit e si ze (n m) †† ζ -p ote n ti al in w at er /in D M EM ‡‡ ( mV ) A (co -p re ci p it ati o n – fr ee ze -d ry in g ) 65 0 43 0.1 9 0.1 4 75 –2 0 0 39 Go o d 10 0* 20 -1 3. 6 /-4 .1 B (co -p re ci p it ati o n – d ry in g ) 65 0 63 0. 2 16 0. 30 38 49 Go o d 10 0* 20 -5 .5 /-1 .8 C (sof t te m p la tin g ) 30 0 16 6 0. 5 17 0. 23 55 –6 50 0 74 Med iu m 20 0* 50 -8 .6 /n .p . § § D (har d t em p la ti n g Si O2 ) N o ne 90 0. 4 14 0. 25 20 –5 4 0 0 50 Ba d 20 –3 0 -1 5. 3 /-6. 2 E (har d t em p la ti n g Si O2 ) 50 0 22 0.1 17 n.p n.p n.p Go o d 4 0 –60 -2 3. 3 /-6.7 F (har d t em p la ti n g C ) 50 0 31 0.1 12 0.1 6 35 –5 3, 000 39 Go o d # 30 –7 0 -1 4 .0 /-1 0. 7 †D et er m in ed b y th e N2 a d so rp ti o n at 7 7 K . ‡D et er m in ed b y th e B JH m et h o d. §D et er m in ed b y H g p o ro si m et ry . ¶M ai nl y H A p ha se . #Pr es en ce o f tr ac es o f C aC O3. ††D et er m in ed f ro m T EM . ‡‡D M EM is a c el l c u lt u re m ed iu m c o nt ai ni n g sa lt s (in cl u d in g 0. 4 4 m g /m l c al ci u m s al ts a n d 0. 1 m g /m l o f so d iu m p h o sp ha te ), v it am in s, g lu co se a n d am in o ac id s. §§Th e su rf ac e ch ar g e of t hi s sa m p le w as c lo se t o 0 ; t h e p o w d er a g g lo m er at ed a n d th e va lu e co u ld n ot b e d et er m in ed p re ci se ly . B JH : B ar re tt -J o yn er -H al en d a; H A : H yd ro xy ap at it e; n .p .: N ot p er fo rm ed ; T EM : T ra ns m is si o n el ec tr o n m ic ro sc o py .
Figure 1. Transmission electronic microscopy micrographs of hydroxyapatite samples. The insert in the image F corresponds to the encircled portion and highlights the typical mesofoam morphology of sample F.
Figure 2. Cumulative pore volume and differential intrusion versus mean diameter pore size obtained by mercury intrusion porosimetry for samples A, B, C, D and F (see facing page).
found elongated or flat particles after synthesis by clas-sical co-precipitation or with soft template (samples A, B and C) and rather spherical particles for synthesis using mesoporous foam as hard templates (samples D, E and F). It is worth noting that only sample F obtained from the repeated nanocasting process [33] displayed typical mesoporous foam morphology. On the contrary, samples D and E showed a ‘negative’ replicated structure of the initial silica foam.
Mercury porosimetry curves of all samples displayed one or two upward swings which could be attributed to interagglomerate porosity for large pore size values (5–6 μm) and to interparticular porosity in the large mesopore – small macropore range (20–200 nm) owing to the nanostructuration of the CaP particles (Figure 2). The data corresponding to the main pore sizes, mesopore volumes and surface areas (assum-ing a cylindrical pore shape) calculated from mercury porosimetry curves are reported in Table 1.
N2 adsorption/desorption at 77 K displayed a type IV isotherms as previously published [33] confirming the large mesoporous character of all samples and their high specific surface areas (SBET) related to the small particle size of CaP samples (Table 1). Even if discrep-ancies between N2 physisorption and Hg-porosimetry can be noticed regarding surface areas due to differ-ent calculation methods, the same trend is observed with the highest surface area for sample C, followed by D and B and then A, E and F. Regarding mesopore size and volume, Hg-porosimetry is more reliable since nitrogen adsorption is not accurate for such large mes-opore size displayed by all samples. We can note here that mesopore diameter fits well with GFs size consid-ering that only some molecules could be confined into each mesopore.
Because these GFs were adsorbed/released in solu-tion, zeta potentials for ceramic samples were mea-sured in water and DMEM. The negative values were
3 2 1 0 0.1 0.01 0.001 0.0001 1e-05 1e-06 1e-07 10 100 1000 1e+04 1e+05 1e+06
Cumulative pore volume (ml/g)
Differential intrusion (ml/g/nm ) Mean diameter (nm) 1 100 1000 1e+04 1e+05 1e+06 Mean diameter (nm) 10 0 3 2 1 0.01 0.001 0.0001 1e-05 1e-06 1e-07
Cumulative pore volume (ml/g)
Differential intrusion (ml/g/nm ) 0.0 1 100 1000 1e+04 1e+05 1e+06 Mean diameter (nm) 10 6 5 4 0 0.01 0.001 0.0001 1e-05 1e-06 1e-07 1 100 1000 1e+04 1e+05 1e+06
Cumulative pore volume (ml/g)
Differential intrusion (ml/g/nm ) Mean diameter (nm) 3 2 1 10 2.5 2.0 1.5 0.01 0.001 0.0001 1e-05 1e-06 1e-07
Cumulative pore volume (ml/g)
Differential intrusion (ml/g/nm ) 0.5 1.0 2.0 1.5 1.0 0.0 0.1 0.01 0.001 0.0001 1e-05 1e-06 1e-07 1 100 1000 1e+04 1e+05 1e+06
Cumulative pore volume (ml/g)
Differential intrusion (ml/g/nm ) Mean diameter (nm) 1.0 0.5 10
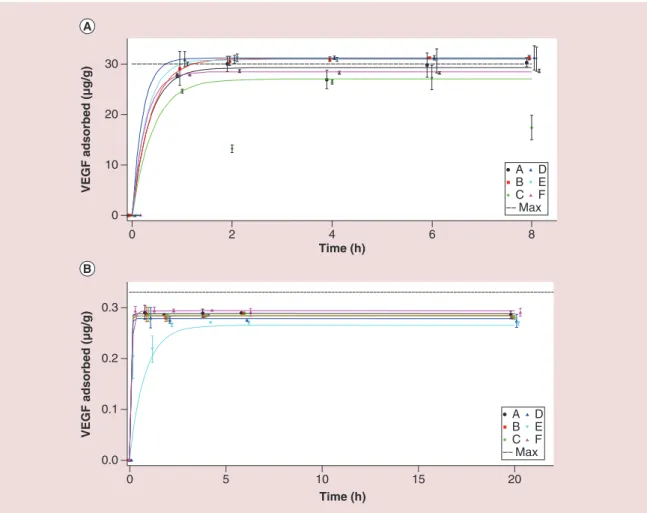
Figure 3. Adsorption kinetics of VEGF. (A) High initial concentration (1 μg/ml) and (B) low concentration (0.011 μg/ml). The represented values were averaged over the different measurements and vertical bars represent the corresponding standard deviations. The horizontal dotted lines represent the maximum possible amount adsorbed. For sake of clarity, experimental values were spread around the different times of adsorption (0, 1, 2, 4, 6 and 20 h). Curve lines were plotted to guide the eye using the following function f(t) = a*(1-exp(-b*t)) with a and b constants and t for the time.
0 10 20 30 0 2 4 6 8 VEGF adsorbed (μg/g) 0.0 0.1 0.2 0.3 VEGF adsorbed (μg/g) A B C D E F Max Time (h) 0 5 10 15 20 Time (h) A B C D E F Max
in agreement with the literature [46] and indicate that the IEPs of the HA samples were below the pH of the solutions, which were 6 and 7.4 for water and DMEM solutions, respectively.
The three lowest zeta potentials were observed for samples F, D and E, which also displayed the high-est dissolution (Table 1). The slight increase in the zeta potential in DMEM compared with water was related to the higher ionic strength of the solution and the associated screening on the double layer.
Adsorption kinetics
Figures 3 & 4 show the adsorption kinetics of the differ-ent ceramics in contact with VEGF and TGF for high- (A) and low- (B) concentrated GF solutions. It is worth noting that the use of very low concentrations (up to 1 μg/ml) and the high surface area of the materials led to adsorption with a low surface coverage. A simple calcu-lation based on the specific surface of the GF and the
porous characteristics of the powders determined by nitrogen physisorption (77 K) shows that 2 and 10% of the surface area and mesopore volume, respectively, are occupied by the adsorbed GFs at the highest initial concentration. Therefore, surface areas and pore vol-umes are not limiting factors for the adsorption since both are in a large excess. As the graphics show, the GFs adsorb relatively quickly onto the ceramics and the adsorption equilibrium is reached for most of the samples after 6 h of contact time with the GF solu-tions. Supplementary Table 1 shows the amount of TGF and VEGF adsorbed by the different ceramics at the equilibrium after 8 h (high GF loading) and 20 h (low GF loading) of contact with the solutions.
In the case of VEGF (Figure 3), all samples show the same performance because they quickly adsorb (1 h) more than 80% of the VEGF present in the solu-tion. In the case of TGF (Figure 4), there are differ-ent adsorption profiles between the powders and also
10.2217/nnm-2017-0158 www.futuremedicine.com
Figure 4. Adsorption kinetics of TGF. (A) High initial concentration (1 μg/ml) and (B) low concentration (0.02 μg/ml). The represented values were averaged over the different measurements and vertical bars represent the corresponding standard deviations. The horizontal dotted lines represent the maximum possible amount adsorbed. For sake of clarity, experimental values were spread around the different times of adsorption (0, 1, 2, 4, 6 and 20 h). Curve lines were plotted to guide the eye using the following function f(t) = a*(1-exp(-b*t)) with a and b constants and t for the time.
0 10 20 30 Time (h) TGF adsorbed (µg/g) 2 0 4 6 8 0.0 0.2 0.5 0.6 Time (h) TGF adsorbed (µg/g) 5 0 10 15 0.4 0.3 0.1 20 A B C D E F Max A B C D E F Max
future science group
Physicochemical regulation of TGF & VEGF delivery from mesoporous calcium phosphate bone substitutes Research Article
between the two loading conditions. Moreover, the fractions of TGF adsorbed at the equilibrium are gen-erally lower than those of VEGF and range from 55 to 92% (Supplementary Table 1). These features suggest that TGF has a slightly lower affinity for the ceram-ics than VEGF and also a lower kinetceram-ics of adsorption (equilibration time of 6 h instead of 1 h).
Release kinetics
The burst release must be limited to avoid undesired effects of excessively high GF concentrations at the implantation site. Therefore, the release kinetics of the GFs from the ceramics immersed in culture medium were measured and reported in Figures 5 & 6 for VEGF and TGF, respectively. To compare the results with burst and long-term releases presented in the literature, the amounts of GF released within the first 4 and 24 h of exposure of the loaded ceramics and at the end of the experiments (3 and 6 days according the GF
concen-trations) are reported in Supplementary Tables 2 & 3, respectively. These measurements show slow release kinetics over a long period of time (6 days) with the absence of significant burst release. The main portion of GFs remains on the ceramic after prolonged expo-sure. Minor variations between VEGF and TGF are discussed below.
Release of VEGF
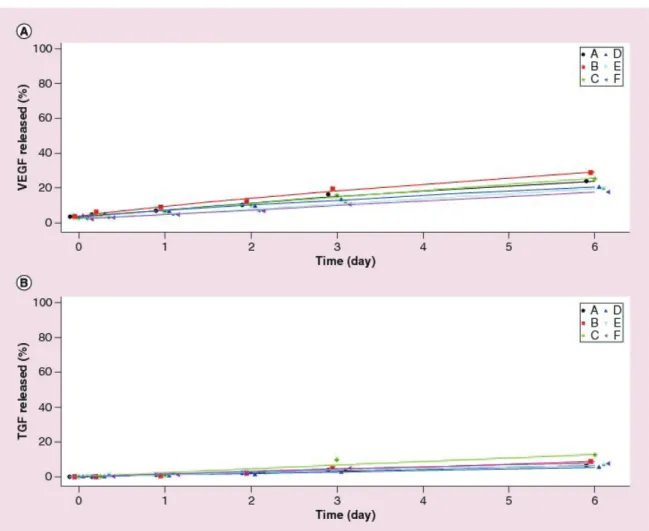
For high-concentration VEGF loads, samples D, E and F show nearly no release after 3 days while sample C show a slightly higher release. Samples A and B show the highest release but still retain at least 64% of the initial load after 1 day (Figure 5, & Supplementary Tables 2 & 3). The cumulative release profiles from the different sam-ples for lower concentration loads are very similar showing low and linear increase (Figure 6). All samples retain more than 70% of the initial loading after 6 days (Supplementary Table 3).
Figure 5. Cumulative release profiles into culture medium for TGF and VEGF adsorbed at high-initial concentration (1 μg/ml). The represented values were averaged over the different measurements and vertical bars represent the corresponding standard deviations. For sake of clarity, experimental values were spread around the different times of desorption (0, 1, 2, 3 and 4 days). Curves lines were plotted to guide the eye using the following function f(t) = a*(1-exp(-b*t)) with a and b constants and t for the time.
0 20 40 60 80 100 VEGF released (%) 0.0 0.5 1.0 1.5 2.0 2.5 3.0 Time (day) 0 20 40 60 80 100 TGF released (%) A B C D E F 0 1 2 3 4 Time (day) A B C D E F Release of TGF
For high-concentration TGF loads (Figure 5, & Supple-mentary Tables 2 & 3), more differences between the ceramics were observed with a higher release (0–57%) after 3 days. It was previously shown by adsorption that TGF exhibits lower affinity toward ceramic sur-faces than VEGF probably because of the low pH of the citrate buffer used to dilute TGF. This finding could explain the enhanced release of TGF as both releases were performed at the same pH (∼7.4). For low-concentration loads, the cumulative release profiles are similar for all samples (Figure 6 & Supplementary Table 3).
Discussion Adsorption
We established a ranking between our ceramic samples to investigate the parameters governing the adsorp-tion and release properties of both GFs with different
ceramics. This ranking was derived from data reported in Supplementary Tables 1–3 and can be found in Table 2. The samples that adsorbed the highest amount or released the least amount of GFs were ranked first. We differentiated between burst release during the first day and total release during the whole experimental period.
Our study used similar conditions as those described in the article of Wernike et al. (same growth factor [VEGF] and concentration) [13]. All ceramics that we have tested, except sample C, showed higher relative VEGF adsorption compared with literature. The rela-tive adsorbed amount reached values between 96 and 100%. Our samples adsorbed more than double the amount of VEGF measured by Wernicke et al. (>30 μg/g instead of 14 μg/g). We believe that this differ-ence is due to the high surface area of our samples and their mesopore diameter that fits well with GF size. Indeed, Wernike et al. [13] did not comment on the
10.2217/nnm-2017-0158 www.futuremedicine.com
Figure 6. Cumulative release profiles into culture medium for TGF and VEGF adsorbed at low-initial concentration, respectively, 0.02 and 0.011 μg/ml.The represented values were averaged over the measurements performed on two samples and vertical bars represent the corresponding range of variation. For sake of clarity, experimental values were spread around the different times of desorption (0, 1, 2, 3 and 6 days). Curves lines were plotted to guide the eye using the following function f(t) = a*(1-exp(-b*t)) + c with a, b and c constants and t for the time.
future science group
Physicochemical regulation of TGF & VEGF delivery from mesoporous calcium phosphate bone substitutes Research Article
mesoporosity of their samples. However, we can rea-sonably assume that the ceramics used in their experi-ments do not exhibit any porosity in the nanoscale as no templates were used during the synthesis. The existing macroscale porosity (150–200 μm) is appro-priate to support cell growth but does not improve the adsorption of GFs.
We have observed a slightly lower affinity of TGF to ceramics than VEGF. Both GFs have similar iso-electric point (IEP) values of 9, and it is proposed that these different behaviors are related to the pH and ionic strength differences of the GFs solutions used for adsorption experiments. It is well known that adsorp-tion of proteins (e.g., GFs) on HA is mainly based on electrostatic interaction between oppositely charged species [47]. Thus, the adsorption strength increases with the difference in charge between both species. Interactions occur here between positively charged
GFs (pH < IEP) and negatively charged HA samples (see ζ – potential values in Table 1). These negative ζ values were shifted toward zero by decreasing the pH (protonation of the surface) and/or by increasing the ionic strength (e.g., comparison of values measured in water and DMEM in Table 1). Therefore, the experi-mental conditions used for TGF (low pH [=3.9] with high-ionic strength [addition of citric acid]) lead to lower electrostatic interactions and lower adsorption strength than VEGF (high pH [=6] with low-ionic strength [distilled water]).
Moreover, due to the heterogeneous energetic char-acter of the surface and because GF-loading experi-ments are performed at low surface coverage (around 2% of the surface, below 10% of the mesopore volume, as mentioned previously), adsorption is supposed to occur preferentially on localized adsorption sites with the highest adsorption energies. Since adsorption takes
place far from saturation, discrimination of samples, usually based on the adsorption capacity at saturation, is more difficult. Thus, the adsorption of GFs in our experiment is probably governed by a combination of factors (surface charge, degree of crystallinity, surface chemistry, pore size and morphology) that determines the population and energy distribution of adsorption sites. Even if it is not undoubtly straightforward to identify the key parameters for the adsorption of GFs at physiological loading, it appears in this study by com-paring the different samples displaying all relatively high surface area and mesopores that one predominant parameter is the surface charge of the HA ceramics. Release
About GFs release, our HA samples display similar or enhanced properties for short- and long-term experi-ments compared with previous studies. For burst release within 24 h, the release ranges from 0 to 43% of the initial loading (Supplementary Table 2) with almost no detected release of VEGF at high loading from samples C, D, E and F. Wernike et al. observed a release of 28% of VEGF for their best sample obtained by the HA/VEGF co-precipitation tech-nique (for a similar concentration of 1 μg/ml) [13].
Similarly, Poh et al. obtained a release of 15% of VEGF after 1 day using a mesoporous HA prepared by soft-templating without calcination [14]. We did not observe any release after 1 day with sample C prepared by the same method but with calcination at 300°C (Supplementary Table 2).
From Table 2, we concluded that samples D, E and F are the most promising carriers for both GFs. All three samples were prepared by hard templating and were synthesized from the same precursors. The TEM experiments showed that they all display spheri-cal particles with a peculiar mesofoam morphology for the sample F. All three samples are well adapted for enhanced adsorption due to the confinement effect of the GFs within the inter- and intraparticular mesoporosity.
Moreover, these morphological features could act together with the averaged surface charge since the samples prepared by hard templating also display the most negative ζ-potentials in DMEM (Table 1). There-fore, they develop the strongest magnitude of electro-static interactions between the positively charged GFs (having similar IEP values) and the negatively charged ceramic surfaces. These properties lead to a limited initial burst release and long-term release (3–6 days) Table 2. Ranking of the different ceramics by adsorption and retention potentials using data from Supplementary Tables 1–3.
GF TGF TGF VEGF VEGF Average
Initial concentration (μg/ml) 1.0 0.02 1.0 0.011 Adsorption A 2 4 1 1 1 B 3 6 1 3 4 C 1 3 6 3 4 D 3 2 1 6 2 E 6 4 1 6 6 F 5 1 5 1 2 Release
Total Burst Total Burst Total Burst Total Burst
A 6 4 1 2 6 6 4 5 5 B 4 3 4 2 5 6 6 6 6 C 2 6 6 2 4 1 5 3 4 D 3 5 1 1 1 1 3 3 1 E 5 n.d. 2 6 1 1 2 1 3 F 1 1 3 5 1 2 1 1 1 During adsorption, the sample adsorbing the most growth factor is noted 1, the second best is noted 2, etc. For release experiments, the sample with the lowest release was ranked 1. Burst release values were measured after soaking the loading samples during 1 day while total release values were measured after soaking the loading samples for 3 or 6 days.
10.2217/nnm-2017-0158 www.futuremedicine.com
future science group
Physicochemical regulation of TGF & VEGF delivery from mesoporous calcium phosphate bone substitutes Research Article
for these materials. This feature was also observed after immobilizing biomolecules such as amino acids, carboxylic acid or biphosphonates on CaP materials to provide stronger electrostatic interactions between proteins and CaP [47]. For example, the group of Rohanizadeh after functionalizing HA with differ-ent amino acids demonstrated a higher adsorption of the lysozyme, a basic protein like TGF and VEGF, on HA particles coated with aspartic acid (Asp-HA) [48]. This could be explained in terms of favorable elec-trostatic interactions since under physiological con-ditions (pH = 7.4), lysozyme was positively charged while Asp-HA was negatively charged because of the enhanced negative charge sites (PO43- and additional two COO- groups) [48]. Nevertheless, due to the com-plexity of the GFs/HA system, it is difficult to associ-ate the adsorption/retention properties with only one physical–chemical property such as the average sur-face charge. As already discussed, all tested ceramics display extremely low surface coverage by GF (below 2%), and due to the inhomogeneous energetic nature of the surfaces, the adsorption of the GFs could
prefer-entially take place on the strongest and localized bind-ing sites of the ceramic. All of these effects reinforce the binding strength of GFs with the ceramic surfaces and could explain the limited GF release observed for our samples.
Conclusion & future perspective
A panel of CaP ceramics obtained by soft/hard tem-plating and coprecipitation processes were tested for the adsorption and delivery of two GFs (TGF and VEGF). These templating processes lead to nanostruc-tured ceramics with high specific surface area (up to 166 m2/g) and inter- and intraparticular mesoporos-ity. Low GF loading was targeted to fit with physi-ologically compatible concentrations and to limit side effects due to burst release like the ones described with BMPs. Since 58 up to 100% of GF of the initial solu-tion (1 μg/ml) were loaded on CaP surface after 6 h, adsorption may be considered as strong. It is proposed that the strong GF affinity for the CaP ceramic sur-face is related to the low loading of the GFs, which promotes the GF adsorption onto the sites having the Summary points
Background
• The performance of calcium phosphate (CaP) implants can be improved if they are associated with active molecules such as growth factors (GFs). Generally, GFs are simply adsorbed onto CaP scaffolds and released by desorption. A smarter release system must be developed.
• The interest of mesoporosity for controlling delivery of GFs has largely been demonstrated during the last 10 years on silica- or bioactive glass-based materials. This has not been yet explored on mesoporous CaPs, specifically those prepared by hard templating.
• The key physical and chemical parameters that govern adsorption and release from mesoporous CaP of low GF concentrations (μg/ml) have not been explored yet.
Materials & methods
• A panel of six different mesoporous CaP ceramics presenting interparticles mesoporosity was synthesized by co-precipitation, soft-templating and hard-templating method. One of them exhibited both inter- and intraparticles mesoporosity.
• TGF-β1 and VEGF165 were adsorbed at two different concentrations (≤1 μg/ml) and appropriate analysis
techniques such as specific antibody binding (ELISA) or liquid scintillation were used to determine the GF concentrations in the supernatant after adsorption or release.
Results
• A strong GF affinity for the CaP ceramic surface was observed. It was related to the lower loading concentration, which promoted the GF adsorption onto the adsorption sites having the strongest binding energy.
• The detrimental burst release that is usually encountered within the first hours of exposure to culture medium was found to be considerably lower for some of the tested samples. From 0 to 50% of the initial GF loading was released after 3 to 6 days in culture medium.
Discussion/conclusion
• It is proposed that the strong GF affinity for the CaP ceramic surface is explained by both the high difference in charge between the negatively charged ceramic surface and the positively charged GF and the confinement within the mesopores, which further enhances the binding energy, especially for sample F with its unique mesofoam morphology.
Future perspective
• Our findings suggest a possible control of both TGF and VEGF release by combining ceramic substrates loaded with TGF or VEGF in different proportions. The combined delivery of osteogenic and angiogenic factors is effectively a promising approach in bone regenerative engineering.
strongest binding energy because of the high differ-ence in charge between the negatively charged ceramic surface and the positively charged GF, especially for VEGF compared with TGF and the confinement within the mesopores, which further enhances the binding energy, especially for sample F with its unique mesofoam morphology.
This finding suggests a possible control of both TGF and VEGF release by combining ceramic substrates loaded with TGF or VEGF in different proportions. The combined delivery of osteogenic and angiogenic factors is effectively a promising approach in bone regenerative engineering [49,50]. Finally, the complete release of the remaining GFs will then occur only when the ceramics are dissolved in the patient’s body. The coupling of the dissolution of the ceramic upon implantation with the release of the GFs is an
impor-tant step forward for bone regenerating systems with optimized release control.
Supplementary data
To view the supplementary data that accompany this paper please visit the journal website at: www.futuremedicine.com/ doi/full/10.2217/nnm-2017-0158
Financial & competing interests disclosure
The authors have no relevant affiliations or financial involve-ment with any organization or entity with a financial interest in or financial conflict with the subject matter or materials discussed in the manuscript. This includes employment, con- sultancies, honoraria, stock ownership or options, expert tes-timony, grants or patents received or pending, or royalties. No writing assistance was utilized in the production of this manuscript. References
Papers of special note have been highlighted as: • of interest; •• of considerable interest
1 Dorozhkin SV. Calcium orthophosphate bioceramics. Ceram. Int. 41, 13913–13966 (2015).
2 Arcos D, Vallet-Regi M. Bioceramics for drug delivery. Acta Mater. 61(3), 890–911 (2013).
3 Bose S, Tarafder S. Calcium phosphate ceramic systems in growth factor and drug delivery for bone tissue engineering: a review. Acta Biomater. 8(4), 1401–1421 (2012).
4 Gothard D, Smith EL, Kanczler JM et al. Tissue engineered bone using select growth factors: a comprehensive review of animal studies and clinical translation studies in man. Eur. Cell. Mater. 28, 166–207 (2014).
5 Katagiri T, Watabe T. Bone morphogenetic proteins. Cold Spring Harb. Perspect. Biol. 8(6), a021899 (2016).
6 Samorezov JE, Alsberg E. Spatial regulation of controlled bioactive factor delivery for bone tissue engineering. Adv. Drug Deliv. Rev. 84, 45–67 (2015).
7 Carreira AC, Lojudice FH, Halcsik E et al. Bone morphogenetic proteins: facts, challenges, and future perspectives. J. Dent. Res. 93(4), 335–345 (2014). 8 Migliorini E, Valat A, Picart C, Cavalcanti-Adam
EA. Tuning cellular responses to BMP-2 with
material surfaces. Cytokine Growth Factor Rev. 27, 43–54 (2016).
9 James AW, LaChaud G, Shen J et al. A review of the clinical side effects of bone morphogenetic protein-2. Tissue Eng. Part B Rev. 22(4), 284–297 (2016).
• Recently updated review of dramatic clinical complications due to burst release of BMP-2.
10 Morikawa M, Derynck R, Miyazono K. TGF-beta and the TGF-beta family: context-dependent roles in cell and tissue physiology. Cold Spring Harb. Perspect. Biol. 8(5), pii: a021873 (2016) (Epub ahead of print).
11 Stegen S, van GN, Carmeliet G. Bringing new life to damaged bone: the importance of angiogenesis in bone repair and regeneration. Bone 70, 19–27 (2015).
12 Wu C, Chang J. Multifunctional mesoporous bioactive glasses for effective delivery of therapeutic ions and drug/ growth factors. J. Control. Release 193, 282–295 (2014). 13 Wernike E, Hofstetter W, Liu Y et al. Long-term
cell-mediated protein release from calcium phosphate ceramics. J. Biomed. Mater. Res. A 92A(2), 463–474 (2010).
•• One of the rare papers having studied growth factor release from mesoporous hydroxyapatite.
14 Poh CK, Ng S, Lim TY et al. In vitro characterizations of mesoporous hydroxyapatite as a controlled release delivery device for VEGF in orthopedic applications. J. Biomed. Mater. Res. A 100A(11), 3143–3150 (2012).
15 Chen Y, Wang J, Zhu X, Fan Y, Zhang X. Adsorption and release behaviors of vascular endothelial growth factor on porous hydroxyapatite ceramic under competitive conditions. J. Biomater. Tissue Eng. 4, 155–161 (2014).
16 Akkineni AR, Luo Y, Schumacher M et al. 3D plotting of growth factor loaded calcium phosphate cement scaffolds. Acta Biomater. 27, 264–274 (2015).
17 Du B, Liu W, Deng Y et al. Angiogenesis and bone regeneration of porous nano-hydroxyapatite/coralline blocks coated with rhVEGF165 in critical-size alveolar bone defects in vivo. Int. J. Nanomedicine 10, 2555–2565 (2015).
18 Zhang N, Gao TL, Wang Y et al. Environmental pH-controlled loading and release of protein on mesoporous hydroxyapatite nanoparticles for bone tissue engineering. Mater. Sci. Eng. C. 46, 158–165 (2015).
• One of the rare papers having studied protein release from mesoporous hydroxyapatite.
19 Zhang HX, Zhang XP, Xiao GY et al. In vitro and in vivo evaluation of calcium phosphate composite scaffolds containing BMP-VEGF loaded PLGA microspheres for the treatment of avascular necrosis of the femoral head. Mater. Sci. Eng. C Mater. Biol. Appl. 60, 298–307 (2016).
10.2217/nnm-2017-0158 www.futuremedicine.com
future science group
Physicochemical regulation of TGF & VEGF delivery from mesoporous calcium phosphate bone substitutes Research Article
20 Kim JH, Kim TH, Jin GZ et al. Mineralized poly(lactic acid) scaffolds loading vascular endothelial growth factor and the in vivo performance in rat subcutaneous model. J. Biomed. Mater. Res. A 101(5), 1447–1455 (2013).
21 Das A, Fishero BA, Christophel JJ et al. Poly(lactic-co-glycolide) polymer constructs cross-linked with human BMP-6 and VEGF protein significantly enhance rat mandible defect repair. Cell Tissue Res. 364(1), 125–135 (2016).
22 Farokhi M, Mottaghitalab F, Ai J, Shokrgozar MA. Sustained release of platelet-derived growth factor and vascular endothelial growth factor from silk/calcium phosphate/PLGA based nanocomposite scaffold. Int. J. Pharm. 454(1), 216–225 (2013).
23 Amirian J, Linh NT, Min YK, Lee BT. Bone formation of a porous Gelatin-Pectin-biphasic calcium phosphate composite in presence of BMP-2 and VEGF. Int. J. Biol. Macromol. 76, 10–24 (2015).
24 Khojasteh A, Fahimipour F, Eslaminejad MB et al. Development of PLGA-coated beta-TCP scaffolds containing VEGF for bone tissue engineering. Mater. Sci. Eng. C Mater. Biol. Appl. 69, 780–788 (2016).
25 Wernike E, Montjovent MO, Liu Y et al. VEGF incorporated into calcium phosphate ceramics promotes vascularisation and bone formation in vivo. Eur. Cell. Mater. 19, 30–40 (2010).
•• The only paper describing a smart encapsulation of VEGF by co-precipitation into calcium phosphate materials and demonstration of its controlled release both in vitro and
in vivo.
26 Tang FQ, Li LL, Chen D. Mesoporous silica nanoparticles: synthesis, biocompatibility and drug delivery. Adv. Mater. 24(12), 1504–1534 (2012).
27 Neumann A, Christel A, Kasper C, Behrens P. BMP2-loaded nanoporous silica nanoparticles promote osteogenic differentiation of human mesenchymal stem cells. R. Soc. Chem. Adv. 3(46), 24222–24230 (2013).
28 Kim TH, Eltohamy M, Kim M et al. Therapeutic foam scaffolds incorporating biopolymer-shelled mesoporous nanospheres with growth factors. Acta Biomater. 10(6), 2612–2621 (2014).
29 Wu CT, Zhou YH, Chang J, Xiao Y. Delivery of
dimethyloxallyl glycine in mesoporous bioactive glass scaffolds to improve angiogenesis and osteogenesis of human bone marrow stromal cells. Acta Biomater. 9(11), 9159–9168 (2013). 30 Perez RA, El-Fiqi A, Park JH et al. Therapeutic bioactive
microcarriers: co-delivery of growth factors and stem cells for bone tissue engineering. Acta Biomater. 10(1), 520–530 (2014).
31 Wu CT, Chang J. Multifunctional mesoporous bioactive glasses for effective delivery of therapeutic ions and drug/ growth factors. J. Control. Release 193, 282–295 (2014). 32 Wang X, Feng J, Bai Y, Zhang Q, Yin Y. Synthesis,
properties, and applications of hollow micro-/nanostructures. Chem. Rev. 116(18), 10983–11060 (2016).
33 Moeller-Siegert J, Parmentier J, Anselme K, Vix-Guterl C. Mesoporous hydroxyapatite by hard templating of silica
and carbon foams for protein release. J. Mater. Sci. 48(10), 3722–3730 (2013).
• One of the rare papers demonstrating the possibility to produce mesoporous calcium phosphate using hard-templating approach. Materials with inter- and intraparticle mesoporosity were obtained.
34 Hinck AP, Archer SJ, Qian SW et al. 1KLA: solution structure of TGF beta 1, NMR, Models 1–17 of 33 structures. Biochemistry 35, 8517–8534 (1996).
35 Muller YA, De Vos AM. 1VPF: structure of human vascular endothelial growth factor. Nucleic Acids Res. 42, D297–D303 (1997).
36 Sarahrudi K, Thomas A, Braunsteiner T et al. VEGF serum concentrations in patients with long bone fractures: a comparison between impaired and normal fracture healing. J. Orthop. Res. 27(10), 1293–1297 (2009).
37 Crucian BE, Zwart SR, Mehta S et al. Plasma cytokine concentrations indicate that in vivo hormonal regulation of immunity is altered during long-duration spaceflight. J. Interferon Cytokine Res. 34(10), 778–786 (2014).
38 Holzer G, Obermair A, Koschat M et al. Concentration of vascular endothelial growth factor (VEGF) in the serum of patients with malignant bone tumors. Med. Pediatr. Oncol. 36(6), 601–604 (2001).
39 Klabusay M, Kohutova V, Coupek P, Nenickova M, Tesarova E. Simultaneous analysis of cytokines and costimulatory molecules concentrations by ELISA technique and of probabilities of measurable concentrations of interleukins IL-2, IL-4, IL-5, IL-6, CXCL8 (IL-8), IL-10, IL-13 occuring in plasma of healthy blood donors. Mediators of inflamm. 2006 (65237), 1–7 (2006).
40 Fogel-Petrovic M, Long JA, Misso NL et al. Physiological concentrations of transforming growth factor beta1 selectively inhibit human dendritic cell function. Int. Immunopharmacol. 7(14), 1924–1933 (2007).
41 Fischer C, Doll J, Tanner M et al. Quantification of TGF-β1, PDGF and IGF-1 cytokine expression after fracture treatment vs. non-union therapy via masquelet. Injury 47(2), 342–349 (2016).
42 Hellsten Y, Rufener N, Nielsen JJ et al. Passive leg movement enhances interstitial VEGF protein, endothelial cell proliferation, and eNOS mRNA content in human skeletal muscle. Am. J. Physiol. Regul. Integr. Comp. Physiol. 294(3), R975–R982 (2008).
43 Wildemann B, Schmidmaier G, Brenner N et al. Quantification, localization, and expression of IGF-I and TGF-beta1 during growth factor-stimulated fracture healing. Calcif. Tissue Int. 74(4), 388–397 (2004).
44 Zhao YF, Ma J. Triblock co-polymer templating synthesis of mesostructured hydroxyapatite. Microporous Mesoporous Mater. 87(2), 110–117 (2005).
45 El Hammari L, Merroun H, Coradin T, Cassaignon S, Laghzizil A. Mesoporous hydroxyapatites prepared in ethanol-water media: structure and surface properties. Mater. Chem. Phys. 104(2–3), 448–453 (2007).
46 Doostmohammadi A, Monshi A, Salehi R et al. Preparation, chemistry and physical properties of bone-derived
hydroxyapatite particles having a negative zeta potential. Mater. Chem. Phys. 132(2–3), 446–452 (2012).
47 Lee WH, Loo CY, Rohanizadeh R. A review of chemical surface modification of bioceramics: effects on protein adsorption and cellular response. Colloids Surf. B Biointerfaces 122, 823–834 (2014).
48 Lee WH, Loo CY, Van KL, Zavgorodniy AV, Rohanizadeh R. Modulating protein adsorption onto hydroxyapatite particles using different amino acid treatments. J. R. Soc. Interface 9(70), 918–927 (2012).
49 King WJ, Krebsbach PH. Growth factor delivery: how surface interactions modulate release in vitro and in vivo. Adv. Drug Deliver. Rev. 64(12), 1239–1256 (2012).
50 Mehta M, Schmidt-Bleek K, Duda GN, Mooney DJ. Biomaterial delivery of morphogens to mimic the natural healing cascade in bone. Adv. Drug Deliver. Rev. 64(12), 1257–1276 (2012).