Publisher’s version / Version de l'éditeur:
Journal of Thermal Analysis and Calorimetry, 86, December 3, pp. 651-657, 2006-12-01
READ THESE TERMS AND CONDITIONS CAREFULLY BEFORE USING THIS WEBSITE.
https://nrc-publications.canada.ca/eng/copyright
Vous avez des questions? Nous pouvons vous aider. Pour communiquer directement avec un auteur, consultez la
première page de la revue dans laquelle son article a été publié afin de trouver ses coordonnées. Si vous n’arrivez pas à les repérer, communiquez avec nous à PublicationsArchive-ArchivesPublications@nrc-cnrc.gc.ca.
Questions? Contact the NRC Publications Archive team at
PublicationsArchive-ArchivesPublications@nrc-cnrc.gc.ca. If you wish to email the authors directly, please see the first page of the publication for their contact information.
NRC Publications Archive
Archives des publications du CNRC
This publication could be one of several versions: author’s original, accepted manuscript or the publisher’s version. / La version de cette publication peut être l’une des suivantes : la version prépublication de l’auteur, la version acceptée du manuscrit ou la version de l’éditeur.
For the publisher’s version, please access the DOI link below./ Pour consulter la version de l’éditeur, utilisez le lien DOI ci-dessous.
https://doi.org/10.1007/s10973-006-7720-1
Access and use of this website and the material on it are subject to the Terms and Conditions set forth at Synthesis, thermal and structural characterization of nanocomposites for potential applications in construction
Mojumdar, S. C.; Raki, L.
https://publications-cnrc.canada.ca/fra/droits
L’accès à ce site Web et l’utilisation de son contenu sont assujettis aux conditions présentées dans le site LISEZ CES CONDITIONS ATTENTIVEMENT AVANT D’UTILISER CE SITE WEB.
NRC Publications Record / Notice d'Archives des publications de CNRC:
https://nrc-publications.canada.ca/eng/view/object/?id=fb7b6f30-19e8-49d6-a1e5-65011ff00698 https://publications-cnrc.canada.ca/fra/voir/objet/?id=fb7b6f30-19e8-49d6-a1e5-65011ff00698
http://irc.nrc-cnrc.gc.ca
S y n t h e s i s , t h e r m a l a n d s t r u c t u r a l
c h a r a c t e r i z a t i o n o f n a n o c o m p o s i t e s f o r
p o t e n t i a l a p p l i c a t i o n s i n c o n s t r u c t i o n
N R C C - 4 5 1 7 0
M o j u m d a r , S . C . ; R a k i , L .
A version of this document is published in / Une version de ce document se trouve dans: Journal of Thermal Analysis and Calorimetry, v. 86, no. 3, Dec. 2006, pp. 651-657 Doi: 10.1007/s10973-006-7720-1
The material in this document is covered by the provisions of the Copyright Act, by Canadian laws, policies, regulations and international agreements. Such provisions serve to identify the information source and, in specific instances, to prohibit reproduction of materials without written permission. For more information visit http://laws.justice.gc.ca/en/showtdm/cs/C-42
Les renseignements dans ce document sont protégés par la Loi sur le droit d'auteur, par les lois, les politiques et les règlements du Canada et des accords internationaux. Ces dispositions permettent d'identifier la source de l'information et, dans certains cas, d'interdire la copie de documents sans permission écrite. Pour obtenir de plus amples renseignements : http://lois.justice.gc.ca/fr/showtdm/cs/C-42
SYNTHESIS, THERMAL AND STRUCTURAL CHARACTERIZATION OF NANOCOMPOSITES FOR POTENTIAL APPLICATIONS IN CONSTRUCTION
S. C. Mojumdar and L. Raki
Institute for Research in Construction, National Research Council of Canada, M-20, 1200 Montreal Road, Ottawa, Ontario K1A 0R6, Canada, E-Mail: Subhash.Mojumdar@nrc-cnrc.gc.ca
Abstract
Several calcium silicate hydrate (C-S-H)-polymer nanocomposite (C-S-HPN) materials have been prepared by incorporating poly (acrylic acid) (PAA) into the inorganic layers of C-S-H during precipitation of quasicrystalline C-S-H from aqueous solution. The synthetic C-S-HPN materials were characterized by X-ray fluorescence (XRF), X-ray diffraction (XRD), Fourier-transform infrared (FTIR) spectroscopy, scanning electron microscopy/energy dispersive spectroscopy (SEM-EDS), thermogravimetry (TG), differential thermogravimetry (DTG) and differential scanning calorimetry (DSC). The XRD peaks of C-S-HPN materials suggest the intermediate organizations presenting both intercalation of PAA and exfoliation of C-S-H. The SEM images of C-S-H and C-S-HPN materials with different PAA contents exhibit the significant differences in their morphologies. Effects of the material compositions on the thermal stability of series of S-HPN materials along with PAA and C-S-H has been studied by TG, DTG and DSC. Three significant decomposition temperature ranges were observed on the TG curves of all C-S-HPN materials.
Introduction
Poly (acrylic acid) (PAA), a carboxylic acids polymer, is known to react with multivalent metal cations and forms cross-links with metals, which are insoluble in water and most of the organic solvents. For such polymers Coulomb force, the strongest interaction, works between molecules and metal ions, hence it is considered to have an excellent potential as materials with high modulus, high strength and high heat resistance in the solid state [1]. Therefore, selected PAA was used to synthesize C-S-HPN materials with improved properties. C-S-H is the main hydrated (binding) phase in cement pastes. It has a nanocrystalline structure and possesses hydraulic properties. Nanocomposite materials consisting of inorganic nanolayers of C-S-H and organic polymers have evoked intense research interest lately because their unique characteristics create many potentially commercial applications. The synthesis of C-S-H-based nanocomposites using a number of organic polymers was recently reported in [2-6].
We defined nanocomposites as a new class of composites, that are particle-filled polymers for which at least one dimension of the dispersed particles is in the nanometer range. Three types of nanocomposites, depending on how many dimensions of the dispersed particles are in the nanometer range can be distinguished [7]. Particles with three dimensions in the order of nanometers are typically isodimensional, such as spherical silica nanoparticles obtained by in situ sol-gel methods [8, 9] or by polymerization promoted directly from their surface [10]. They also include semiconductor nanoclusters [11] and others [9]. Nanotubes or whiskers (with dimensions in the nanometer scale and the third forming a larger elongated structure), for example, carbon nanotubes [12] or cellulose whiskers [13, 14] are extensively studied as reinforcing phases yielding materials with exceptional properties. The third type of nanocomposites is characterized by only one dimension in the nanometer range. In this case, the material is present in the form of sheets of one to a few nanometers thick and
hundreds to thousands nanometers long. This family of composites is referred to as polymer-layered crystal nanocomposites.
Depending on the nature of the components used (layered structure, organic ions/polymer matrix) and the method of preparation, three main types of composites may be obtained when a layered structure is associated with a polymer [7]. If the polymer is unable to intercalate between the layered sheets, a phase-separated composite is obtained, whose properties stay in the same range as traditional microcomposites. Beyond this classical family of composites, two types of nanocomposites can be distinguished. An “intercalated” structure in which a single (and sometimes more than one) extended polymer chain is intercalated between the inorganic layers resulting in a well-ordered multilayer morphology built up with alternating polymeric and inorganic layers. When the layers are completely and uniformly dispersed in a continuous polymer matrix, an “exfoliated or delaminated” structure is obtained. XRD together with TEM, SEM and AFM are usually used to identify intercalated structures. In such nanocomposites, the repetitive multilayer structure is well preserved, allowing the interlayer spacing to be determined. The intercalation of the polymer chains usually increases the interlayer spacing, in comparison with the spacing of the host used, leading to a shift of the diffraction peak towards lower angle values (angle and layer spacing values being related through the Bragg’s relation: λ = 2d sinθ, where λ corresponds to the wave length of the X-ray radiation used in the diffraction experiment, d is the spacing between diffractional lattice planes and θ is the measured diffraction angle or glancing angle). As far as exfoliated structure is concerned, no more diffraction peaks are visible in the XRD diffractograms either because of a much too large spacing between the layers (i.e. exceeding 8 nm in the case of ordered exfoliated structure) or because the nanocomposite does not present ordering anymore. Other intermediate organizations can exist presenting both intercalation and exfoliation. In this case, a broadening of the diffraction peak is often observed [7].
Organic-inorganic hybrid materials, composed of layered inorganic matrix with organic polyconjugated macromolecules in the interlayer space, have been the subjects of thorough attention of researchers for the past 5-15 years [15-47]. Polymer-clay nanocomposite materials are reported to promote thermal [48, 49], mechanical [50], molecular barriers [51], flame retardant behavior [52-59] and corrosion protection properties [60-62]. Therefore, the systematic investigation of the reaction possibility of PAA with synthetic C-S-H at low Ca/Si ratio (0.7) as well as to characterize the composite materials by nanotechnological methods are the main interests of this contribution.
Experimental
Materials
Poly(acrylic acid)-partial Na-salt ([-CH2CH(CO2R)-]n, R = H or Na), (MW = 5,000 (Aldrich Chemical
Company, Inc., Milwaukee, WI, USA), Na2SiO3 · 9H2O (National Silicates, Toronto Canada),
Ca(NO3)2 · 4H2O and NaOH (Fisher Scientific, Fair Lawn, New Jersey, USA) were used to synthesize
C-S-H and C-S-HPN materials.
Synthesis of C-S-HPN materials
C-S-H and C-S-HPN materials with PAA contents of (0.0 and 0.05, 0.15, 0.3 or 0.5 g/g Ca salt) were synthesized by gradually adding calcium nitrate solution (1 mol/L) with continual stirring under nitrogen to sodium silicate solution, which was pre-dissolved with PAA (only for the synthesis of C-S-HPN materials) in CO2 – free de-ionized water. The initial Ca/Si molar ratio was 0.7 for C-S-H and all
C-S-HPN materials. The pH value was kept between 13.2-13.4 by adding NaOH solution (4.0 M) during the precipitation of C-S-H. After aging the suspension at 60 0C for seven days with continuous stirring, the precipitate was separated by vacuum filtration and washed with CO2 – free de-ionized
with acetone and dried at 60 °C in a vacuum oven for 7 days. The synthetic C-S-H and C-S-HPN materials are summarized in Table 1.
Analytical procedure
The powder X-ray diffraction (XRD) patterns were performed on a Scintag XDS 2000 X-ray diffractometer using Cu-Kα radiation at 45 kV and 35 mA between 4 and 65 ° (2θ) with a graphite secondary monochromator.
XRF analysis was performed on fusion beads made of 10 g of flux with a 66 % lithium tetraborate 33 % lithium metaborate fusion matrix and 1 g of sample. Beads were mounted into a Brukar AXS S4 Pioneer automated XRF machine and analyzed for all elements as oxides. Samples were run under vacuum and using the default peak fitting program. Results were presented as percentages by weight of the oxide version of each element detected and normalized to 100 %. Loss on ignition or material loss during the fusion process was ignored during the analysis of the results due to the highly variable polymer content of the materials being tested.
FTIR spectra were collected on a Bomem MB 100 spectrometer in direct transmission mode between 4000 and 400 cm-1 as the average of 50 scans and a 4 cm-1 resolution. Samples were ground to a fine powder with KBr and pressed into a disk with a 10-ton ring press. Air was used as a background for all measurements.
SEM images were acquired on a Hitachi S-4800 Field Emmission Scanning Electron Microscope. Surface structure images were taken using a beam current of 3.2 x 10⁻¹⁶ J at 10 μA. Images were acquired using an integrated frame capture with 32 frames to reduce random noise. Images were acquired at a working distance of 8 mm and each area of interest was captured a series of field magnifications from 5000 to 80,000x magnification.
Energy dispersive spectrometry (EDS) was used to determine the elemental content of areas of interest. The EDS spectra were captured using a beam current of 3.2 x 10⁻¹⁵ J at 10 μA. Spectral images and data were performed at a working distance of 15 mm. Semi-quantitative results were based on ZAP software database reference values and are an indication of relative elemental content rather than absolute values as no reference standards were used.
Thermal analyses (TGA, DTG and DSC) on powder samples (~ 20 mg) were carried out using a simultaneous SDT Q600 T.A.I. instrument at 10 °C/min from room temperature (rT) to 1000 °C under nitrogen atmosphere using a flowing rate 100 mL/min.
Results and discussion
X-ray diffraction analysis
The most important powder XRD peaks have been exhibited at 2θ = 5-9 ° (XRD patterns have not shown here) (interlayer spacing d = 1.22 nm for C-S-H and 1.26 – 1.48 nm for C-S-HPN materials). The XRD peaks of C-S-HPN materials not only shifted to the lower angles but also broadened. This behavior suggests the intermediate organizations presenting both intercalation and exfoliation. The overall C-S-H layers expansion was small compared to PAA molecules diameter. The formation of these nanocomposites depends on the structure of the host material itself, the charge density on the surface (here the Ca/Si ratio), the method of preparation (in-situ or exchange), and the type of organic polymers. The small expansion upon intercalation could only be explained by a single linear extension conformation of PAA molecules [2, 4]. The intermediate organizations, which presents both intercalation and exfoliation, has also been confirmed by SEM. The highest intercalation of PAA into the C-S-H layer has been achieved for C-S-HPN materials with PAA content of 0.5 g/g Ca salt.
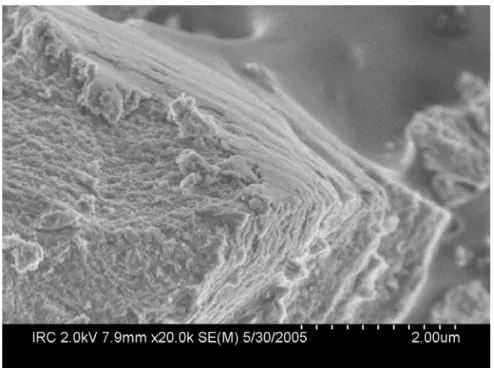
SEM analysis
The SEM images of C-S-H and C-S-HPN materials are shown on Figs. 1-3. Fig. 1 represents a SEM image of pure C-S-H. The particles display a sinuous surface, typical for C-S-H [63]. A SEM image of a C-S-HPN material, which highlights the layer structure, has been presented in Fig. 2 (PAA = 0.05 g/g Ca salt).
A unique example of intercalation of PAA into the C-S-H layers is presented in Fig. 3. The image exhibits a layered organization of C-S-HPN materials. The lighter phase has a lower carbon content than the darker phase. It can be concluded on the basis of SEM, carbon content and XRD results that the lighter phase is C-S-H and the darker phase is PAA in the C-S-HPN materials.
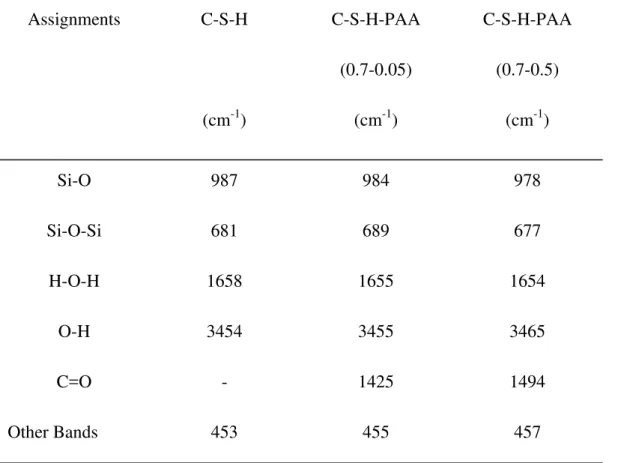
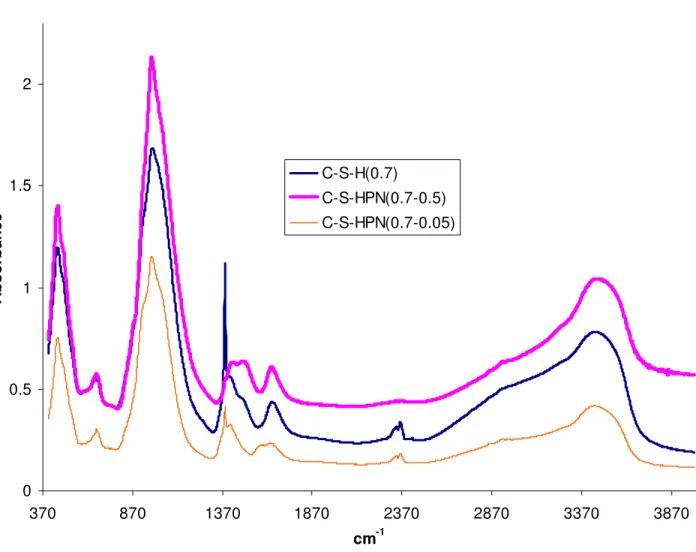
FTIR spectral analysis
The most important FTIR spectral bands of C-S-H, bulk PAA and selected C-S-HPN materials have been summarized in Table 2 and the spectra has been shown in Fig. 4. All spectra of H and C-S-HPN materials contain a characteristic set of bands at the range 973-978 cm-1. These are the most intensive bands in all spectra and can be assigned to Si-O stretching vibration of the Q2 tetrahedra. The weak band at about 811 cm-1 is missing in all C-S-HPN materials suggesting the only polymeric structure. The Si-O-Si bands are present at 669–677 cm-1. The stretching bands at 3300–3700 cm-1 can be attributed to water molecules in C-S-H and C-S-HPN materials. This observation is consistent with the observed decrease in water content with increasing polymer contents for these samples. At higher PAA contents, less H2O molecules can be accommodated within the layer. The bands in the
range of 1550–1750 cm-1 are due to H-O-H bending vibrations of H2O molecules. Other bands at 400–
495 cm-1 are due to the internal deformation of SiO4 tetrahedra [64]. The characteristic vibration bands
of PAA [65] in C-S-HPN materials are shown at 1423–1494 cm-1 (O=C-OR). The presence of PAA bands in C-S-HPN materials is the indication of the presence of PAA molecules.
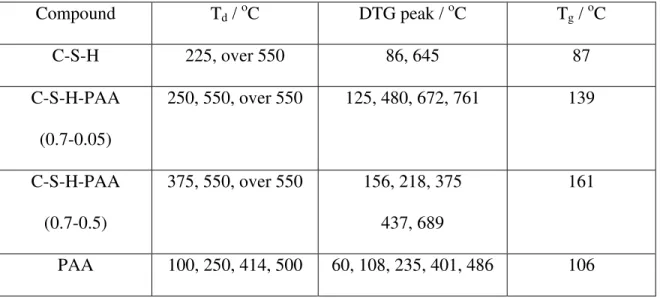
TG and DTG studies of C-S-H, PAA and C-S-HPN materials
The most important thermoanalytical (TG, DTG and DSC) data of C-S-H, representative C-S-HPN materials and bulk PAA are presented in Table 3. Fig 5 shows the TG thermal curves of mass loss as a function of temperature of the C-S-H, PAA and representative C-S-HPN materials in the same figure. There are significant differences in the thermal decomposition properties of H, PAA and C-S-HPN materials. C-S-C-S-HPN materials have exhibited higher thermal stability compare to starting materials (C-S-H and PAA). This property of C-S-HPN materials confirms the flame retardant behavior [51-58] of these types of nanomaterials. In general, three significant temperature regions on the TG curves of PAA and C-S-HPN materials have been observed:
i) Region I (rT-347 °C): this is the region of absorbed and bound water removal [61-66] due to the loss of molecular water with DTG peaks at 86 – 235 °C (Table 3, Fig. 6). In the case of C-S-HPN materials, the decomposition temperature (Td) in this region is variable depending on the synthesis
and material compositions (Table 3, Fig. 5). In the case of PAA, this temperature region has divided into three regions. These are rT-100 and 100-250 °C with one and two DTG peaks at 60 and 108 and 235 °C, respectively. The first and second temperature regions and DTG peaks are due to the absorbed and bound water removal, respectively [67, 68].
ii) Region II (250-550 °C): this temperature region is attributed mainly to the polymeric material decomposition [66-72]. For C-S-HPN material (with higher PAA contents), two decomposition steps are observed, similar to the decomposition of pure PAA, (Table 3, Fig. 5). DTG curves of C-S-HPN material as well as PAA exhibit two DTG peaks at the temperature range 375 - 486 °C (Table 3, Fig. 6). The first and second temperature regions and DTG peaks are due to the decomposition of carboxyl groups and rupture of the polymer chain [68]. However, C-S-HPN material with PAA content of 0.05 g/g Ca salt, exhibits one decomposition step and one DTG peak.
Since the content of PAA is very low, the PAA characteristic is very weak and/or undetectable. The greater the polymer contents, the larger the mass losses on the TG curve in this region and the closer characteristics of PAA have been observed. This fact strongly suggests the presence of a higher percentage of PAA in the C-S-HPN materials produced with higher PAA contents. The shift of DTG peak to lower temperature (from 401 to 375 °C) in C-S-HPN materials compared to pure PAA is due to the environmental changes of PAA, which has been resulted by the influence of C-S-HPN material environments. These findings are similar to those of in MDF materials [69, 70]. iii) Region III (over 550 °C): this temperature region is characteristic for structural water and CaCO3
decomposition [69–76]. Since the amount of structural water and CaCO3 (which may formed
during the synthesis of C-S-H and C-S-HPN materials) is very low, DTG peaks corresponding to the release of H2O, and CO2 from CaCO3 are very weak or insignificant. The atmospheric moisture
and CO2 causes the formation of Ca(OH)2 and CaCO3 according to the reactions 1 and 2.
CaO(s) + H2O(l) = Ca(OH)2(s) ( 1 )
Ca(OH)2(s) + CO2(g) = CaCO3(s) + H2O(l) ( 2 )
DSC studies of C-S-H, PAA and C-S-HPN materials
DSC traces of C-S-H, PAA and C-S-HPN materials are presented in Fig. 7. PAA exhibits an endotherm at 106 °C corresponding to the glass transition temperature (Tg) of PAA. Tg depends on the
molecular structure of the polymer (chain stiffness, number, and bulkiness of the side groups, and the inter- and intra-molecular interactions) and on the crosslink density of the polymer [77]. All C-S-HPN materials are found to have higher Tg compared to that of bulk PAA, as shown in Table 3 and Fig. 7.
This is tentatively attributed to the confinement of the intercalated polymer chains within the C-S-H galleries that prevent the segmental motions of the polymer chains. The DSC peaks of C-S-HPN materials shift to higher temperatures suggesting the intercalation of PAA into C-S-H. The largest
shift of the endothermic peaks (toward the higher temperature) occurs in the DSC curve of C-S-HPN material containing PAA 0.5 (g/g Ca salt). This fact suggests the greatest intercalation of the PAA molecules. This fact is also confirmed by XRD results (d = 1.48 nm).
Conclusions
New calcium silicate hydrate/poly(acrylic acid) nanocomposites (C-S-HPN) have been prepared and characterized. Synthetic C-S-H and C-S-HPN materials have been analyzed by XRD, SEM-EDS, TG, DTG, DSC and FTIR spectra. The XRD and SEM results suggest the occurence of intermediate organizations representing both intercalation and exfoliation in C-S-HPN materials. Significant differences in the morphologies of C-S-H and C-S-HPN materials with different PAA contents have been observed in SEM micrographs. The influence of the material compositions on the thermal decomposition of C-S-HPN materials, pure PAA and synthetic C-S-H has been studied by TG, DTG and DSC. Three significant decomposition temperature regions were observed on the TG curves of different C-S-HPN materials corresponding to the decomposition temperature of C-S-H structure, polymeric entities, and structural water and CaCO3.
This investigation opens up new routes to develop cement-based nanocomposites with various polymers for future potential applications in the construction field, such as coatings for corrosion protection and for fire retardancy. A study to elucidate the effect of PAA molecules intercalation on Ca/Si ratio of C-S-HPN materials by means of MAS NMR spectra, TEM and AFM microscopy will be presented in a future article.
The authors would like to thank Peter Collins for FTIR spectroscopic measurements, Gordon Chan for TGA-DTG-DSC measurements and Jim Margeson for performing XRF and SEM-EDS analysis.
References
1. Y. Gotoh, Y. Ohkoshi and M. Nagura, Transaction, 55 (1999) 522. 2. H. Matsuyama and J. F. Young, J. Mater. Res., 14 (1999) 3379. 3. H. Matsuyama and J. F. Young, J. Mater. Res., 14 (1999) 16. 4. H. Matsuyama and J. F. Young, Chem. Mater., 11 (1999) 3389. 5. S. C. Mojumdar and L. Raki, J. Therm. Anal. Cal., 82 (2005) 89. 6. S. C. Mojumdar and L. Raki, J. Therm. Anal. Cal., in press (2006) 7. M. Alexandre and P. Dubois, Mater. Sci. Eng., 28 (2000) 1. 8. J. E. Mark, Polym. Eng. Sci., 36 (1996) 2905.
9. E. Reynaud, C. Gauthier and J. Perez, Rev. Metall./Cah. Inf. Tech., 96 (1999) 169. 10. T. Von Werne and T. E. Patten, J. Am. Chem. Soc., 121 (1999) 7409.
11. N. Heron and D. L. Thorn, Adv. Mater., 10 (1998) 1173.
12. P. Cavert, Potential application of nanotubes, in: T.W. Ebbesen (Ed.), Carbon Nanotubes, CRC Press, Boca Raton, FL, 1997, pp. 277-292.
13. V. Favier, G. R. Canova, S. C. Shrivastava, J. Y. Cavaille, Polym. Eng. Sci., 37 (1997) 1732.
14. L. Chazeau, J. Y. Cavalle, G. Canova, R. Dendievel and B. Boutherin, J. Appl. Polym. Sci., 71 (1999) 1797.
15. M. Delucchi and G. Cerisola, Constr. Build. Mater., 15 (2001) 351. 16. M. G. Kanatzidis, L. M. Tonge, J. Am. Chem. Soc., 109 (1987) 3797.
17. M. Drábik, L. Gáliková, K. G. Varshney and M. A. Quraishi, J. Therm. Anal. Cal., 76 (2004) 91. 18. G. K. D. Pushpalal, J. Mat. Sci., 35 (2000) 981.
19. B. X. Li, W. Q. Liang, W. S. Zhang and Z. He, J. Chin. Cer. Soc., 28 (2000) 325. 20. S. C. Mojumdar, J. Therm. Anal. Cal., 64 (2001) 1133.
21. J. D Birchal, A. J. Howard, K. Kendal and J. H. Raistrick, 1988, June, Cementitious Composition and Cementitious Product of High Flexural Strength. European Pat. Specification, B1, No. 0055035, 1-17.
22. M. Drabik, S. C. Mojumdar and L. Galikova, Cem. Concr. Res., 31 (2001) 751.
23. J.A. Lewis and P.G. Desai, 1996, MAETA Workshop on High Flexural Polymer-Cement Composite, Sakata, 3-4 October, p. 49-58.
24. S. C. Mojumdar and M. Drabik, Science of cement and concrete-Kurdowski Symposium (Akapit Scientific Publisher, Poland 2001).
25. S. C. Mojumdar, A. Ray, M. Drábik, A. Cigan, F. Hanic and P. Capek, Sol. Stat. Phenom., 90-91 (2003) 365.
26. M. Drabik, L. Galikova and S. C. Mojumdar, Key Eng. Mat., 206-213 (2002) 1867.
27. S. C. Mojumdar, Thermophysics 2001, October 23-25, 2001, Račková Dolina, High Tatras, Slovakia, p. 93-98.
28. K. Kendal, A. J. Howard and J. D. Birchal, Philos. Trans. R. Soc., A310 (1983) 139. 29. M. Drábik, S. C. Mojumdar and R. C. T. Slade, CERAMICS – Silikaty, 46 (2002) 68. 30. B. X. Li, W. Q. Liang and Z. He, J. Wuhan Univ. Technol., 16 (2001) 25.
31. S. C. Mojumdar, Res. J. Chem. Environ., 9 (2005) 23.
32. M. Delucchii and G. Cerisola, Constr. Build. Mater., 15 (2001) 351.
33. S. C. Mojumdar, Challenges for Coord. Chemistry in the new century, 5 (2001) 453.
34. R. Alfani, P. Colombet, A. D’Amore, N. Rizzo and L. Nicolais, J. Mater. Sci., 34 (1999) 5683. 35. S. C. Mojumdar and L. Raki, J. Therm. Anal. Cal., in press (2006).
36. C. Y. Rha, J. W. Seong, C. E. Kim, S. K. Lee and W. K. Kim, J. Mater. Sci., 34 (1999) 4653. 37. C. K. Park, J. Cer. Soc. Jap., 106 (1998) 268.
38. J. A. Lewis and M. A. Boyer, Adv. Cem. Bas. Mater., 2 (1995) 2. 39. M. Tan, J. Lu and K. Wu, Cem. Concr. Res., 24 (1994) 1185.
40. P. G. Desai, J. A. Lewis and D. P. Bentz, J. Mater. Sci., 29 (1994) 711.
41. I. A. A. Ibrahim, H. H. ElSersy and M. F. Abadir, J. Therm. Anal. Cal., 76 (2004) 713.
42. J. Dweck, P. F. Ferreira da Silva, R. Silva Aderne, P. M. Büchler; and F. K. Cartledge, J. Therm. Anal. Cal., 71 (2003) 821.
43. S.C. Mojumdar, B. Chowdhury, K.G. Varshney and K. Mazanec, J. Therm. Anal. Cal., 78 (2004) 135.
44. T. Lan, P. D. Kaviratna and T. J. Pinnavaia, Chem. Mater., 6 (1994) 573.
45. I. Odler, Special Inorganic Cement, Capter 13.3, MDF cement, E & F. N. Spon (London, New York) 2000.
46. G. Wegner, Acta Materialia (The millennium special issue) 48 (2000) 253. 47. M. Drabik and R.C.T. Slade, Interf. Sci., 12 (2004) 375.
48. M. Zanetti, P. Bracco and L. Costa, Polym. Degrad. Stab., 85 (2004) 657. 49. H-L. Tyan, Y-C. Liu and K-H. Wei, Chem. Mater., 11 (1999) 1942. 50. Z. Wang and T. J. Pinnavaia, Chem. Mater., 10 (1998) 3769.
51. J. Liu, Y. Gao, F. Wang and W. Ming, J. Appl. Polym. Sci., 75 (2000) 384. 52. J. W. Gilman, Appl. Clay Sci., 15 (1999) 31.
53. J. W. Gilman, C. L. Jackson, A. B. Morgan, J. R. Hayyis, E. Manias, E.P. Giannelis, M. Wuthenow, D. Hilton and S. H. Philips, Chem. Mater., 12 (2000) 1866.
54. D. Porter, E. Metcalfe and M. J. K. Thomas, Fire Mater., 24 (2000) 45.
55. J. Wang, J. Dua, J. Zhu and C. A. Wilkie, Polym. Degrad. Stab., 77 (2002) 249.
56. M. Zanetti, G. Camino, D. Canavese, A. B. Morgan, F. J. Lamelas and C. A. Wilkie, Chem. Mater., 14 (2002) 189.
58. J. Zhu, P. Start, K. A. Mauritz and C. A. Wilkie, Polym. Degrad. Stab., 77 (2002) 253. 59. J. Zhu, F. Uhl, A. B. Morgan and C. A. Wilkie, Chem. Mater., 13 (2001) 4649.
60. J. M. Yeh, S. J. Liou, C. Y. Lai, P. C. Wu and T. Y. Tsai, Chem. Mater., 13 (2001) 1131.
61. J. M. Yeh, C. L. Chen, Y. C. Chen, C. Y. Ma, K. R. Lee, Y. Wei and S. Li, Polymer, 43 (2002) 2729.
62. J. M. Yeh, S. J. Liou, C. Y. Lin, C. Y. Cheng, Y. W. Chang and K. R. Lee, Chem. Mater., 14 (2002) 154.
63. I. Pointeau, B. Piriou, M. Fedoroff, M. G. Barthes, N. Marmier and F. Fromage. J. Coll. Inter. Sci., 236 (2001) 252.
64. P. Yu, R. J. Kirkpatrick, B. Poe, P. F. McMillan and X. Cong, J. Am. Ceram. Soc., 82 (1999) 742. 65. G. Cardenas, C. Munoz and H. Carbacho, Europ. Polym. J., 36 (2000) 1091.
66. B. Chowdhury, J. Therm. Anal. Cal., 78 (2004) 215.
67. X.-D. Fan, Y.-L. Hsieh, J. M. Krochta and M. J. Kurth, J. Appl. Polym. Sci., 82 (2001) 1921. 68. N. Sebastian, B. George and B. Mathew, Polym. Degrad. Stab., 60(1998) 371.
69. M. Drabik, L. Galikova, F. Hanic and J. H. Sharp, Chem. Papers, 51 (1997) 363. 70. M. Drabik, L. Galikova and P. Zimermann, J. Therm. Anal. Cal., 56 (1999) 117. 71. I. Janotka and Ľ. Krajči, Bul. Mater. Sci., 23 (2000) 521.
72. H. F. W. Taylor: Cement Chemistry, 2nd Edn. (Thomas Telford Publ., London 1998). 73. I. Janotka, Ľ. Krajči, A. Ray and S. C. Mojumdar, Cem. Concr. Res., 33 (2003) 489.
74. C. A.Strydom and J. H. Potgieter, An investigation into the chemical nature of the reactivity of lime, Proc. 10th Int. Congr. Chem. Cement (Ed. H.Justnes, Sweden 1997).
75. I. Janotka and S. C. Mojumdar, Sol. Stat. Phenom., 90-91 (2003) 309.
76. I. Janotka, T. Nürnbergerová and L. Nad, Magaz. Concr. Res., 52 (2000) 399.
77. S. J. Kim, K. J. Lee, S. M. Lee, I. Y. Kim, Y. M. Lee and S. I. Kim, J. Appl. Polym. Sci., 88 (2003) 2670.
Table 1 Synthetic C-S-H and C-S-HPN materials (Ca/Si = 0.7)
Materials PAA content (g/g Ca salt)
C-S-H (0.7) 0.0
C-S-H-PAA (0.7-0.05) 0.05
Table 2 The most important FTIR spectral peak maxima (4000-400 cm–1) of C-S-H and C-S-HPN materials Assignments C-S-H (cm-1) C-S-H-PAA (0.7-0.05) (cm-1) C-S-H-PAA (0.7-0.5) (cm-1) Si-O 987 984 978 Si-O-Si 681 689 677 H-O-H 1658 1655 1654 O-H 3454 3455 3465 C=O - 1425 1494 Other Bands 453 455 457
Table 3 Summary of thermal analysis data for C-S-H, PAA, and C-S-HPN materials Compound Td / oC DTG peak / oC Tg / oC C-S-H 225, over 550 86, 645 87 C-S-H-PAA (0.7-0.05) 250, 550, over 550 125, 480, 672, 761 139 C-S-H-PAA (0.7-0.5) 375, 550, over 550 156, 218, 375 437, 689 161 PAA 100, 250, 414, 500 60, 108, 235, 401, 486 106 Td = decomposition temperature
Tg = glass transition temperature
Captions to the figures
Fig. 1 SEM micrographs of synthetic C-S-H
Fig. 2 SEM micrographs of a C-S-HPN material (CSH-PAA (0.7-0.05))
Fig. 3 SEM micrograph of a typical intercalated C-S-HPN material (CSH-PAA (0.7-0.5)): PAA (dark
area) has been intercalated between the C-S-H layers
Fig. 4 FTIR spectra of C-S-H and C-S-HPN materials with different polymer contents
Fig. 5 TGA curves of C-S-H, PAA and C-S-HPN materials with different polymer contents
Fig. 6 DTG curves of C-S-H, PAA and C-S-HPN materials with different polymer contents
PAA
Fig. 3 SEM micrograph of a typical intercalated C-S-HPN material (CSH-PAA (0.7-0.5)): PAA (dark area)
0 0.5 1 1.5 2 370 870 1370 1870 2370 2870 3370 3870 cm-1 Absorbance C-S-H(0.7) C-S-HPN(0.7-0.5) C-S-HPN(0.7-0.05)
0 20 40 60 80 100 Weight (%) 0 200 400 600 800 1000 Temperature (°C) ––––––– CSH(0.7) – – – – CSH-PAA(0.7-0.05) ––––– · CSH-PAA(0.7-0.5) ––– – – PAA Universal V3.8B TA Instruments
0.0 0.5 Deriv. Weig ht (%/ °C) 0 200 400 600 800 1000 Temperature (°C) ––––––– CSH(0.7) – – – – CSH-PAA(0.7-0.05) ––––– · CSH-PAA(0.7-0.5) ––– – – PAA Universal V3.8B TA Instruments
0 5 10 Heat Fl o w (W/g) 0 200 400 600 800 1000 Temperature (°C) ––––––– CSH(0.7) – – – – CSH-PAA(0.7-0.05) ––––– · CSH-PAA(0.7-0.5) ––– – – PAA
Exo Up Universal V3.8B TA Instruments