DEMOCRATIC AND POPULAR REPUPLIC OF ALGERIA MINISTRY OF HIGER EDUCATION AND SCIENTIFIC RESEARCH
UNIVERSITY OF MENTOURI CONSTANTINE FACULTY OF SCIENCES CHEMISTRY DEPARTEMENT ---
A THESIS
By: Mr: MAGHCHICHE ABDELHAKSubmitted to Chemistry Department in Partial requirement for the Requirement for the Degree of Doctor in Analytical and physics Chemistry
Jury members:
President : A.MENNOUR Pr. University Mentouri Constantine Supervisor: A.HAOUAM Pr. University Mentouri Constantine
Examiners: Y.BOUZAHER Pr. University H.Lakhdar Batna A.DJEROUROU Pr. University B.Mokhtar Annaba
Academic Years
2008/2009
USE OF POLYMERS AND BIOPOLYMERS FOR
WATTER RETENTION AND SOIL STABILIZATION
Acknowledgements
Before all I thank god for the accomplishment of this work.I would like to express my gratitude to my supervisor Pr. A. HAOUAM for his guidance and Valuable discussion during this study. My experience of working with him has been a highly inspiring and rewarding one.He always stimulated me and gave me the best advices.
My gratitude goes also to the members of the jury who accepted to examine and evaluate my work I thank heartily, A. MENNOUR professor at University of Constantine that accepted to preside the jury.I thank greatly Mr. Y. BOUZAHER Professor at university of Batna and Many thank to Mr. A. DJEROUROU Professor at university of Annaba that honored me by their acceptation to exanimate my thesis.
I'm indebted to the ICTP (institute of chemistry and technology of polymers-Pozzuoli Italy) for their technical assistance. Especially my gratitude to Dr. Barbara who is introduced me to her laboratory where much of the experimental work presented here was performed.
Finally, I am very thankful to my family members for their constant encouragement and support.
TABLE OF CONTENTS
LIST OF ABREVIATIONS ………... ...13
LIST OF TABLES………... ...16
LIST OF FIGURES………...18
GENERAL INTRODUCTION ………...23
CHAPTER I: Review of Arid and Semi Arid Soil Literature
I. ARID AND SEMI ARID REGION ………..………...………27I.1. INTRODUCTION……… ………..………...…27
I.2. Arid and semi- arid regions…………...…..……….…….……….27
I.2.1.Definitions and degrees of aridity ………..………...………….27
I.2.2.Arid Soil………..………...……….…….………….…28
I.3. Desertification ………..………...………..……….…..…..……28
I.3.1. Desertification and arid lands in Algeria ………..……..……… ……...………28
I.4. Drought ………..……… ………...………29
I.4.1. Definition of Drought ………..……… ………...……...………29
a. Meteorological drought ………..……….………...………29
b. Agricultural drought………..……….……….………29
c. Hydrological drought………..……….……...………30
I.5. Soil ………..………...……….……30
I.5.1. Nature and composition of soil ………..………...………..………30
I.5.2. Soil Phases………..………...…….…31
a. Solid phase ………..……….…..………31
b. Liquid phase ………..………..…...…....……32
c. Gaseous phase ………..………...…….………..……32
I.5.3. Soils components ………..………..……….……..… 32
I.5.3.1. Solid components …… …..……….……….………..……… 32
a. Organic components ………..……….……….…..…..………33
b. Inorganic Components ………..………...…………33
I.5.3.2. Water and Air in Soil ………..……… ……..……..……..……..…34
I.5.3.3. Water Movement in Soil………...……….….………..……35
I.5.4.1. Particle Size Fractions … … … ..… … … ...… ...… … 35
I.5.4.2. Particle Size Analysis … … … ..… … … ....… … 36
I.6. Soil physical properties … … … ..… … … ...… .… … … 37
I.6.1. Texture … … … ..… … … … … .… … 37
a. Sand Particles ………..……….………...……37
b. Silt Particles ………..………...………38
c. Clay ………..………38
I.6.1.2. Determining textural class ………..………...……….……38
I.6.1.3. Effects of texture on soil properties………..………...………38
I.6.2. Soil Aggregate … … … ..… … … ..… … … 39
I.6.3. Soil structure … … … ..… … … … … … 39
I.6.3.1. Effects of structure on soil properties ………...………39
I.6.4. Soil porosity………..………..………40
I.6.4.1. Bulk density ………..………..………40
I.7. Soil organic matter … … … ..… … … .… … ..… … .… … 40
I.7.1. Effect of organic matter on soil properties ………..……….……….………40
I.7.2. Importance of soil organic matter … … … ..… … … .… … … … 41
I.8. Water-holding capacity ………..………..……….42
I.9. Soil chemical properties ………..……….……….42
I.9.1. pH … … … ..… … … .… … … 42
I.9.2. Soil Porosity … … … ..… … … .… … … … 42
I.9.3. Soil Moisture … … … ..… … … ...… … … … .… … … … 43
I.9.4. Cations Exchange … … … ..… … … .… 43
I.9.5. Electrical Conductivity … … … ..… … … … … … 43
I.9.6. Calcium Carbonate … … … ..… … … ...… … … 43
I.9.7. Gypsum … … … ..… … … .… 44
I.10. Infiltration … … … ..… … … .… .… … … 44
I.10.1. Definition and Importance … … … ..… … … .… .… … … 44
I.10.2. Measuring the infiltration rate of water into soil… … … ..… … ...… … … .… 45
I.10.3. Infiltration rate … … … ..… … … ...… .… … … 45
I.10.4. Infiltration capacity … … … ..… … … .… 45
I.10.5. Water Use and Infiltration … … … ..… … … ..… … … 45
I.11.1. Evaporation Process … … … ..… … … .. … … .… … … 46
a. Transport of Water to the Soil Surface … … … ..… … … ...… … … … 46
b. Uninterrupted Supply of Heat to Change the State of Water… … … … ..… … ..… … 47
c. Transfer of Water Vapor from Soil Surface to Atmosphere… … … ....… … .… … … 47
I.11.2. Evaporation and transpiration … … … ..… … … .… … … ...… … … … 47
I.11.3. Evaporation of Water from Bare Soil … … … ..… … … … … … 47
I.12. Percolation … … … ..… … … … … … … 47
I.13. Soil Water Content … … … ..… … … … … ...… … 48
I.13.1. Mechanism of water retention … … … ..… … … … … ...… … … 48
I.14. Climatic Constraints of Dry lands and Coping Strategies … … … … ..… … … … … 48
I.14.1. Soil Improvement … … … ..… … … ...… … … … 49
I.14.2. Water Management … … … ..… … … .… … … .… ...… 49
I.14.3. Water Conservation … … … ..… … … ....… … 50
I.14.4. Water availability … … … ..… … … .… … ..… … 50
I.14.4. Increased soil moisture … … … ..… … … ...… … 50
I.14.5. Improving the soils at arid and semi - arid regions … … … ..… … … 50
CHAPTER II: Review of Literature and General Procedures
II.1. SOIL CONDITIONERS … … … ..… … … .… 52II.1.1. INTRODUCTION … … … .… … … 52
II.1.2. Soil conditioner use… … … ..… … … ...… … … 52
II.1.3. Organic Soil conditioners … … … ..… … … 53
II.1.4. Mineral soil conditioners … … … ..… … … … … … … 53
II.1.5. Synthetic Binding Agents … … … ..… … … 53
II.1.6. Geotextiles … … … ..… … … ...53
II.1.7. Mulch Mats … … … ..… … … ..… … 54
a. Particle mulches … … … ..… … … ..… … … … 54
b. Sheet mulches … … … ..… … … .… … … 54
II.1.8. Super water-absorbent polymers … … … ..… … … .… … … ...… .… … … … 54
II.1.9. Super absorbents polymers in agriculture … … … … .… … … 55
II.2. PLASTIC … … … ..… … … 55
II.2.2. Plastic Film in agriculture … … … ..… … … ...… … … ...… .56
II.3. POLYMERS … … … ..… … … ..… … … 56
II.3.1. Water-soluble polymers … … … ..… … … ...… … … ...… … … … 57
II.3.2. Water- insoluble polymers … … … ..… … … ...… … … ...… 57
II.3.3. Agro-Polymers … … … ..… … … … ...… … … .… … 58
II.3.4. Polymers in Agriculture … … … ..… … … ...… … … ...… … … 58
II.4. NATURAL AND SYNTHETIC POLYMERS … … … ..… … … ..… … … …58
II.4.1. Natural Polymers … … … ..… … … ...… … .… .… … … … 58
II.4.1.1. Polymer Structure … … … ..… … … … ...… … … ..… … … 60
II.4.1.2. Polysaccharides … … … ..… … … ...… … … .… 60
II.4.1.3. Cellulose Polymers … … … ..… ...… … … 62
II.4.1.4. General Characteristics … … … ..… … … .… … … 62
II.4.1.5. Structure of Cellulose … … ..… … … ...… … … ...… … … ..… … 63
a. Molecular Structure … … … ..… … … ..… … … .… … … 63
b. Crystal Structure … … … ..… … … .… ..… … … 64
II.4.1.6. Domains of Application of Cellulose … … … ..… … … … ...… … … 65
II.4.1.7. Regenerated Cellulose … … … ..… … … … ...… … … ..… … … .65
II.4.1.8. Lignin and lingo-Celluloses … … … ..… … … ...… … … ...… … … ..… … … … 66
a. Lignin … … … ..… … … .… 67
b. Structure of Lignin … … … ..… … … .… … … … 67
II.4.1.8. Chitin and Chitosan … … … ..… … … .… … … .… … … 68
II.4.1.9. Starch … … … ..… … … .… … ...… … 69
II.4.1.10. Starch and its Derivatives … … … ..… … … ..… … … 69
a. Amylose … … … ..… … … ...… … … … 70
b. Amylopectine … … … ..… … … ...… … … 70
II.4.1.11. Tannins … … … ..… … … … ...… … … 70
II.4.1.12. Extractives… … … ..… … … ...… … … ...… … … 71
II.4.1.13. Protein Materials … … … ..… … … .… ...… … … 71
II.4.2. Synthetic Polymers … … … ..… … … .… … … 72
II.4.2.1. General Classification and Types of Polymers … … ..… … … 72
a. Thermosets … … … ..… … … .… … 72
b. Thermoplastic Polymers … … … ..… … … 73
b. Condensation polymerization … … … ..… … … .… … … … 75
II.4.3. Styrene and Polystyrene … … … ..… … … ...… .… … … 75
II.4.3.1. Styrene … … … ..… … … ...… … … 75
II.4.3.2. Synthesis of styrene … … … ..… … … ...… … 76
II.4.3.3. Polystyrene (PS) … … … ..… … … ...… … … 76
II.4.3.4. Properties of special interest … … … ..… … … 76
II.4.4. Acrylamide and Polyacrylamide … … … ..… … … … ...… … … ..… … … 78
II.4.4.1. Acrylamide … … … ..… … … ...… … … 78
II.4.4.2. Properties … … … ..… … … .… … … .78
II.4.4.3. Uses … … … ..… … … ...… … … .… … … ..78
II.4.4.4. Polyacrylamide (PAM) … … … ..… … … .79
II.4.4.5. Proprieties of special interests … … … ..… … … ..79
II.4.4.6.Polymerization conditions … … … .… … … ..79
II.4.4.7. Application of polyacrylamide … … … ..… … … .80
II.4.4.8. Agricultural use of polyacrylamide … … … ..… … … ..81
II.4.4.9. Recent Advances Using Polyacrylamide … … … ..… … … … ...… … … ..82
II.4.4.10. Polyacrylamide and substituted polyacrylamides … … … ...… … … ...83
II.4.4.11. Benefits of using water - soluble polyacrylamide … … … ..… … … … ...… … … … ...83
II.5. POLYMER FIBER … … … ..… … … .84
II.5.1. Synthetic fibres … … … ..… … … 84
II.5.2. Natural fiber … … … ..… … … ...… … … .… 84
II.5.3. Structure and chemical constituents of natural fibre … … … ..… … … ...… … 86
a. Vegetable fibres … … … ..… … … ..88
b. Wood fibre … … … ..… … … .88
c. Animal fibres … … … ..… … … ..88
d. Mineral fibres … … … ..… … … .88
II.5.4. Plant Fiber Composition and Structure … … … ..… … … ...… … … 88
II.5.5. Structure and properties of plant fibers … … … ..… … … ..… … … .… … … … 89
II.5.6. Fiber Cellulose … … … ..… … … ..… … … .… … … .90
II.5.7. Hemicelluloses … … … ..… … … ..… … … … .… … … .90
II.5.8. Fiber Lignin … … … ..… … … .91
II.5.9. Pectin … … … ..… … … ...… … … 92
II.5.11. Properties of natural fibre… … … ..… … … ...… 93
II.5.12. Fiber source … … … ..… … … 93
II.5.13. Chemical composition of fiber… … … ..… … … ...… … … … 94
II.5.14. Fiber morphology and wood cell structure… … … ..… … … 95
II.5.15. Regenerated Cellulose Fibers solution … … … ..… … … ..… … 98
II.5.16. Surface chemistry of fibers and fillers … … … ..… … … ...… 98
II.5.16.1. Surface Chemistry of Fibers … … … ..… … … ..… 98
II.6. ESPARTO GRASS … … … ..… … … ...… ...… … ..99
II.6.1. Organization and growth of the plant … … … ..… … … ..… … … … ..… 100
II.6.2. Ultra structure of the cells wall of esparto fibres… … … ..… … … … ..… ...… … … ..… 101
II.6.3. Morphology of esparto fibres … … … ..… … … ...… … .… … … 101
II.6.4. Importance of Esparto Grass in Desert Regions … … … ..… … … ..… … … … ...… … 102
CHAPTER III: Characterization techniques
III.1. INTRODUCTION TO POLYMER CHARACTERIZATION… … … ..… … … ..… .… 104III.1.1. Thermal Analysis … … … ..… … … .… … .… … ...… 104
a. Thermogravimetry… … … ..… … … ..… … … … ...… … ...… 104
b. Differential scanning calorimetry … … … ..… … … ....… 105
III.1.2. Infrared spectroscopy (IR) … … … ..… … … ...… ..… ..… … 106
III.1.2.1. Infrared Spectroscopy of polymers… … … ..… … … ...… … … .… … 107
III.1.3. Fourier-transform infrared (FTIR) spectrometers … … … .… … … ...… … 107
III.1.4. Viscosity … … … ..… … … ...… .… ..… 108
III.1.4.1 Determination of Molecular Weights … … … .… .… 108
III.1.4.2. Intrinsic Viscosity … … … ..… … … .… … … ....… … 110
III.1.5. Scanning electron microscopy (SEM) … … … ..… … … ...… … … … ..… … 112
III.1.5.1. SEM for fibers… … … ..… … … .… .… … … …… ..… 113
III.1.6. X-Ray Diffraction (XRD) … … … ..… … … ..… … … … ..… … 113
III. 2. SOIL AND PLANT CHARACTERIZATION… … … ..… … … ..… … … 114
III.2.1. Atomic Spectroscopy… … … ..… … … ..… … … … ..… … 114
III.2.2. Atomic absorption and flame emission spectroscopy… … … ..… … … ...… 115
CHAPTER IV: Experimental Part
IV.1. CLIMATIC STATE… … … ..… … … .… … … ..… ..… … … 117
IV.1.1. Climatic synthesis… … … ..… … … .… … ..… … … ..… … 117
IV.1.1.1. Emberger diagram… … … ..… … … ..… ..… … … .… .117
IV.2. POLYMERS SYNTHESIS … … … ..… … … .… … … … ..… … … ..118
IV.2.1. Raw Materials Preparation… … … ..… … … ..… … … ..… 118
IV.2.2.1. Synthesis of polyacrylamide (PAM) … … … ...… … … ..… … … ..… 118
IV.2.2.2. Synthesis of Polystyrene (PS) … … … ..… … … ..… … ..… … … … ...… 119
IV.2.2.3. Preparation of Polystyrene sub layer… … … ..… … … ..… … ...… … … 119
IV.2.2.4. Polystyrene casting … … … ..… … … ..… ..… … ...… … … … 120
IV.2.2.5. Thickness of sub layer Film… … … ..… … … ....… ...… … … 120
IV.3. ANALYSIS OF PLANT SAMPLES.… … … ..… … … ..… … … 120
IV.3.1. Plant Samples … … … ..… … … ..… ..… ...… … … … 120
IV.3.1.1. Extraction of Cellulose from Esparto plant… … … ..… … … .… … ..… … 121
IV.3.2. Plant Analysis… … … ..… … … ...… … … ..… 121
IV.3.2.1. Crude fiber (%)… … … ..… … … ..… … … … ..… … ..… 121
IV.3.2.2. Determination of Plant Mineral Composition … … … ..… … … ..… ...… … … … .… 122
IV.3.2.3. Moisture contents … … … ..… … … ..… … … ..… … ..… … 123
IV.3.2.4. Humidity uptake by cellulose esparto fibers … … … ..… … … … ...… … … … ..… … 123
IV.3.2.5. Organic matter destruction -wet ashing … … … ..… … … ..… ...… … ..… … .123
IV.3.2.6. Inorganic matter (Ash content) … … … ..… … … ..… … .… … ..… … … 123
IV.3.2.7. Measurement of Cellulose Concentration… … … ..… … … … ..… ..… … … ..… … … 124
IV.3.2.8. Nitrogen … … … ..… … … ..… … … … ..… … … 124
IV.3.2.9. Bleaching … … … ..… … … ..… … … 124
IV.4. POLYMERS CHARACTERISATION… … … ..… … … ..… ...… … ..… … 124
IV.4.1. Molecular weight by viscosimetry… … … ..… … … ....… 124
IV.4.2. FTIR Analysis … … … ..… … … ..… … 124
IV.4.3. Thermal Analysis… … … ..… … … ..… ..… ..… … 125
IV.4.4. X-ray Diffractometry (XRD) … … … ..… … … ...… … … … ..… ..… … 125
IV.4.5. Scanning electron microscopy (SEM) … … … ..… … … .… … … … ..… ..… … 125
IV.5. Soil Sampling and Analysis… … … ..… … … .… … ..… ..… … 125
IV.5.1. Soil sampling … … … ..… … … .… ..… … 125
IV.5.3. Determination of total minerals at arid and semi arid soils … … … ..… … … ...… ..… 126
IV.5.4. Particle-size analysis by sedimentation (Pipette method) … … … ..… … … … .… ..… 126
IV.5.5. Determination of pH in water and KCl (1M) … … … ..… … … ...… … ..… .… 127
IV.5.6. Determination of carbonate content in soils (Volumetric method) … ..… … ..… ...… 127
IV.5.7. Determination of cations and anions concentrations … … … ..… … ...… … … … ....… 127
a. Cations … … … ..… … … ...… … … ..… 127
b. Anions … … … ..… … … ..… … … 127
IV.5.8. Measurement of the electrical conductivity of a solution … … … ..… ..… … ..… … … 127
IV.5.9. Organic matter (OM) … … … ..… … … ...… … … ..… ..… … 127
IV.5.10. Assimilable phosphorus (Joret-Hébert method) … … … ..… … … ..… … ..… … 127
IV.5.11. Total Nitrogen (Kjeldahl method) … … … ..… … … .… … … ..… ..… 128
IV.5.12. Determination of exchangeable bases and CEC … … … ..… … … ..… ..… … 128
IV.5.13. Gypsum … … … ..… … … ...… … 128
IV.6. POLYMER BLENDS AND COMPOSITE MATERIALS… … … ...… … … ..… ..… 128
IV.6.1. General Aspects … … … ..… … … .… ..… 128
IV.6.2. Polymers Blend … … … ..… … … ..… … … ..… … … 128
IV.6.3. Preparation of blended samples… … … ..… … … ..… … ..…129
IV.6.4. Preparation of blend and composites polymers … … … ..… … … ...… … … 129
IV.6.5. Soil Moisture Measurement … … … ..… … … ...… … … 130
IV.6.6. Determination of Soil Water-Holding Capacity … … … ..… … … ..… … … … 130
IV.6.6.1. Principle of Gravimetric Method … … … ..… … … ..… 130
IV.6.7. Sampling and evaporation measurement … … … ..… … … ...… … … ..… … 131
IV.6.8. Measurement of Infiltration… … … ..… … … ..… … 131
IV.6.9. Infiltration Rate … … … ..… … … ....… … 131
IV.6.10. Measurement of evaporation … … … ..… … … .… … … 131
IV.6.10.1. Experimental Procedure … … … ..… … … .… … 131
Chapter V: Results and discussion
V. RESULTS AND DISCUSSION … … … ..… … … ...… ..… … 134V.1. Plant Analysis … … … ..… … … ...… … … 134
V.1.1. Humidity uptake by esparto Fibre … … … ..… … … ..… ...… … … 135
V.3. Polymers Analysis … … … ..… … … .… … … ..… .… 136
V.3.1. Viscosimetry … … … ..… … … ..… … … .… ..… … 136
V.3.2. Viscosity average molecular weight (Mv) of polymers … … … ...… … … … ..… ..… 137
1. Viscosimetry Molecular weight of Polyacrylamide … … … … ..… … .… .… ..… 138
2. Viscosimetry Molecular weight of Polystyrene … … … ...… … … … .… .… … ..… 138
V.3.3. IR Spectra … … … ..… … … .… ..… ..… .… 138
V.3.3.1. Cellulose Spectra … … … ..… … … ..… … ...… … ...… … 138
V.3.3.2. Polyacrylamide and polystyrene Spectra … … … ..… … … .… … … … ..… … … 138
V.3.3.3. IR spectra of arid soil treated with (Polyacrylamide + Cellulose) … … ...… ..… ..… 140
V.3.3.4. IR spectra of semiarid soil treated with (Polyacrylamide + Cellulose) … ..… … .… 140
V.3.4. Thermal Analysis … … … ..… … … ...… … … ...… 141
V.3.4.1. Thermo gravimetric analysis TGA … … … ..… … … .… ...… … … .… … … 141
1. Cellelulose TGA Curve … … … ..… … … .… .… … 141
2. Polyacrylamide TGA Curve … … … ..… … … .… … .… … .… … 141
3. Polystyrene TGA curve … … … ..… … … ..… … … … 141
4. TGA curve of arid soil … … … ..… … … .… .… .… … … 143
5. TGA curve of semiarid soil … … … ..… … … ..… … ..… … … … 143
V.3.4.2. Differential Scanning Calorimetry DSC … ...… ..… … … … ..… ...… … … 144
1. DSC curve of Cellulose … … … ..… … … ....… … … .… … … 144
2. DSC curve of PAM … … … ..… … … ..… … .… … … 144
3. DSC curves of semiarid soil with (PAM + Cellulose) … … … ...… … … .… … … 146
4. DSC curves of arid soil with (PAM + Cellulose) … … … ..… … … .… … … 146
V.3.5. X-ray analysis … … … ..… … … 146
V.3.6. Scanning electron micrographs (SEM) … … … ..… … … .… … … 148
V.3.1. Polystyrene Film … … … ..… … … ...… … … … 149
V.4. Soil water retention… … … ..… … … ...… … … 150
V.5. Evaporation … … … ..… … … ..… … … ....… … 151
V.6. Infiltration … … … ..… … … ...… … .… … 152
V.7. Soil Composite Surface … … … ..… … … 154
V.8. Protocol of blend preparation … … … ..… … … ...… … … 155
GENERAL CONCLUSION
… … … .… ..… … … ..… … … … .… … 157List of Abbreviations
UN United NationsCEC
Cation Exchange Capacity a.a.r Average Annual Rainfall
AI Aridity Index
Pe
Potential Evaporation
PET
Potential Evapo Transpiration WMO
World Meteorological Organization P
Porosity
S Specific Bulk Weight SR Reduced Bulk Weight Q Quantity of Water A Area (cm2)
USDA
U.S. Department of Agriculture ISSS
International Society of Soil Science D Diameter
OM Organic Matter mm Millimeters wt Weight
PLA
Polylactic Acid XRD X-ray Diffraction
SEM Scanning Electron Microscope/Microscopy PS
Polystyrene
PP Polypropylene PVC Poly (viny1 chloride)
PE Polyethylene EB Ethyl Benzene SM styrene monomer
WPCs Wood-Polymer Composites AAS Atomic Absorption Spectroscopy UV-Vis Ultraviolet and Visible Spectroscopy Rpm Rotation per Minute
Cell Cellulose PAM Polyacrylamide µm Micrometer
K sat Saturated HydraulicConductivity
DOC Dissolved Organic Carbon BOD Biological Oxygen Demand TMP Thermo Mechanical Pulp MW Molecular Weight
IR Infrared Spectroscopy TG Thermo Gravimetry
TGA Thermo Gravimetric Analysis
DSC Differential Scanning Calorimeter / Calorimetry TGA Thermo Gravimetric Analysis
TMA Thermo Mechanical Analysis DTG Derivative Thermo Gravimetry DTA
Differential Thermal Analysis
FTIR Fourier-Transform Infrared Spectrometers
TEM Transmission Electron Microscope EC Electrical Conductivity DP Polymerisation Degree ha Hectares id Internal Diameter S Sand C Clay Si Silt
CaCO3T Total Carbonate
CO Coarse CO.S Coarse Sand CO.Si Coarse Silt f Fine f .S Fine Sand PO Propylene Oxide SM Styrene Monomer MWD Mean Weight Diameter WAS Water Aggregate Stability SC Soil Conditioner
S1 Arid Soil (sandy soil) S2 Semi Arid Soil (clay soil) DM Dry Matter
g Gram h Hour m/v Mass/Volume
LIST OF TABLES
CHAPTER I PAGE
Table 1.1: Classification of deserts according to their level of aridity … … … ...… … .28
Table 1.2: Two Widely Used Systems of Particle Size Distribution… … … 36
Table 1.3: Common Textural Classes… … … .… … … ..… … … 37
CHAPTER II
Table 2.1: List of natural polymers… … … ...… … … … ... 59Table 2.2: The properties and applications of some common thermosets… … … .… .. 72
Table 2.3: The properties and applications of some common thermoplastics… … … . 73
Table 2.4: Lists the main function of the polymers and their uses in various industries… ... 80
Table 2.5: Potential benefits and manageable adverse impacts of using … … … .… … 82
PAM for land and water management Table 2.6: Inventory of major potential world fibre sources… … … .… … ..… … .85
Table 2.7: Chemical composition of some common natural and wood fibres (%).… … .… .… 87
Table 2.8: World-wide hard wood and non-wood pulp and paper… … … ...… … 93
Table 2.9: Distribution of main chemical components of wood… … … .… … .… … … … ...… 959 Table 2.10: Approximate C, H, and O content of lignin from spruce and beech… … … .… . 95
Table 2.11: Classification Scientific of Esparto Grass… … … .… ..100
Table
CHAPTER III
Table 3.1: Mark-Houwink - Sakurada Exponents… … … .… … … .110CHAPTER IV
Table 4. : Synthetic details of blend and composites (polymers with soil)… … … ...… 129CHAPTER V
Table 5.1: Raw material composition of esparto grass… … … … ..134
Table 5.2: Mineral components of esparto grass ashes… … … … . 135
Table 5.3: Physical and chemical proprieties of arid soils (S1)… … … … .135
Table 5.4: Physical and chemical proprieties of semiarid soils (S2)… … … ..135
Table 5.5: Exchangeable cations of semi arid soils (meq/100g) … … … .… … .136
Table 5.6: Exchangeable anions of arid soils (meq /l)… … … 136
Table 5.7: Concentration of nitrogen and phosphor … … … ..136
Table 5.8: Viscometer results of polystyrene … … … 137
LIST OF FIGURES
PAGE
CHAPTER I
Figure 1.1: Fine structure of soil, showing solid, water, and air phase… … … .… … … 30
Figure 1.2: Soil Profile showing soil horizons… … … .… .31
Figure 1.3: Soil components and phases… … … ...… … … 32
Figure 1.4: Interaction among four components and three phases … … … ...… … ..… .33
Figure 1.5: Plants transport water from the soil to the atmosphere by transpiration… … ...… .34
Figure 1.6: Examples of water flow in soils … … … ..… ...… … … .. 35
Figure 1.7: The USDA textural triangle… … … ...… … … 38
Figure 1.8: Structure of soil aggregate… … … ...… … ...39
Figure 1.9: Measurement of infiltration in soil columns using a Marriott bottle technique… 46
CHAPTER II
Figure 2.1: Superabsorbent Cross-linked Polyacrylamide… … … ....… ... 55Figure 2.2: Example of water soluble polymers… … … .… … … .… … .57
Figure 2.3: Classification of naturally occurring biopolymers… … … .… … 59
Figure 2.4: Some possible molecular structures in polymers… … … .… … ..60
Figure 2.5: Structure of different polysaccharides… … … .… ...61
Figure 2.6: Structure of cellulose … … … .... 62
Figure 2.7: Inter-molecular and intra-molecular hydrogen bonds of native cellulose… … .… 63
Figure 2.8: Polymer chain organization with micro fibril… … … .… … ...64
Figure 2.9: Conversion of cellulose to regenerated cellulose using caustic soda… … … … .... 66
Figure 2.10: The viscose process for production of regenerated cellulose… … … ...… … ..… . 66
Figure 2.11: Representation of lignin molecules from wheat straw… … … 68
Figure 2.12: Structure of chitin and chitosan… … … .… … … … .. 68
Figure 2.13: D-Glucopyranosyl group… … … . 70
Figure 2.14: Amylopectine structure… … … ... 70
Figure 2.15: Basic structure of condensed tannins consisting of flavanol units… … … … .… . 71
Figure 2.16: Chemical structure of a unit Acryl amide… … … ...… … … .… 77
Figure 2.19: Cellulose -1, 4-glycosidic linkages … … … .. 89
Figure 2.20: Longitudinal section and cross section of a fiber cell… … … . 90
Figure 2.21: The glucose - unite and the cellulose chain… … … 90
Figure 2.22: Hemi cellulose structure… … … . 91
Figure 2.23.The three monomer repeat units of lignin … … … .. 92
Figure 2.24: light photo micrograph illustrating morphological differences between… … … 94
Cell and fibre Figure 2.25: The molecular architecture of the cellulose molecule… … … ... 96
Figure 2.2 : Assembly of a cellulose fiber… … … . 97
Figure 2.27: Structure of an elementary plant fibre… … … 98
Figure 2.28: Esparto Plant (Halfa)… … … .. 99
Figure 2.29: Radicular system of the esparto tuft… … … .… … … ..101
Figure 2.30: Fibres morphology of and cuticle's cell of esparto… … … .102
CHAPTER III
Figure 3.1: Typical components of a TA instrument … … … .… … ... 105Figure 3.2: Schematic diagram of an FTIR spectrometer… … … ..108
Figure 3.3: Ubbelohde viscometer … … … .… … … ... 109
Figure 3.4: General Arrangement of a scanning electron microscope… … … ... 112
Figure 3.5: Schematic representation of diffraction of X-rays by a crystalline material… ... 114
CHPTER IV
Figure 4.1: Emberger diagram… … … 118Figure 4.2: Polystyrene Film preparation… … … ...… … 120
Figure 4.3: Protocol of cellulose Extraction… … … ...… … … 121
Figure 4.4: Arid soil (Biskra region)… … … ..125
Figure 4.5: Semiarid soil (Batna region)… … … 125
CHAPTER V
Figure 5.1: Cellulose fibre obtained from esparto grass … … … 134Figure 5.3: Reduced viscosity versus concentration of Polystyrene… … … .… … ..138
Figure 5.4: FTIR spectrum of Cellulose fibres with KBr… … … ...139
Figure 5.5: FTIR spectrum of Polyacrylamide (PAM) Film… … … ..139
Figure 5.6: FTIR spectrum of Polystyrene (PAM) Film… … … 139
Figure 5.7: FTIR spectrum of arid soil with (Polyacryalamide + Cellulose)… … … .140
Figure 5.8: FTIR spectrum of semiarid soil with (Polyacryalamide + Cellulose)… … … … ..140
Figure 5.9: TGA curve of Polystyrene (PS)… … … ... 142
Figure 5.10: TGA curve of Cellulose Alfa-Alfa… … … 142
Figure 5.11: TGA curve of PAM… … … ... 142
Figure 5.12: TGA curve of arid soil… … … ... 143
Figure 5.13: TGA curve of semiarid soil… … … ... 143
Figure 5.14: TGA curve of arid soil with (PAM + Cellulose)… … … ... 144
Figure 5.15: TGA curve of semiarid soil with (PAM+ Cellulose)… … … 144
Figure 5.16: DSC curves of Polystyrene (PS)… … … 145
Figure 5.17: DSC curves of PAM… … … .. 145
Figure 5.18: DSC curves of Cellulose Alfa-Alfa… … … ... 145
Figure 5.19: DSC curves of semiarid soil with (PAM + Cellulose)… … … ...146
Figure 5.20: DSC curves of arid soil with (PAM+ Cellulose)… … … ...146
Figure 5.21: X-ray diffractograms of PS… … … ... 147
Figure 5.22: X-ray diffractograms of Cellulose… … … .… … … 147
Figure 5.23: X-ray diffractograms of PAM… … .… … .… … … .… … … .147
Figure 5.24: Scanning electron micrographs of Semi arid soil… … … ...… … 148
Figure 5.25: Scanning electron micrographs of arid soil… … … .. 148
Figure 5.26: Scanning electron micrographs of Cellulose Alfa-Alfa… … … 148
Figure 5.27: Scanning electron micrographs of S1 with (PAM + Cellulose)… … … 149
Figure 5.28: Scanning electron micrographs of S2 with (PAM + Cellulose)… … … ... 149
Figure 5.29: polystyrene obtained by casting method… … … .. 149
Figure 5.30: water retention at arid soil… … … .… … … 150
Figure 5.31: water retention at semiarid soil… … … . 150
Figure 5.32: Blend mulching of polyacrylamide-cellulose fibre… … … 151
Effect at daily clay soil (S2) cumulative evaporation. Figure 5.33: Blend mulching of polyacrylamide-cellulose fibre… … … 151
Effect at daily sandy soil (S1) cumulative evaporation Figure 5.34: Cumulative evaporation of arid soil (S1) and semi arid soil (S2)… … … ..152
Figure 5.35: Difference entre cumulative infiltration between sandy… … … .. 153 Soil (S1) and clay soil (S2)
Figure 5.36: Cumulative infiltration of sandy soil (S1) and sandy soil… … … ..153 Treated with (PAM-Cellulose fibre) Blend
Figure 5.37: Cumulative infiltration of clay soil (S2) and clay soil treated with… … … … ...154 (PAM-Cellulose fibre) Blend
Figure 5.38: The surface of arid soil treated with polyacrylamlide-cellulose blend… … .… ..154 Figure 5.39: The surface of semiarid soil treated with polyacrylamlide-cellulose… … … .… 155 Figure 5.40: protocol suggested for PAM - Fiber cellulose blend… … … ..155
GENERAL
INTRODUCTION
Algeria, among the Maghreb countries, that is affected by climatic changes leading to an ecological mutation of ecosystem. The observations conclude that an increasing degradation of soils in a various zone known by their agricultural [1] lossof their fertility and
productivity [2]. The sandy soils are very exposed to this degradation, strongly marked by the drought agressivity [3], which returns them in water deficit and poor fertilizing [4]. So, the characterization of soils like for natural resources is one of important data, principally in the project of durable development of countries [5].
As our agricultural land and water resources are becoming more strained, conservation of them is becoming an increasingly important topic. Alternative cropping systems and
management styles are being tested to protect crops while helping conserve soil and water by improving soil properties.
Arid lands have always been important to the world's human population, but their significance has increased over the past few decades because of the augmentation of population
demographics and continuity of the use of natural resources [6].
Arid and semi arid soil are characterised by irregularity and shortage of rainfall and prolonged dry seasons, high temperature and high evaporation. Such variation in climatic factors makes dry lands more fragile and prone to land degradation and desertification. Soil degradation threatens water quality and agricultural productivity through the loss of valuable top soil. Arid and semi-arid lands cover approximately one third of the continental surface of the earth. They include the deserts and their semi-arid and sub-humid dry margins and the subtropical Mediterranean latitudes. The productivity of coarse textured soils is mostly limited by their low water holding capacity and excessive deep percolation losses. One of the most serious consequences of desertification is a decline in food production. According to UN 70 % (3,600 million ha) of the dry lands are already in some stages of degradation associated with enormous direct loss in income and indirect economic and social costs for the people affected [7].
Increase in the human population of the world demands an increase in food production where as land deterioration is causing a significant amount of decrease in yield. It is becoming harder to produce enough food for world population in the future than it was in past.
To combat the pressure of a burgeoning world population it has become a necessity today to increase the agricultural production both through irrigated agriculture and also by the
development of lands that were previously considered as arid.
Sandy soil usually have a poor properties i.e., low specific surface area , low water retention , low organic matter content , low fertility and high infiltration rate .
These poor physical proprieties cause inefficient water use, especially in arid and semi arid regions [8].The vulnerable areas exist in Africa, Asia, America, Australia, and Mediterranean countries. Given the vulnerability of these lands to degradation, it is estimated that some 44 million km2 ~ 34% of the total world’s area, supporting 2.6 billion people, is at risk from
desertification [9]. Many of the world’s arid regions are well suited to intensive agriculture except for lack of water. In view of the limited water resources, there is a growing need to conserve soil water in arid lands. Bare soil forms an important part of the surface cover in Mediterranean arid and semiarid areas.
Irrigation redresses partly this balance but it is an inefficient process unless positive steps are taken to reduce water loss by evaporation and deep percolation.
The use of plastics mulch results in 50 % saving of irrigation water and as much as 30 % saving in nitrogenous fertilisers even in temperate climates. Arid lands have always been important to world's human population, but their significance has increased over the past few decades because of population demographics and continued use of natural resources [6]. These savings may be appreciably higher in arid climates and in some desert regions, agriculture can now be carried out successfully on land which previously barren.
We can treat these lands by using abundant, inexpensive and environment-friendly polymers and biopolymers.
Polymers and biopolymers have long been recognised as viable soil conditioners, because they stabilise Soil surface structure and pore continuity.
Polyacrylamide was effective in enhancing the stability of soil aggregates [10] and increase soil infiltration in some areas especially in sandy loam soils [11, 12]
Polyacrylamide is a long-chain synthetic polymer that acts as a strengthening agent, binding soil particle together and holding soils in place, but polyacrylamide alone not remediate poor Soil structure [13].In North Africa, the esparto grass constitutes an essential element of fight against the turning into a desert and an essential factor of the maintenance of balance pastoral. The aim of this thesis is to study the using renewable resources of extracted cellulose fiber and polyacrylamide to treat arid and semi arid soil to retain water.
The general objective of this study was to produce a series of low costs polymers and biopolymers to alleviate some poor physical properties of sandy soils such as low water retention and inefficient water use, especially in arid and semiarid regions such as in Algeria Conditions. Polystyrene used as impermeable subsurface layer barrier for water movement during irrigation or rainfall avoid also deep percolation of water.
This thesis is organized as follows:
Chapter I: introduces the most important general review of arid and semiarid regions with soil physical and chemical proprieties.
In Chapter II: focuses general concepts of soil conditioners especially polymers, biopolymers and cellulose fiber.
Chapter III: The concepts of a wide variety of analysis techniques used to characterize polymers synthesized such as Thermal Analysis, Infra-Red Spectroscopy, Viscosity, X-ray diffraction (XRD) and Scanning Electron Microscopy (SEM) are explained.
Other techniques used to characterize metals and compounds of soils and fiber are presented Like atomic absorption and flame emission spectroscopy.
In Chapter 4:In this experimental part before the preparation of polymer blend from
Polyacrylamide and cellulose fibre we characterized soils , polymers and cellulose fibre from Alfa grass then the blend were sprayed at arid and semi arid soil surface , finally we do experiments the effectiveness of blend prepared to retain humidity and water at the soil Chapter 5: discusses the study of synthesis, characterisation of polymer blend in soil Finally, the Thesis is summarized
OBJECTIVES
The scope of this work reported in this thesis is to study the perspectives of using
Polymer- cellulose fiber blends for water management and to improve soils physical structure and proprieties at arid and semiarid regions. Thus the management of these soils must aim at increasing their water holding capacity and reducing losses due to deep percolation.
The arid and semi arid soils have a climate characterized by high winds that promote evaporation and deep percolation which makes water holding capacity lower of these soils characterized by coarse textured soils. In the objective to improve the efficiency water use by plants in these regions we prepared different polymers and biopolymers from renewable resources. Those natural fibers are
Low-cost and environmental -friendly to alleviate and to improve the physical and chemical characteristics of these arid soils in order to achieve a sustainable agricultural production.
CHAPTER I
CHAPTER I
I. ARID AND SEMI ARID REGION
I.1. INTRODUCTION
The arid and semi-arid regions constitute roughly one third of the total earth surface. In these regions water scarcity is one of the main limiting factors for economic growth.
General data show that 64 % of arid zones and 97 % of more arid zones in the world are concentrated in Africa and Asia [14]. In Algeria, arid and semi arid areas cover approximately 95 % of the country [15, 22]. Soils of this region mainly differ from those of humid regions by their sandy character and thus by significant properties associated with an insufficient of water supply [16]. Low content of organic matter (< 1%), CEC (< 1 meq.100 /g of soil), and a small holding capacity as well as energy retention of water, and mineral nutrients are some of the properties that limit agriculture in those regions.
There over, the global availability of water in the world is constantly decreasing where as the needs of water for agriculture are constantly growing. This situation underlies an extreme challenge for many countries and especially affects those of North Africa [17, 18].
I. 2. Arid and semi - arid regions
Climates can be classified on the basis of temperature, barometric pressure, humidity, sunshine, evaporation, rainfall and prevailing winds in a particular place or region. From the Viewpoint of irrigation, the classification based on rainfall is reasonable [19].
a.a.r. < 40 cm arid climate
a.a.r. = 40-75 cm semi-arid climate a.a.r. > 75 cm humid climate
I.2.1. Definitions and degrees of aridity
Arid implies prolonged dryness, and is used with respect to the climate and the land below it In such regions the ability to produce agricultural crops is restricted. Usually on arid lands The potential of evaporation of water from the land exceeds the rainfall [8].
Table 1.1: Classification of deserts according to their level of aridity [20], following the scheme of United Nations Environment Programme (1992).
The last column indicates the percentage of land area that is currently occupied by these various categories. AI = aridity index.
I.2.2. Arid Soil
A region is said to be arid when it is characterized by a severe lack of available water, to the extent of hindering or even preventing the growth and development of plant and animal life. As a result, environments subject to arid climates tend to lack vegetation and are called xeric or desert regions.
Deforestation and degradation of tree and shrub formations (mainly for conversion to
agricultural use) and overexploitation of forests and woodlands (through fuel wood collection and overgrazing) are among the major causes of soil degradation in arid areas [8]
.
I.3. Desertification
Desertification is the process of ecological degradation by which economically productive land becomes less productive, in some cases leading to the development of a desert-like landscape. More specifically, desertification may be defined as land degradation in arid, semiarid, and sub humid areas resulting from climatic variation and human activities [21]. Desertification is a combination of drought and mismanagement of land and occurs mainly in hyper arid, arid, semiarid zones, ranging from precipitation: potential evapo-transpiration indices (P: PET) of less than 0.05 to 0.70 [8].
I.3.1. Desertification and arid lands in Algeria
InAlgeria, arid and semi-arid regions occupy over than 95 % ofwhole territory one of the most important problems facing Algeria as well as North Africa is the threat of continued drought and desertification resulting in destruction of natural resources, agricultural lands and in political and social disturbances [15, 22].
Most Scientists agree that weather fluctuation or cyclic drought of one or more years and Land misuses are the actual causes of desertification particularly in arid regions of Algeria.
Desertification refers to the process associated with drought and loss of fertility by which soil becomes unable to grow significant amounts of plant life.
Desertification involves a number of interrelated factors, including erosion, climate variations, water availability, loss of fertility, loss of soil humus, and deterioration of soil chemical properties [23].
I.4. DROUGHT
Drought affecting semi-arid regions is considered one of the main causes of desertification encroachment.
Drought can be attributed to inadequate seasonal precipitation, a prolonged dry season or a series of sub average rainy seasons. Annual rainfall analysis of a number of countries in the North Africa Sub-Region (Algeria, Egypt, Libya, Mauritania, Morocco, Sudan and Tunisia) demonstrates a high variability in its temporal and spatial distribution.
The ensuing drought, in varying degrees of frequency and severity, is a common phenomenon in the sub-region.
I.4.1. DEFINITION OF DROUGHT
The definition of drought is not very simple, and the question “What is drought?” continues to pose a problem [24]. This is because drought could mean different things to different people, and there are probably as many definitions of drought as there are users of water. In general, a drought is when a shortfall in precipitation creates a shortage of water, whether it is for crops, utilities, municipal water supply, recreation, wildlife, or other purposes. According to a WMO definition “drought is a sustained, extended deficiency in precipitation.” [25].
Operational definitions of drought vary from place to place and are crucial to identify the beginning and intensity of drought. There are three main types of drought: meteorological, agricultural, and hydrological [26].
a. Meteorological drought: is an expression of rainfall departure from normal over
some period of time. Meteorological drought definitions are usually region specific and are based on a thorough understanding of the climatology of the region.
b. Agricultural drought: occurs when there is not enough soil moisture to meet the
c. Hydrological drought: refers to deficiencies in surface and subsurface water
supplies. It is measured as stream flow and as lake, reservoir, and groundwater levels [26, 27].
I.5. Soil
Soil, consisting of finely divided layer of weathered minerals and organic matter upon which plants grow, is the most fundamental requirement for agriculture.
Soils are formed by the weathering of parent rocks as the result of interactive geological hydrological and biological process.
Soils are porous and are vertically stratified into horizons as a result of downward-percolating water and biological processes, including the production and decay of biomass.
Soils are open systems that undergo continual exchange of matter and energy with the atmosphere, hydrosphere, and biosphere [28].
I.5.1. Nature and composition of soil
Soil is a variable mixture of minerals, organic matter, and water capable of supporting plant Life on the earth’ s surface.
It is the final product of the weathering action of physical, chemical, and biological process on rocks, which largely produces clay minerals.
The organic portion of soil consists of plant biomass in various stages of decay and high populations of bacteria, fungi, and animals such as earthworms [29].
Soil contains air spaces and generally has loose texture (Figure 1.1).
Figure1.1: Fine structure of soil, showing solid, water, and air phase
Typical soils exhibit distinctive layers with increasing depth (Figure 1.2).
These layers are called Horizons. Horizons form as the result of complex interactions among process that occur during weathering.
Rainwater percolating through soil carries dissolved and colloidal solids to lower horizons where they are deposited.
The top layer of soil, is known as the A horizon, or top soil, this is the layer of maximum biological activity in the soil and contains most of the soil organic matter. Metal ions and clay particles in the A horizon are considerable leaching.
The next layer is the B horizon, or subsoil .it receives material such as organic matter, salts and clay particles leached from the topsoil.
The C horizon is composed of weathered parent rocks from which the soil originated.
Figure 1.2: Soil Profile showing soil horizons.
Soils exhibit a large variety of characteristics that are used for their classification for various purposes [30].
I.5.2. Soil Phases
Soils comprise three phases: the solid, the liquid and the gaseous phases: a. Solid phase
Solid phase includes the mineral particles of gravel, sands, silts and clays. Particle-size properties are determined from the size distribution of individual particles in a soil sample. The mineral particles along with the interconnecting pores form the soil matrix. The solid phase usually includes organic material and the fraction is called humus content.
b. Liquid phase
The liquid phase usually consists of water that can move through the pores of the soil.
Other liquids may be present. They may be miscible or immiscible in water and generally result from agricultural and industrial activities.
c. Gaseous phase
The principal component of the gaseous phase is air. Like water, air can also move through the soil and contains other dissolved gases like water vapor and volatile components, usually of pollutants.
I.5.3. Soils components
Most soils consist of four components and three phases (Figure 1.3) [31]. The four components include inorganic solids, organic solids, water and air.
Inorganic components are primary and secondary minerals derived from the parent
material.
Organic components are derived from plants and animals.
Liquid component consists of a dilute aqueous solution of inorganic and organic
compounds.
Gaseous component includes soil air comprising a mixture of some major
(e.g., nitrogen, oxygen) and trace gases (e.g., carbon dioxide, methane, nitrous oxide)
Figure 1.3: Soil is made up of four components and three phases.
I.5.3.1. Solid components
Soil solids, comprising inorganic and organic components, form the matrix or the body of most soils. This matrix, or the visible part of the soil, is the storehouse of water and nutrient
elements (e.g., N, P, K, Ca, Mg, Zn, Cu, etc.). It is also the site of most processes that govern soils buffering and filtering capacity, and life support capability [31].
Solid components (inorganic and organic) constitute about 50 % of the total volume, while liquid and gases comprise 25 % each (Figure. 1.4a).
a. Organic components: The organic component for most mineral soils is about 5 % or less. Immediately after rain or irrigation, the entire pore space or the voids in between the solids are completely filled with water, and the soil is saturated (Figure.1.4b).
When completely dry, the water in the pores is replaced by air or gases (Figure.1.4c).
b. Inorganic Components: The inorganic components comprise more than 95% by weight of total solid fraction for most mineral soils. It is the product of weathering of parent material, and comprises a range of primary and secondary minerals. Important properties of the inorganic components are:
(i) Size, (ii) shape, (iii) surface area, (iv) clay minerals and charge properties, (v) swelling and shrinkage, (vi) water absorption and heat of wetting, and (vii) packing arrangement [31].
Figure 1.4: Interaction among four components and three phases for (a) Moist, (b) water-saturated and (c) completely dry soil [31].
I.5.3.2. Water and Air in Soil
Large quantities of water are required for the production of most plant materials. For example, several hundred kg of water are required to produce one kg of dry hay. Water is part of the three-phase, solid-liquid-gas system making up soil. It is the basic transport medium for carrying essential plant nutrients from solid soil particles into plant roots and to the farthest reaches of the plant’ s leaf structure (Figure1.5).
The water enters the atmosphere from the plant’ s leaves, a process called transpiration. Normally, because of the small size of soil particles and the presence of small capillaries and pores in the soil, the water phase is not totally independent of soil solid matter.
The availability of water to plants is governed by gradients arising from capillary and
gravitational forces. The availability of nutrient solutes in water depends upon concentration gradients and electrical potential gradients. Water present in larger spaces in soil is relatively more available to plants and readily drains away. Water held in smaller pores or between the unit layers of clay particles is held much more strongly. Soils high in organic matter may hold appreciably more water than other soils, but it is relatively less available to plants because of physical and chemical sorption of the water by the organic matter [30].
Figure 1.5: Plants transport water from the soil to the atmosphere by transpiration.
Nutrients are also carried from the soil to the plant extremities by this process. Plants remove CO2 from the atmosphere and add O2 by photosynthesis. The reverse occurs during plant
I.5.3.3. Water Movement in soil
Soil water enters and moves through soil in response to changes in potential energy or the energy status of water.
Water movement is always down gradient in terms of potential energy, meaning water flows from higher to lower potential energy.
Depending on the direction of the potential energy gradient, water flow may be downward, horizontal or upward (Figure 1.6).
Downward flow occurs under the force of gravity and is predominantly in the large (macro) pores of saturated soils, whereas horizontal and upward flows are the result of capillary forces.
Figure 1.6: Examples of water flow in soils
A- Downward water flow, B-Evaporation, C-Lateral water flow [32].
I.5.4. Particle Size Distribution
Particle size is an important soil physical property. It affects total porosity, pore size, and surface area. Particle size distribution refers to the quantitative measure of the particle size that constitutes the solid fraction.
In contrast, soil texture refers to a qualitative measure of particle sizes based on feel of the soil material, which may be coarse, gritty, fine, or smooth.
I.5.4.1. Particle Size Fractions
Depending on the size distribution, soils are usually divided into three classes, e.g., sand, silt, and clay. There are numerous systems of classifying separates into different size classes.
The two most commonly used systems by soil scientists and agronomists are the USDA (U.S. Department of Agriculture) and the International Society of Soil Science (ISSS) Three principal textural classes of < 2 mm components or the soil fraction are (i) Sand, (ii) Silt, and (iii) clay but Material >2mm is considered the non soil fraction.
Table 1.2: Two Widely Used Systems of Particle Size Distribution
I.5.4.2. Particle Size Analysis
The data are commonly expressed by Textural Classes.
Quantitative information on particle size distribution is used to express the data into textural classes using numerical limits or scale for different systems, based on the textural triangle
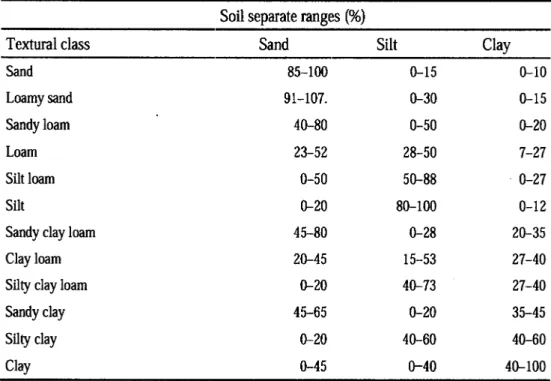
Table 1.3: Common Textural Classes Depending on the Relative Distribution of Sand, Silt and Clay
I.6. Soil physical properties
The important physical properties of a soil are:
Texture Aggregation Structure Porosity I.6.1. Texture
The relative amounts of the different soil size (< 2 mm) particles, or the fineness or coarseness of the mineral particles in the soil, is referred to as soil texture. Mineral grains which are >2 mm in diameter are called rock fragments and are measured separately. Soil texture is determined by the relative amounts of sand, silt, and clay in the fine earth (< 2 mm) fraction.
a. Sand particles
Sand particles vary in size from very fine (0.05 mm) to very coarse (2.0 mm) in average diameter. Most sand particles can be seen without a magnifying glass. Sands feel coarse and gritty when rubbed between the thumb and fingers.
b. Silt particles
Silt particles range in size from 0.05 mm to 0.002 mm. When moistened, silt feels smooth but is not slick or sticky. When dry, it is smooth and floury and if pressed between the thumb and finger will retain the imprint.
c. Clay
Clay is the finest soil particle size class. Individual particles are finer than 0.002 mm. Clay particles can be seen only with the aid of an electron microscope. They feel extremely smooth or powdery when dry and become plastic and sticky when wet.
I.6.1.2. Determining textural class with the textural triangle
There are 12 primary classes of soil texture defined by the USDA (Soil Survey Division Staff, 1993). The textural classes are defined by their relative proportions of sand, silt, and clay as shown in the USDA textural triangle (Figure 1.7). Each textural class name indicates the size of the mineral particles that are dominant in the soil should be quantified by laboratory particle size analysis.
Figure 1.7: The USDA textural triangle (Soil Survey Division Staff, 1993) [33].
I.6.1.3. Effects of texture on soil properties
Water infiltrates more quickly and moves more freely in coarse-textured or sandy soils, which increases the potential for leaching of mobile nutrients. Sandy soils also hold less total water and fewer nutrients for plants than fine-textured soils.
I.6.2. Soil Aggregate
A soil aggregate is defined as many soil particles held in a single mass or cluster.
Pore space created by binding these particles together improves retention and exchange of air and water. Stability of soil aggregate refers to the ability of soil aggregates to resist disruption when outside forces are applied.
Figure1.8: Structure of soil aggregate [34].
I.6.3. Soil structure
Soil structure describes the arrangement of the solid parts of the soil and of the pore space located between them. From an agricultural perspective a good soil structure when it is of an aggregated, low density / high porosity condition. A well structured soil will enable robust biological activity by readily accepting, storing, and transmitting water, gases, nutrients, and energy; and by providing adequate and suitable surfaces and space for life and biochemical exchanges.
I.6.3.1. Effects of structure on soil properties
The structure of the soil affects pore space size and distribution and therefore, rates of air and water movement. Well-developed structure allows favorable movement of air and water, while poor structure retards movement of air and water. Since plant roots move through the same channels in the soil as air and water, well-developed structure also encourages extensive root development.
Water can enter a surface soil that has granular structure (particularly fine-textured soils) more rapidly than one that has relatively little structure.
Surface soil structure is usually granular, but such granules may be indistinct or completely absent if the soil is continuously tilled, or if organic matter content is low.
The size, shape, and strength of subsoil structural peds are important to soil productivity. Sandy soils generally have poorly developed structure relative to finer textured soils, because of their lower clay content.
I.6.4. Soil porosity
Soil porosity or pore space, is the volume percentage of the total soil that is not occupied by solid particles. Pore space is commonly expressed as a percentage:
% Pore space = 100 - [(bulk density / particle density) x 100] (1.1)
I.6.4.1. Bulk density
Is the dry mass of soil solids per unit volume of soils, and particle density is the density of soil solids. Bulk densities of mineral soils are usually in the range of 1.1 to 1.7 g/cm3. A soil with a bulk density of about 1.32 g /cm3 will generally possess the ideal soil condition of 50 % solids and 50 % pore space.
Bulk density varies depending on factors such as texture, aggregation, organic matter, compaction / consolidation, soil management practices, and soil horizon.
I.7. Soil organic matter
Soil organic materials consist of plant and animal residues in various stages of decay. Primary sources of organic material inputs are dead roots, root exudates, litter and leaf drop, and the bodies of soil animals such as insects and worms. Earthworms, insects, bacteria, fungi, and other soil organisms use organic materials as their primary energy and nutrient source. Nutrients released from the residues through decomposition are then available for use by growing plants.
Soil organic matter performs many beneficial functions in soil. It provides nutrients, holds water and improves soil porosity by preventing clay particles from sticking to each other.
I.7.1. Effect of organic matter on soil properties
Adequate soil organic matter levels benefit soil in several ways. The addition of organic matter improves soil physical conditions, particularly aggregation and pore space.
This improvement leads to increased water infiltration, improved soil tilth, and decreased soil erosion. Organic matter additions also improve soil fertility, since plant nutrients are released to plant-available mineral forms as organic residues are decomposed (or mineralized). A mixture of organic materials in various states of decomposition helps maintain a good balance of air and water components in the soil. In coarse-textured soils, organic material bridges some of the space between sand grains, which increases water-holding capacity. In fine-textured soil, organic material helps maintain porosity by preventing fine soil particles from compacting.
I.7.2. Importance of soil organic matter
Organic matter is an important constituent of soil. In the broadest context, organic matter may be referred to as the total complement of organic substances in the soil, including living organisms of various sizes, organic residues in various stages of decomposition and dark colored humus consisting of non-humic and humic substances. Humus is relatively stable and has a major effect on soil characteristics and processes that play a role in soil quality [35]. Organic matter influences properties of especially mineral soils disproportionately to the quantities present: it is a major source of nutrients and microbial energy, holds water and nutrients in available form, usually promotes soil aggregation and root development and improves water infiltration and water use efficiency [36].The quality of a soil can be defined as its capacity to sustain biological productivity, maintain environmental quality, and promote plant, animal and human health [37].
Organic matter serves as a reservoir of nutrients essential for plant growth, provides exchange sites for the retention of cations and anions, acts as a source for storage and cycling of
nutrients in the soil-plant system [38].
A decrease in soil organic matter will result in a decrease of the CEC and hence the nutrient holding capacity of the soil [39].
Organic matter contains various amounts of C, H, O, N, P, K, S and traces of other elements. [40].The actual amounts of especially N, P and S available for plants are determined in part by the total level of organic matter and its rate of decomposition as organic matter is the center of biotic activity in the soil that governs this process [41].
Organic matter also has a tremendous effect on soil water management particularly in semiarid regions, because it increases infiltration and water holding capacity [42]. Enhanced soil water-holding capacity resulted from organic matter more readily absorbs
Hudson [43] showed that for 1% increase in organic matter, the available water holding capacity in the soil increased by 3.7% on a volume basis. Similarly, Brady [44] concluded that organic matter can absorb up to 90% of its weight as water which substantially increases the water holding capacity of mineral soils.
All these factors contribute to improved soil-plant-water relationships which will enhance crop productivity on sustainable basis.
I.8. Water-holding capacity
Soil water-holding capacity is determined largely by the interaction of soil texture, bulk density / pore space, and aggregation. Sands hold little water because their large pore spaces allow water to drain freely from the soils. Clays adsorb a relatively large amount of water, and their small pore spaces retain it against gravitational forces. However, clayey soils hold water much more tightly than sandy soils, so that not all the moisture retained in clayey soils is available to growing plants.
I.9. Soil chemical properties
Soil chemical properties, therefore, reflect the influence of the soil minerals and organic materials on the soil solution [45].
I.9.1. pH
PH is an indication of the relative acidity or alkalinity of the soil.
The soil pH considerably affects soil characteristics. It is important for many soil-forming processes and it also affects the biological activity of soil organisms. The soil pH directly affects particularly the solubility of many substances, ion adsorption and desorption, coagulation and peptisation of colloids and chemical reactions. By its action on the soil structure it also affects most of the physical properties of the soil. Thus, the soil pH is an important parameter of the soil fertility.
The active soil acidity is determined by H+ (or more precisely H
3O+) and OH- ions, present in
Free State in the soil solution. It is mostly evaluated on the basis of the soil filtrate [46].
I.9.2. Soil Porosity
The soil porosity is the total volume of pores in the soil mass expressed as a percentage of the total intact earth volume. The pores in the soil have different shapes and sizes and they are filled either with water or with air.
![Figure 1.9.Measurement of infiltration in soil columns using a Marriott bottle technique [31]](https://thumb-eu.123doks.com/thumbv2/123doknet/14473093.714544/46.892.289.599.202.564/figure-measurement-infiltration-columns-using-marriott-bottle-technique.webp)
![Figure 2.1: Superabsorbent Cross-linked Polyacrylamide in dry state (left) and hydrated state (right); scale in centimeters [8]](https://thumb-eu.123doks.com/thumbv2/123doknet/14473093.714544/55.892.244.654.126.471/figure-superabsorbent-cross-linked-polyacrylamide-state-hydrated-centimeters.webp)
![Figure 2.9: Conversion of cellulose to regenerated cellulose (viscose) using caustic soda [97]](https://thumb-eu.123doks.com/thumbv2/123doknet/14473093.714544/66.892.199.671.112.363/figure-conversion-cellulose-regenerated-cellulose-viscose-using-caustic.webp)
![Figure 2.11: Representation of lignin molecules from wheat straw [100].](https://thumb-eu.123doks.com/thumbv2/123doknet/14473093.714544/68.892.224.646.122.599/figure-representation-lignin-molecules-wheat-straw.webp)

![Table 2.5: Potential benefits and manageable adverse impacts of using PAM for land and water management [134]](https://thumb-eu.123doks.com/thumbv2/123doknet/14473093.714544/82.892.107.745.318.754/table-potential-benefits-manageable-adverse-impacts-using-management.webp)
![Figure 2.17: Sources of cellulose fibres from various parts of plants [137]](https://thumb-eu.123doks.com/thumbv2/123doknet/14473093.714544/85.892.121.714.623.1005/figure-sources-cellulose-fibres-from-various-parts-plants.webp)
![Figure 2. : Classification of natural fibers [140].](https://thumb-eu.123doks.com/thumbv2/123doknet/14473093.714544/89.892.134.740.130.472/figure-classification-natural-fibers.webp)
![Table 2.8: World-wide hard wood and non-wood pulp and paper [149]](https://thumb-eu.123doks.com/thumbv2/123doknet/14473093.714544/93.892.252.640.956.1115/table-world-wide-hard-wood-wood-pulp-paper.webp)
