HAL Id: tel-00981136
https://tel.archives-ouvertes.fr/tel-00981136
Submitted on 21 Apr 2014
HAL is a multi-disciplinary open access archive for the deposit and dissemination of sci-entific research documents, whether they are pub-lished or not. The documents may come from teaching and research institutions in France or abroad, or from public or private research centers.
L’archive ouverte pluridisciplinaire HAL, est destinée au dépôt et à la diffusion de documents scientifiques de niveau recherche, publiés ou non, émanant des établissements d’enseignement et de recherche français ou étrangers, des laboratoires publics ou privés.
Portability over Parallel High Performance Systems
Laércio L. Pilla
To cite this version:
Laércio L. Pilla. Topology-Aware Load Balancing for Performance Portability over Parallel High Performance Systems. Distributed, Parallel, and Cluster Computing [cs.DC]. Université de Grenoble; UFRGS, 2014. English. �tel-00981136�
Université Joseph Fourier / Université Pierre Mendès France / Université Stendhal / Université de Savoie / Grenoble INP
THÈSE
Pour obtenir le grade de
DOCTEUR DE L’UNIVERSITÉ DE GRENOBLE
p
réparée dans le cadre d’une cotutelle entre
l’Université de Grenoble et Universidade Federal do
Rio Grande do Sul
Spécialité : Mathématiques-informatique
Arrêté ministériel : le 6 janvier 2005 -7 août 2006
Présentée par
Laércio LIMA PILLA
Thèse dirigée par Jean-François MÉHAUT et Philippe O. A. NAVAUX
préparée au sein du Laboratoire d’Informatique de Grenoble dans l’École Doctorale Mathématiques, Sciences et
Technologies de l’Information, Informatique et Programa de Pós-Graduação em Computação
Topology-Aware Load
Balancing for Performance
Portability over Parallel High
Performance Systems
Thèse soutenue publiquement le XX avril 2014, devant le jury composé de :
M. Raymond NAMYST
Professeur, Université de Bordeaux 1, Rapporteur
M. Wagner MEIRA JUNIOR
Professeur, Universidade Federal de Minas Gerais (UFMG), Rapporteur
M. Alfredo GOLDMAN VEL LEJBMAN
Professeur, Universidade de São Paulo (USP), Examinateur
M. Nicolas MAILLARD
Professeur, Universidade Federal do Rio Grande do Sul (UFRGS), Examinateur
M. Jean-François MÉHAUT
Professeur, Université de Grenoble - CEA, Directeur de thèse
M. Philippe O. A. NAVAUX
Professeur, Universidade Federal do Rio Grande do Sul (UFRGS), Directeur de thèse
PROGRAMA DE PÓS-GRADUAÇÃO EM COMPUTAÇÃO
LAÉRCIO LIMA PILLA
Topology-Aware Load Balancing for
Performance Portability over
Parallel High Performance Systems
Thesis presented in partial fulfillment of the requirements for the degree of Doctor of Computer Science
Prof. Philippe Olivier Alexandre Navaux Advisor
Prof. Jean-François Méhaut Advisor
Laércio Lima Pilla,
Topology-Aware Load Balancing for Performance Portability over
Parallel High Performance Systems /
Laércio Lima Pilla. – Porto Alegre: Programa de Pós-Graduação em Computação da UFRGS, 2014.
115 f.: il.
Thesis (Ph.D.) – Universidade Federal do Rio Grande do Sul. Programa de Pós-Graduação em Computação, Porto Alegre, BR– RS, 2014. Advisor: Philippe Olivier Alexandre Navaux; Advisor: Jean-François Méhaut.
1. Computer architecture, Parallel programming, Profiling, Scheduling. I. Navaux, Philippe Olivier Alexandre. II. Méhaut, Jean-François. III. Título.
UNIVERSIDADE FEDERAL DO RIO GRANDE DO SUL Reitor: Prof. José Carlos Alexandre Netto
Pró-Reitor de Coordenação Acadêmica: Prof. Rui Vicente Oppermann Pró-Reitor de Pós-Graduação: Prof. Vladimir Pinheiro do Nascimento Diretor do Instituto de Informática: Prof. Luís da Cunha Lamb
Coordenador do PPGC: Prof. Luigi Carro
LIST OF ABBREVIATIONS AND ACRONYMS . . . 5 LIST OF FIGURES . . . 7 LIST OF TABLES . . . 9 ABSTRACT . . . 11 1 INTRODUCTION . . . 13 1.1 Problem statement . . . 14
1.2 Objectives and thesis contributions . . . 14
1.3 Research context . . . 15
1.4 Document organization . . . 15
2 BACKGROUND . . . 17
2.1 Components of high performance computing platforms . . . 17
2.1.1 Composition . . . 18
2.1.2 Asymmetry and nonuniformity at topology levels . . . 21
2.2 Characterization of scientific applications . . . . 22
2.2.1 Tasks: load and communication . . . 22
2.2.2 Application irregularity and dynamicity . . . 23
2.2.3 Examples of scientific applications . . . 25
2.3 Task mapping . . . 26
2.3.1 Load imbalance and costly communications . . . 26
2.3.2 Performance portability . . . 27
2.3.3 Information required for mapping tasks . . . 28
2.4 Machine topology identification . . . . 29
2.4.1 Hierarchy perception . . . 29
2.4.2 Communication cost scanning . . . 30
2.5 Discussion . . . 31
3 MODELING THE TOPOLOGIES OF HPC PLATFORMS . . . 33
3.1 Topology representation . . . 33
3.1.1 Topology tree . . . 33
3.1.2 Communication costs . . . 34
3.2 Topology modeling . . . 35
3.2.1 Memory hierarchy of multicore platforms . . . 35
3.2.2 HPC network topology . . . 37
3.3.3 Nonuniformity measurement at memory level . . . 42
3.4 Machine topology library . . . 45
3.4.1 Tools . . . 45
3.4.2 Data storage . . . 45
3.4.3 Library interface . . . 46
4 PROPOSED LOAD BALANCING ALGORITHMS . . . 47
4.1 Centralized algorithms . . . 47
4.1.1 NUCOLB: Nonuniform communication costs load balancer . . . 48
4.1.2 HWTOPOLB: Hardware topology load balancer . . . 51
4.1.3 Comparison between proposed centralized algorithms . . . 56
4.2 Hierarchical algorithms . . . 56
4.2.1 HIERARCHICALLB: Hierarchical load balancer composition . . . 56
4.3 Implementation details . . . 59
4.4 Conclusion . . . 62
5 RELATED WORK ON TASK MAPPING . . . 63
5.1 Load balancing algorithms . . . 63
5.1.1 Graph partitioning . . . 64
5.1.2 Runtime level load balancers . . . 65
5.1.3 Application-focused load balancers . . . 68
5.2 Work stealing . . . 69 5.3 Process mapping . . . 72 5.4 Discussion . . . 73 6 PERFORMANCE EVALUATION . . . 79 6.1 Evaluation methodology . . . 79 6.1.1 Experimental platforms . . . 79
6.1.2 Benchmarks and applications . . . 80
6.1.3 Load balancers . . . 82
6.1.4 Experimental setup . . . 82
6.2 Load balancing on multicore machines . . . 83
6.2.1 NUCOLB . . . 84
6.2.2 HWTOPOLB . . . 89
6.2.3 NUCOLB and HWTOPOLB . . . 92
6.3 Load balancing on clusters . . . 94
6.3.1 NUCOLB . . . 95
6.3.2 HWTOPOLB . . . 96
6.3.3 HIERARCHICALLB . . . 99
6.4 Conclusion . . . 102
7 CONCLUSION AND PERSPECTIVES . . . 105
7.1 Contributions . . . 105
7.2 Perspectives . . . 107
AMPI Adaptive MPI
ASIC Application-Specific Integrated Circuit BC Betweenness Centrality
BRAMS Brazilian developments on the Regional Atmospheric Modeling System BSP Bulk Synchronous Parallel
CN Compute Node
coNCePTuaL Network Correctness and Performance Testing Language C-PML Convolutional Perfectly Matched Layer
CPU Central Processing Unit GPU Graphics Processing Unit
GPPD Parallel and Distributed Processing Group HPC High Performance Computing
HWLOC Portable Hardware Locality
JLPC Joint Laboratory for Petascale Computing LB Load Balancing
LICIA International Laboratory in High Performance and Ambient Informatics LIG Grenoble Informatics Laboratory
LLC Last Level Cache
MPI Message Passing Interface MPIPP MPI Process Placement
MSTII Mathematics, Information Sciences and Technologies, and Computer Science
MTS Multithreaded Shepherds
NAMD NAnoscale Molecular Dynamics
Nanosim Nanosimulations and Embedded Applications for Hybrid Multi-core Ar-chitectures
PPL Parallel Programming Laboratory PM Process Mapping
PU Processing Unit
QPI QuickPath Interconnect RAM Random Access Memory
RAMS Regional Atmospheric Modeling System RTS Runtime System
RTT Round-Trip Time
SMP Symmetric Multiprocessor SMT Simultaneous Multithreading SPMD Single Program, Multiple Data TCP Transmission Control Protocol TLB Translation Lookaside Buffer UDP User Datagram Protocol
UFRGS Federal University of Rio Grande do Sul UMA Uniform Memory Access
XML Extensible Markup Language WS Work Stealing
2.1 Example of machine topology of a UMA machine with 24 PUs dis-tributed in 4 sockets. . . 18 2.2 Example of communication through memory on a UMA machine. . . 19 2.3 Example of a machine topology of a NUMA machine with 24 PUs
distributed in 4 NUMA nodes. . . 19 2.4 Example of communication through memory on a NUMA machine. . 20 2.5 Example of a machine topology with multiple compute nodes.
4 UMA compute nodes are illustrated. . . 20 2.6 Example of communication through network organized as a fat tree. . 21 2.7 Different levels of load irregularity and dynamicity. . . 24 2.8 Different levels of communication irregularity and dynamicity. . . 24 2.9 Challenges for performance portability. . . 28 3.1 Machine topology representation of one socket of machine Xeon24.
Different levels of the cache hierarchy present different latencies and bandwidths. . . 35 3.2 Midpoints for a memory hierarchy including the main memory and
three cache levels. Midpoints represent the middle point in logarithm scale between the sizes of two levels. . . 36 3.3 Memory latency measured with lat_mem_rd for different data
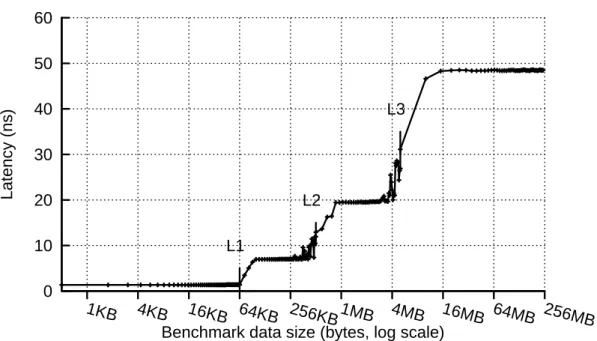
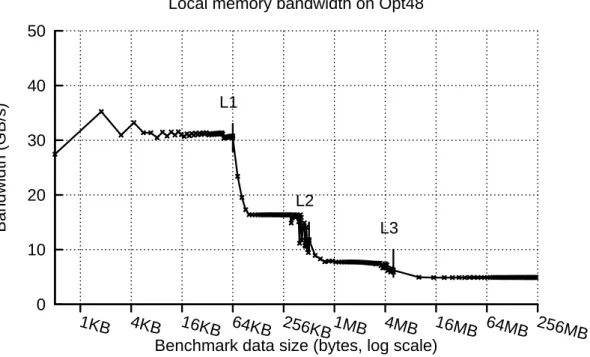
sizes on Opt48. . . 39 3.4 Memory bandwidth measured with bw_mem for different data sizes
on Opt48. . . 40 3.5 Product between memory latency and bandwidth for machine Opt48. 40 3.6 Interconnections of the first eight NUMA nodes of machine Xeon192
based on topology file. . . 43 3.7 Interconnections of the first eight NUMA nodes of machine Xeon192
based on the machine specification of processor nodes. . . 43 4.1 Load balancers simplified class diagram. . . 61 6.1 Execution of lb_test on PUs 4 to 7 of Xeon32, as captured by
Projec-tions. . . 84 6.2 Total execution time of kNeighbor with NUCOLB and other load
bal-ancers. . . 86 6.3 Total execution time of stencil4D with NUCOLB and other load
bal-ancers. . . 86 6.4 Messages received per PU before load balancing (first 10 timesteps). . 87
6.6 Total execution time of LeanMD with NUCOLB and other load
bal-ancers. . . 88 6.7 Total execution time of kNeighbor with HWTOPOLB and other load
balancers. . . 89 6.8 Total execution time of stencil4D with HWTOPOLB and other load
balancers. . . 90 6.9 Total execution time of LeanMD with different load balancers. . . 92 6.10 Average timestep and average PU load for Ondes3D on Xeon32.
Val-ues averaged at each 20 timesteps. . . 93 6.11 Average timestep duration for Ondes3D on Xeon32 with
HWTOPOLB and NUCOLB. Values averaged at each 20 timesteps. . 94
6.12 Total execution time of LeanMD on 20xOpt4. . . 95 6.13 Total execution time of LeanMD with HWTOPOLB and other load
balancers on a varying number of Opt32 compute nodes. The prob-lem size is increased with the number of compute nodes. . . 97 6.14 Total execution time of LeanMD with different load balancers on up
to 16 Opt32 CNs. The problem size is increased with the number of compute nodes. . . 99 6.15 Total execution time of LeanMD with different load balancers on up
to 16 Opt32 CNs. The problem size is the same for all numbers of compute nodes. . . 101 6.16 Speedup for different load balancers over the execution time of the
2.1 Characterization of the example platforms in regards to machine
topology symmetry and uniformity. . . 22
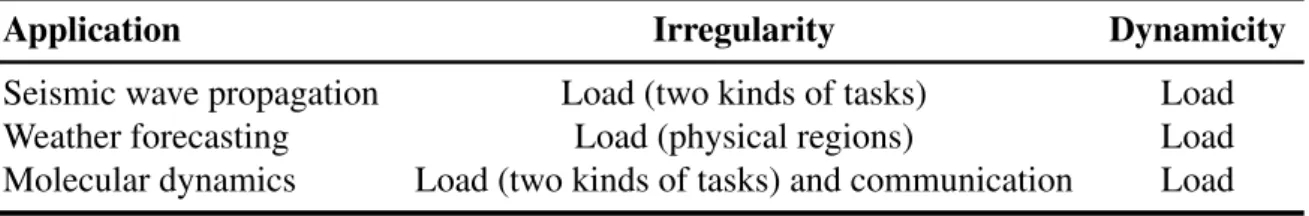
2.2 Characterization of the example applications in regards to application dynamicity and irregularity. . . 26
2.3 Characterization of the example applications in regards to sources of load imbalance and costly communications. . . 27
3.1 Memory latency (ns) as measured by lat_mem_rd on different ma-chines. . . 41
3.2 Comparison of the different representations of communication dis-tance from NUMA node 0 on Xeon192. . . 44
5.1 Task mapping algorithms comparison in terms of application modeling. 74 5.2 Task mapping algorithms comparison in terms of machine topology modeling. . . 76
5.3 Task mapping algorithms comparison in terms of techniques em-ployed and objectives. . . 78
6.1 Overview of the platforms’ hardware characteristics. . . 80
6.2 Overview of the platforms’ software components. . . 80
6.3 Benchmarks and application characteristics. . . 81
6.4 Load balancers comparison in terms of machine topology modeling. . 82
6.5 Load balancers comparison in terms of application modeling and techniques employed. . . 83
6.6 Total execution time in seconds of lb_test and speedups for NUCOLB and other load balancers. . . 85
6.7 Load balancing times in seconds for stencil4D for different NUMA machines. . . 87
6.8 Average number of LLC misses (in millions) for stencil4D with HWTOPOLB and other load balancers on Opt32. . . 91
6.9 Total execution time in seconds of Ondes3D and speedups for NUCOLB, HWTOPOLB and other load balancers. . . 93
6.10 Average timestep duration and load balancing time (ms) for LeanMD with NUCOLB and other load balancers on 20xOpt4. . . 96
6.11 Average timestep duration of LeanMD with HWTOPOLB and other load balancing algorithms on a varying number of Opt32 compute nodes. . . 98
This thesis presents our research to provide performance portability and scalability to complex scientific applications running over hierarchical multicore parallel platforms. Performance portability is said to be attained when a low core idleness is achieved while mapping a given application to different platforms, and can be affected by performance problems such as load imbalance and costly communications, and overheads coming from the task mapping algorithm. Load imbalance is a result of irregular and dynamic load be-haviors, where the amount of work to be processed varies depending on the task and the step of the simulation. Meanwhile, costly communications are caused by a task dis-tribution that does not take into account the different communication times present in a hierarchical platform. This includes nonuniform and asymmetric communication costs at memory and network levels. Lastly, task mapping overheads come from the execution time of the task mapping algorithm trying to mitigate load imbalance and costly commu-nications, and from the migration of tasks.
Our approach to achieve the goal of performance portability is based on the hypothe-sis that precise machine topology information can help task mapping algorithms in their decisions. In this context, we proposed a generic machine topology model of paral-lel platforms composed of one or more multicore compute nodes. It includes profiled latencies and bandwidths at memory and network levels, and highlights asymmetries and nonuniformity at both levels. This information is employed by our three proposed topology-aware load balancing algorithms, named NUCOLB, HWTOPOLB, and HIER -ARCHICALLB. Besides topology information, these algorithms also employ application
information gathered during runtime. NUCOLB focuses on the nonuniform aspects of
parallel platforms, while HWTOPOLB considers the whole hierarchy in its decisions, and
HIERARCHICALLB combines these algorithms hierarchically to reduce its task mapping
overhead. These algorithms seek to mitigate load imbalance and costly communications while averting task migration overheads.
Experimental results with the proposed load balancers over different platform com-posed of one or more multicore compute nodes showed performance improvements over state of the art load balancing algorithms: NUCOLB presented improvements of up
to 19% on one compute node; HWTOPOLB experienced performance improvements
of 19% on average; and HIERARCHICALLB outperformed HWTOPOLB by 22% on
av-erage on parallel platforms with ten or more compute nodes. These results were achieved by equalizing work among the available resources, reducing the communication costs ex-perienced by applications, and by keeping load balancing overheads low. In this sense, our load balancing algorithms provide performance portability to scientific applications while being independent from application and system architecture.
1
INTRODUCTION
For years now, science has advanced thanks to the insights brought by numerical sim-ulations. These scientific applications are used to reproduce and predict complex phe-nomena, with scales varying from the way a protein behaves to the effects caused by an earthquake. These applications have ever increasing demands in performance and re-sources. For instance, the higher the resolution of a weather forecasting model, the more precise and accurate would be its predictions, as local phenomena would be better rep-resented in the system. In order to profit from the multiple resources available in high performance computing (HPC) platforms, scientific applications are developed using par-allel languages and runtimes.
Parallel applications are decomposed into smaller parts, which can be implemented as processes, threads, objects, etc. We refer to them as tasks. Each task participates in the simulation by processing a part of the total workload. Before starting an application, it may not be possible to predict the amount of work, or load, each task will receive or produce. Load irregularity may come from tasks playing different roles in the application, or simulating different aspects or materials in the system. The load of a task can also change dynamically through time, as it achieves a different state in the simulation, or receives feedback from other tasks. When tasks are distributed over a parallel platform without taking such behaviors into account, load imbalance occurs.
In addition to the effects that tasks’ loads have over the execution of a scientific ap-plication, there is also the affinity of tasks that affect it. A task’s affinity group refers to the other tasks that it shares data or communicates with. It is in the best of interests to have communicating tasks mapped in the parallel platform in a way that reduces their communication times. However, communication times are not only affected by the com-munication behavior of a task, which can be irregular and dynamic as can happen to its load, but also by the organization of the HPC platform where the application is executing. Typical HPC platforms are composed of multiple processing units, varying in scale from a multicore machine to a cluster composed of many multicore compute nodes. Their topologies include different cache, memory, and network levels organized hierarchically. As a consequence, the communication time between a pair of processing units or compute nodes will also depend on their distance in the whole topology.
Besides the effects caused by a hierarchical organization, communication times may not be uniform in some of the topology levels. At an interconnection network level, this happens because having a direct and dedicated interconnection between every pair of compute nodes is unfeasible in scale. Meanwhile, in order to mitigate the effects of the “memory wall problem” (WULF; MCKEE, 1995), not only is memory organized in a hi-erarchical fashion, but the main memory is also being assembled from different memory banks in a nonuniform memory access (NUMA) design. Besides nonuniformity,
symme-try may not be held, as the communication time between two components can depend on which direction it is happening, and the routing algorithms involved. If not taken into account when mapping tasks to the available resources, these characteristics of HPC plat-forms (namely nonuniform and asymmetric communication times, and hierarchical orga-nization), together with an application’s irregular and dynamic communication behaviors, can result in costly communications to said application.
Mitigating costly communications and balancing load are two different ways to im-prove application performance. Nevertheless, they can be orthogonal: an optimal task distribution for balancing load can negatively affect performance by increasing commu-nication costs, as can the opposite happen. In this context, an equilibrium has to be found when focusing in both objectives for performance.
1.1
Problem statement
A challenge lies on managing the execution of a scientific application in order to explore the resources of a parallel platform to their fullest and, consequently, achieve high performance and scalability. This requires identifying characteristics of the application and platform, and managing which processing and communication resources get to be shared among tasks based on their loads and affinity. This problem is also aggravated by the fact that platforms and applications evolve independently from one another.
Finding the best task distribution to balance load and/or communication costs is a NP-Hard problem (LEUNG, 2004), thus requiring impracticable amounts of time for any application or platform of interest. To mitigate this problem, heuristics are employed to schedule tasks in feasible time. Although different algorithms exist, they may not provide performance portability.
A task mapping algorithm is said to attain performance portability when it is able to map a given application to different platforms and still achieve high efficiencies, which comes from a low core idleness. Although an algorithm can be tuned to a specific ap-plication and platform, this sacrifices portability in the process, as extensive work has to be done to provide scalable performance when running the same application in another platform, or another application in the same platform.
Performance portability also requires the task mapping algorithm to be performant, as its execution time will influence the application’s performance. In this sense, a challenge lies in displaying performance portability with task mapping algorithms, as one needs to equilibrate balancing load, reducing communication costs, and keeping the algorithm’s execution time small.
1.2
Objectives and thesis contributions
The main objective of our research is to provide performance portability and scala-bility to complex scientific applications running over hierarchical multicore parallel platforms. We follow the hypothesis that precise machine topology information can help load balancing algorithms in their decisions. Considering this objective and hy-pothesis, our contributions are the following:
• We develop a generic machine topology model of parallel platforms composed of one or more multicore compute nodes. It includes profiled information at memory and network levels. This model is used to provide detailed information to task
mapping algorithms. Our model is able to automatically measure, store, and make available the machine topology at a user level. It is also kept generic by using tools and benchmarks independent of application and system architecture.
• We propose load balancing algorithms that work at runtime level, which keeps them independent of a specific platform or application. They combine application infor-mation gathered during execution to our proposed machine topology model that considers real communication costs over the platform. They improve the distribu-tion of tasks over a parallel platform in order to mitigate load imbalance and costly communications. They are able to handle applications with irregular and dynamic behaviors, and machine topologies with nonuniform and asymmetric communica-tions costs (PILLA et al., 2012, 2014).
• We experimentally evaluate our approach with real benchmarks and applications over multiple parallel platforms. We implement our load balancing algorithms with a parallel language and compare their performance to other state of the art algo-rithms.
1.3
Research context
This research is conducted under the context of a joint doctorate between the Institute of Informaticsof the Federal University of Rio Grande do Sul (UFRGS); and the Mathe-matics, Information Sciences and Technologies, and Computer Science(MSTII) Doctoral School, part of the University of Grenoble (UdG). This cooperation is held within the International Laboratory in High Performance and Ambient Informatics(LICIA).
At UFRGS, research is developed in the Parallel and Distributed Processing Group (GPPD). This research group possesses a vast experience with task mapping algo-rithms and scientific applications, which include load balancing algoalgo-rithms for Bulk Syn-chronous Parallel applications (RIGHI et al., 2010) and weather forecasting models (RO-DRIGUES et al., 2010).
At UdG, this research is conducted in the Nanosimulations and Embedded Applica-tions for Hybrid Multi-core Architectures(Nanosim) team, which is part of the Grenoble Informatics Laboratory(LIG). This team counts with an extensive background in multi-core architecture modeling and memory management (RIBEIRO, 2011; CASTRO, 2012). This research also profits from a collaboration with the Parallel Programming Labo-ratory(PPL) of the University of Illinois at Urbana-Champaign through the Joint Labora-tory for Petascale Computing(JLPC). They are the developers of a parallel language and runtime system named CHARM++, which was used as a test bed for the implementation
of our proposed load balancing algorithms.
1.4
Document organization
The remaining chapters of this thesis are organized as follows:
• A review of the main characteristics of parallel platforms and applications is pre-sented in Chapter 2. It also discusses the basics of task mapping algorithms and machine topology probing.
and limitations are explored in this chapter. An evaluation of the parameters mea-sured in the topology is also detailed.
• Two centralized load balancing algorithms are proposed in Chapter 4. They are: NUCOLB, a load balancer that focuses on the nonuniform aspects of parallel
plat-forms; and HWTOPOLB, a load balancer that considers the whole machine
topol-ogy hierarchy in its decisions. This chapter also presents HIERARCHICALLB, a
hierarchical topology-aware load balancer based on the composition of centralized algorithms.
• The experiments conducted to evaluate our load balancers are shown in Chapter 6. This chapter includes information about the parallel platforms, benchmarks, appli-cations, and other load balancers used to measure the performance and scalability of our algorithms.
2
BACKGROUND
The performance of scientific applications can be affected by many different variables related to attributes intrinsic to the application itself and to the platform. For instance, at platform level, the communication time between two tasks will depend on the time that it takes for data to travel from one core to another through the machine topology. Mean-while, when focusing in the application, the execution time of a task at a certain timestep will depend on the phenomena being simulated and the input data. These problems are accentuated as applications become more complex, and parallel platforms are designed with more hierarchical characteristics. In this context, task mapping algorithms are em-ployed to reduce the impact of such attributes. They ease the process of distributing work over a parallel machine.
A task mapping algorithm provides performance portability by achieving a low core idleness when mapping an application to different platforms. This not only demands the algorithm to handle load imbalance and communication performance problems, but also to be performant by keeping its time overhead to a minimum. For an algorithm to decide which of these problems is the most relevant in a given situation, knowledge about the parallel platform and application of interest is required.
In this chapter, we discuss the core concepts of parallel platforms and applications, as well as their characteristics that affect performance. First, we introduce the features of parallel system architectures, how they are assembled, and how they can influence the communication time of applications. After that, we describe how parallel applications are composed, and exemplify how they behave using three different scientific applica-tions. The performance challenges faced by task mapping algorithms and their basic concepts are explained next. We follow with a presentation of tools to control and probe the machine characteristics, which serve to provide detailed information to task mapping algorithms. We conclude this chapter with a discussion on the aforementioned topics.
2.1
Components of high performance computing platforms
High performance computing (HPC) platforms are parallel machines designed to run applications with high demands of computing power and other resources. The main ap-proach to increase their computing power is to increase their parallelism. The amount of processing units per chip has been growing in the last decade, as has been the num-ber of compute nodes used to compose a parallel system. For instance, the most per-forming parallel platform in the world as evaluated by the TOP500 list in Novem-ber 2013 (DONGARRA; MEUER; STROHMAIER, 2013), known as Tianhe-2, is com-posed of 16, 000 compute nodes, and includes a total of 3, 120, 000 processing units. Such platform design leads to highly hierarchical architectures, with complex memory
subsys-tems and network topologies. This makes achieving scalable performance with different applications a challenge.
2.1.1 Composition
When considering a bottom-up approach, the basic component of this system architec-ture is the processing unit (PU). A processing unit is the place where a task is executed. In this scenario, one core in a simple multicore processor would represent one PU, while a simultaneous multithreading (SMT) core would have two or more PUs. This is the same definition used byHWLOC (BROQUEDIS et al., 2010; HWLOC, 2013), as will be
discussed later in Section 2.4.1.
When one or more PUs are grouped in a single shared memory space, we have a com-pute node(CN). Besides PUs and main memory, a compute node includes many levels of cache memory to accelerate memory access. These components are hierarchically or-ganized, as illustrated in Figure 2.1. It shows the machine topology of one compute node composed of 24 PUs (6 PUs per socket). In this example, the memory hierarchy is orga-nized as follows: each PU has its own L1 cache; pairs of PUs share a L2 cache; L3 cache is shared among all PUs inside the same socket; and the main memory is shared among all PUs. L1 L2 L3 Socket L2 L2 L1 L1 L1 L1 L1 Core PU PU PU PU PU PU
Core Core Core Core Core Memory Core L1 L2 L3 Socket PU L2 L2 L1 PU L1 PU L1 PU L1 PU L1 PU Core Core Core Core Core Core L1 L2 L3 Socket PU L2 L2 L1 PU L1 PU L1 PU L1 PU L1 PU Core Core Core Core Core
Compute Node Core L1 L2 L3 Socket PU L2 L2 L1 PU L1 PU L1 PU L1 PU L1 PU Core Core Core Core Core
Figure 2.1: Example of machine topology of a UMA machine with 24 PUs distributed in 4 sockets.
Inside a compute node, tasks are considered to communicate through shared memory. It is also considered that they are able to benefit from the memory hierarchy when com-municating. Data sent from one task to another is regarded as stored in the first level of the topology that is shared among the involved PUs. If the involved PUs do not share any cache level, then data can be found in the main memory. In the case of a uniform memory access (UMA) machine, all tasks accessing the main memory will take similar times. This happens because all use the same interface (for instance, a bus) to read data, as illustrated in Figure 2.2. However, the same does not happen with nonuniform memory access (NUMA) architectures.
NUMA architectures are a current trend in the design of parallel compute nodes. As the number of PUs inside a CN increases, so does increase the stress to the shared mem-ory controller hub in a UMA CN. Meanwhile, on NUMA architectures, the main memmem-ory
Memory
Socket Socket Socket Socket
Figure 2.2: Example of communication through memory on a UMA machine.
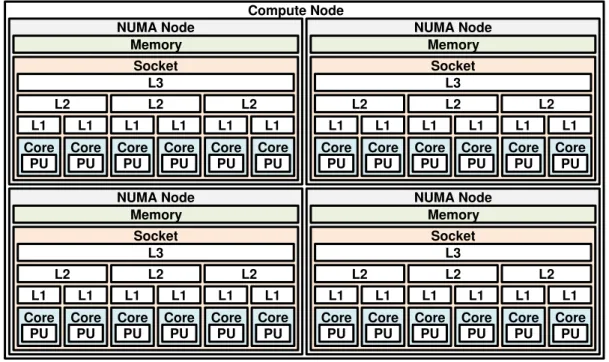
is partitioned in multiple memory banks that are physically distributed, but the memory space is still shared among all PUs in the same compute node. This design has the ad-vantage of spreading the memory accesses over these different banks. Each group of PUs sharing one memory bank is called a NUMA node. Figure 2.3 shows a compute node similar to the one seen in Figure 2.1, but partitioned into 4 NUMA nodes.
Compute Node Memory Memory Core L1 L2 L3 Socket PU L2 L2 L1 PU L1 PU L1 PU L1 PU L1 PU Core Core Core Core Core
NUMA Node Memory Memory Core L1 L2 L3 Socket PU L2 L2 L1 PU L1 PU L1 PU L1 PU L1 PU Core Core Core Core Core
NUMA Node Memory Memory Core L1 L2 L3 Socket PU L2 L2 L1 PU L1 PU L1 PU L1 PU L1 PU Core Core Core Core Core
NUMA Node Memory Memory Core L1 L2 L3 Socket PU L2 L2 L1 PU L1 PU L1 PU L1 PU L1 PU Core Core Core Core Core
NUMA Node
Figure 2.3: Example of a machine topology of a NUMA machine with 24 PUs distributed in 4 NUMA nodes.
When tasks residing in PUs from different NUMA nodes communicate, data is usually considered to be stored in the sender’s memory bank due to a first-touch memory policy, as it stores data in the NUMA node of the first thread to access it (LOF; HOLMGREN, 2005). In this scenario, the receiver will have to make a remote memory access to read data. This is depicted in Figure 2.4. The arrow represents the path that data travels to get from sender to receiver. One of the main characteristics of NUMA machines is that accessing data in a remote memory bank takes longer than accessing it in local memory.
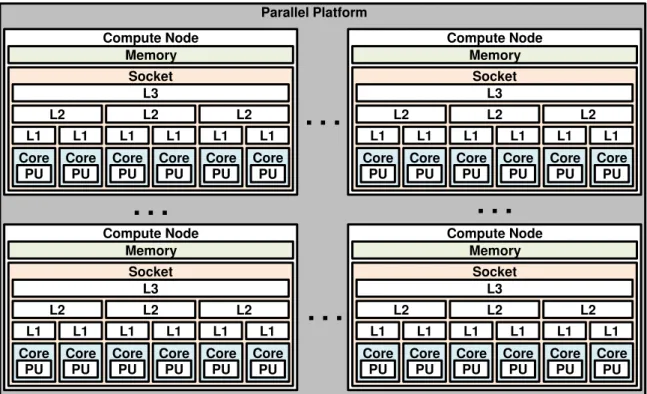
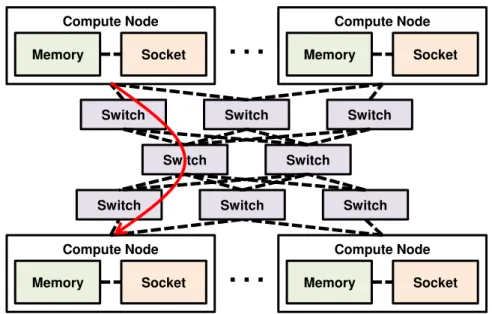
Besides the memory hierarchy of a compute node, a network hierarchy is present when clustering more than one CN. When using the same representation illustrated in Figures 2.1 and 2.3, an additional level is added to the machine topology to include the network interconnection. This is depicted in Figure 2.5. Tasks communicating in this platform use the same mechanisms discussed before if both tasks happen to be in the
NUMA Node Memory Socket NUMA Node Memory Socket NUMA Node Memory Socket NUMA Node Memory Socket
Figure 2.4: Example of communication through memory on a NUMA machine.
same CN. If that is not the case, then data will be sent to the receiver’s CN. This com-munication organization is displayed in Figure 2.6. The time that it takes for two tasks to communicate through network is usually considered to be greater than the time it takes for them to communicate through memory.
Parallel Platform Memory Memory Core L1 L2 L3 Socket PU L2 L2 L1 PU L1 PU L1 PU L1 PU L1 PU Core Core Core Core Core
Compute Node Memory Memory Core L1 L2 L3 Socket PU L2 L2 L1 PU L1 PU L1 PU L1 PU L1 PU Core Core Core Core Core
Compute Node Memory Memory Core L1 L2 L3 Socket PU L2 L2 L1 PU L1 PU L1 PU L1 PU L1 PU Core Core Core Core Core
Compute Node Memory Memory Core L1 L2 L3 Socket PU L2 L2 L1 PU L1 PU L1 PU L1 PU L1 PU Core Core Core Core Core
Compute Node
…
…
…
…
Figure 2.5: Example of a machine topology with multiple compute nodes. 4 UMA com-pute nodes are illustrated.
The communication time between two PUs is strongly influenced by the machine topology level where it happens. The closer the topology level is to the PUs, the smaller this time is. In this sense, communication at a cache level is faster than at a memory or network level. Still, other factors can influence communication performance. For instance, contention happens when there is conflict for a shared resource (e.g., a network link), which decreases the performance of tasks using it. Besides that, differences inside a topology level can affect performance, as discussed next.
Compute Node Memory Socket Compute Node Memory Socket Compute Node Memory Socket Compute Node Memory Socket
Switch Switch Switch
Switch Switch Switch
Switch Switch
…
…
Figure 2.6: Example of communication through network organized as a fat tree.
2.1.2 Asymmetry and nonuniformity at topology levels
When studying the communication time among PUs in the machine topology, two important properties emerge: symmetry and uniformity. They are explained below:
• Symmetry: a level in the machine topology is said to be symmetric if the com-munication time of a first task sending data to a second one is the same than the communication time of the second task sending data to the first one. When this does not happen, a topology level is said to be asymmetric.
• Uniformity: a level in the machine topology is said to be uniform if all tasks communicating through that level have the same communication time. When this does not happen, a topology level is said to be nonuniform.
For a more formal definition, a machine topology can be denoted as a quadruple O = (P, L, S, C), with P the set of PUs, L the set of levels of the topology, the first topology level shared by two PUs as a function S : P × P → L, and the communication time of one PU to another as a function C : P × P → R>0. S is symmetric and transitive.
A topology level l ∈ L is considered to be symmetric if
∀a, b ∈ P ∧ S(a, b) = l ⇒ C(a, b) = C(b, a). (2.1) Additionally, a topology is said to be symmetric if Equation 2.1 holds for all l ∈ L.
A topology level l ∈ L is considered to be uniform if
∀a, b, c ∈ P ∧ S(a, b) = S(a, c) ⇒ C(a, b) = C(a, c). (2.2) Likewise, a topology is said to be uniform if Equation 2.2 holds for all l ∈ L. It is important to notice that a topology level cannot be asymmetric and uniform at the same time due to S being a symmetric function. All other combinations are valid.
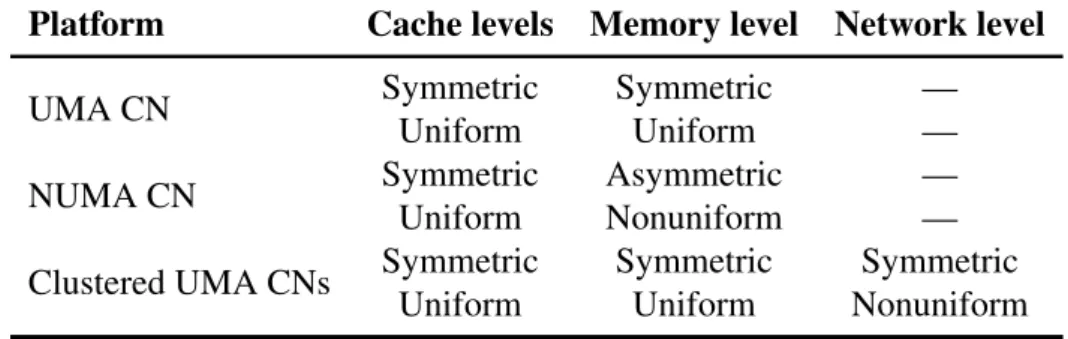
Table 2.1 relates symmetry and uniformity to the machine topologies illustrated in Fig-ures 2.1, 2.3, and 2.5. Other combinations can happen in real platforms, such as a cluster of NUMA CNs. Cache levels are usually, but not exclusively, symmetric and uniform.
Table 2.1: Characterization of the example platforms in regards to machine topology symmetry and uniformity.
Platform Cache levels Memory level Network level UMA CN Symmetric Symmetric —
Uniform Uniform — NUMA CN Symmetric Asymmetric — Uniform Nonuniform — Clustered UMA CNs Symmetric Symmetric Symmetric
Uniform Uniform Nonuniform
Nonuniformity can be seen in non-uniform cache access (NUCA) architectures (KIM; BURGER; KECKLER, 2002). The memory level is uniform for UMA compute nodes, and nonuniform for NUMA CNs. NUMA compute nodes may also present asymme-try (RIBEIRO, 2011). The network level strongly depends on the network topology. In Figure 2.6, all compute nodes are interconnected through a tree of switchs. This results in a symmetric but nonuniform network level. Asymmetry may come in the network level as a result of routing (HOEFLER; SCHNEIDER, 2012).
The hierarchical design of a system architecture, combined with asymmetric and nonuniform topology levels, impacts the communication time of an application. If the dif-ferent communication times between pairs of processing units are not taken into account, then communication can hinder application performance. Still, the machine topology is not the only factor affecting the total execution time of a parallel application, as charac-teristics of the application itself play a role too. These characcharac-teristics are discussed in the next section.
2.2
Characterization of scientific applications
Scientific applications are used to simulate phenomena through time at different scales (e.g., from the way molecules interact in nanoseconds, to the climate in years). Simu-lations involve large datasets and/or much processing. These parallel applications have their work and data split into tasks which populate the resources available in parallel plat-forms. The actual implementation of these tasks depends on the programming language. For instance, tasks may be implemented as threads in OPENMP (DAGUM; MENON,
2002), processes in MPI (GROPP; LUSK; SKJELLUM, 1999), and active objects in CHARM++ (KALE; KRISHNAN, 1993). The number of tasks in an application can be
much larger than the number of PUs available in the parallel platform. 2.2.1 Tasks: load and communication
Each task has an amount of processing to do. This is going to be referred as load in this thesis. A task’s load is measured as the time it takes running on a processing unit in a machine. The bigger the load, the longer the execution time. Although load could be de-composed into two parameters, amount of work of a task and PU performance, we keep it as single entity for simplicity. All platforms considered in this research are homogeneous, which means that their processing units have the same performance. This is the same ap-proach seen in related works (CHEN et al., 2006; HOFMEYR et al., 2011; JEANNOT;
MERCIER, 2010; LIFFLANDER; KRISHNAMOORTHY; KALE, 2012; TCHIBOUKD-JIAN et al., 2010; OLIVIER et al., 2011). This is discussed in more details in Chapter 5.
As tasks compute, the simulation iteratively evolves, and tasks start to communicate. Even though simulations commonly evolve in timesteps, they are not required to follow a Bulk Synchronous Parallel (BSP) (VALIANT, 1990) approach.
Task communication may happen through memory or network, depending on where the involved tasks are mapped, as previously discussed in Section 2.1. For the sake of simplicity, we are going to refer to data exchanges as messages. All messages sent and received during the execution of an application (or a part of it) can be seen as its com-munication graph, where vertices represent tasks and edges represent comcom-munication. Communication is measured by the number of messages sent from a task to another and the amount of bytes communicated. The time that it takes for a task to receive a mes-sage depends on both factors, and is also strongly affected by the distance between the processing units where tasks are mapped.
Considering these characteristics, an instance of an application execution (or part of it) can be defined as a quintuple A = (T , Load, Size, Msgs, Bytes), with T the set of tasks, their loads as a function Load : T → R>0, their sizes in bytes as a function
Size : T → R>0, the number of messages sent from one task to another as a function
M sgs : T × T → N, and the number of bytes sent from one task to another as a function Bytes : T × T → N. This organization is used to explain how application behavior interacts with its performance next.
2.2.2 Application irregularity and dynamicity
The way an application and its tasks behave can affect performance in different ways, e.g., tasks may have different loads; their loads may change through time; and communi-cation may follow different patterns in different phases of the applicommuni-cation. In the context of this thesis, we focus on two task characteristics: (i) how their load behaves; and (ii) how their communication behaves. This does not take into account other characteristics that may influence the final performance of an application, such as the way tasks interact with the file system. Communication and load vary from one application to another in two axes: regularity and dynamicity. They are explained in more details below:
• Regularity refers to how the load or communication of a task differs from another task. An application with regular load has tasks that compute for approximately the same time. When this is not the case, an application is said to have irregular load. Regular communicationis present in applications with well-defined communica-tion graphs, where the number of messages and amount of bytes exchanged is the same among different tasks. Meanwhile, an application with irregular communi-cation has a complex communication graph, or the amount of bytes or messages communicated varies between pairs of tasks.
• Dynamicity refers to how the load or communication of a task varies through time. An application with dynamic load has tasks that compute for different amounts of time at different timesteps. If loads are constant through time, an application is said to have static load. An application with static communication has a communica-tion graph that does not change. If that is not the case for an applicacommunica-tion, it is said to exhibit dynamic communication.
Figures 2.7 and 2.8 illustrate how regularity and dynamicity affect the load and com-munication graph of an application, respectively. The vertical axis represents changes
in regularity, while the horizontal axis represents a variation in dynamicity through timesteps. The horizontal bars in Figure 2.7 represent the load of four different tasks during three timesteps. The circles in Figure 2.8 represent four tasks in two different timesteps, while the arrows represent messages, and their thickness imply the volume of data exchanged. As these figures illustrate, regularity and dynamicity are not absolute characteristics, as they vary in levels.
Timesteps Static Dynamic Regu lar Irr eg ul ar
Figure 2.7: Different levels of load irregularity and dynamicity.
Timesteps Static Dynamic Regu lar Irr eg ul ar
Figure 2.8: Different levels of communication irregularity and dynamicity.
Irregularity and dynamicity affect application performance at both load and commu-nication sides. If the total load of tasks mapped to one PU is greater than in others, then PUs will be idle while waiting for the slowest (most loaded) PU. This scenario can easily happen in an application with a large load irregularity. Additionally, load dynamicity can generate this scenario during execution time, making it hard to predict and avoid. Mean-while, communication time will reduce if tasks that communicate more than others are mapped closer in the machine topology, and it will suffer if the opposite happens. Com-munication dynamicity can change which tasks have their performance affected by the communication time.
All these characteristics can be present in different levels in a scientific application. We exemplify this next.
2.2.3 Examples of scientific applications
To better understand how dynamicity and irregularity present themselves in real sce-narios, we analyze three scientific applications from different areas: seismology, weather forecasting, and molecular dynamics.
Seismic wave propagationmodels are mainly employed to estimate the damage in future earthquake scenarios. Simulations are applied in a regional scale, where the domain is divided into a three-dimensional grid. Each sub-domain can be seen as a task. In addi-tion to the simulated region, the domain also includes artificial borders used to process and absorb the outgoing energy of the seismic waves. In these models, task communication is regular and static, as tasks only communicate with their neighbors. Their load is mostly static, but wave propagation can spread dynamism in nonlinear simulations (DUPROS et al., 2010). These applications can also present load irregularity. This happens because the physical domain simulation has a different load than the artificial absorbing borders; and because different geological layers may have different constitutive laws, which results in different computational costs (DUPROS et al., 2008, 2010; TESSER et al., 2014).
Weather forecastingmodels are used to predict the state of the atmosphere at given place and time. This prediction can vary from tomorrow’s weather to how the climate is going to be in the following years. Models such as the Regional Atmospheric Modeling System (RAMS) (WALKO et al., 2000), and its Brazilian variant, BRAMS (BRAMS, 2013), split part of the globe and the atmosphere in a three-dimensional mesh. Each of these parts can be seen as a task. Their communication follows a regular and static behav-ior as seismology models do. Weather forecasting models can present load irregularity, as tasks may have different workloads depending on input data. Load dynamicity can also happen due to phenomena moving through the simulated area (e.g., thunderstorms) (RO-DRIGUES et al., 2010)(XUE; DROEGEMEIER; WEBER, 2007). This dynamism hap-pens in a scale smaller than the one seen in seismic wave propagation.
Molecular dynamics simulations are employed to study the dynamics and proper-ties of biomolecular systems. Typical experiments with applications such as Nanoscale Molecular Dynamics (NAMD) (NELSON et al., 1996) simulate the behavior of the molecular system for hundreds of nanoseconds. This takes millions of femtoseconds steps to simulate (BHATELE et al., 2009). NAMD uses a hybrid of spatial and force decomposition methods, where the simulation space is divided into cubical regions called cells, and the forces between two cells are the responsibility of computes. These two kinds of tasks, cells and computes, bring load irregularity to the application. Load dynamicity happens as simulated atoms can move from one cell to another. Communication is also irregular, as it involves different communication patterns at the same time, such as pair to pair and multicasts.
Table 2.2 summarizes the irregular and dynamic behaviors of the three applications. Although these applications have similarities, as being iterative and involving a three-dimensional space, the differences in the simulated phenomena results in various com-binations of performance challenges to be handled when executing them in parallel plat-forms. In the next section, we discuss the potential performance problems that should be considered when mapping tasks to physical resources.
Table 2.2: Characterization of the example applications in regards to application dynam-icity and irregularity.
Application Irregularity Dynamicity Seismic wave propagation Load (two kinds of tasks) Load Weather forecasting Load (physical regions) Load Molecular dynamics Load (two kinds of tasks) and communication Load
2.3
Task mapping
Task mapping algorithms serve to, as their name says, guide the way tasks are mapped to physical resources (mainly the processing units). More formally, we define a task mapping as a function M : T → P, where T represents the set of tasks of an application, and P is the set of PUs of a platform.
Some variations of task mapping algorithms can be called load balancers, schedulers, process mapping algorithms, and others. They play a central role in achieving perfor-mance portability with scientific applications running on parallel HPC platforms, as prop-erties of both can affect application performance. For instance, a naïve task mapping involving an equal number of tasks per PU can perform well with a regular, static ap-plication over a symmetric and uniform platform. However, any irregular or dynamic behaviors can result in an increase of core idleness and loss of scalability. We discuss the main performance problems considered in this thesis below.
2.3.1 Load imbalance and costly communications
The aforementioned behaviors can negatively affect performance in two ways: (i) through load imbalance; and (ii) through costly communication. An application is said to be load unbalanced when its current task mapping presents processing units with significant load differences. The load of a processing unit is considered to be the sum of the load of the tasks mapped to it. These load differences result in processing units being idle while waiting its tasks to synchronize with others. Such idleness affects the parallel efficiency and scalability of an application. Regular applications are the easiest to reduce load imbalance, as an even task distribution results at most in an off-by-one imbalance, where the number of tasks on each processing unit is within one of each other. Mean-while, dynamic applications are harder to keep balanced, as changes in behavior during execution time are more difficult to predict and mitigate.
Load imbalance is mostly independent of the machine topology. However, the oppo-site happens for costly communications. The time that it takes for two tasks to commu-nicate depends on how many messages are exchanged, the data volume, and where these tasks are mapped. For instance, communication through network is usually considered to take longer than through shared memory. If we consider that the communication time of an application is the sum of the time that all its messages take, then an application is con-sidered to have costly communications if its current communication time is much greater than its optimal communication time. In other words, an application is said to have costly communications if its current task mapping does not benefit from the machine topology. Applications with regular communication are easier to map to the machine topology in a way that reduces communication costs.
Table 2.3: Characterization of the example applications in regards to sources of load imbalance and costly communications.
Application Load imbalance Costly communication Seismic wave propagation Load irregularity and dynamicity Bad task mapping Weather forecasting Load irregularity mainly Bad task mapping Molecular dynamics Load irregularity and dynamicity Irregular communication
The impact of load imbalance and costly communications will depend on the appli-cation and platform of interest. For instance, considering the three appliappli-cations discussed in Section 2.2.3, Table 2.3 summarizes possible sources of load imbalance and costly communications. Seismic and weather simulations are less likely to suffer from costly communications, as their communication behavior is strongly static and regular. Still, a task mapping that leaves communicating tasks far from each other could generate a per-formance problem. Meanwhile, load irregularity and dynamicity pose challenges to a load balanced task distribution for the three applications. All these factors and some more have to be taken into consideration to provide performance portability to parallel applications, as is discussed next.
2.3.2 Performance portability
Performance portability is achieved when an application can be mapped to different platforms and still achieve low core idleness. This requires a task mapping that mitigates the effects of load imbalance and costly communications. Besides these two challenges, the task mapping algorithm itself must not be a liability to performance.
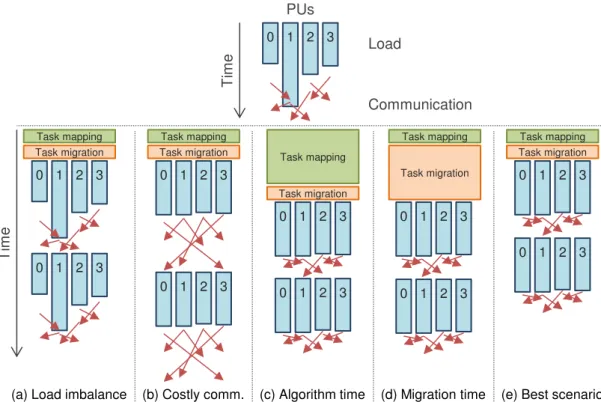
To better illustrate these concepts, Figure 2.9 depicts a scenario at its top where an ap-plication running on four PUs is unbalanced and suffering from costly communications. The vertical bars represent the load on each PU, and the arrows represent the communi-cation time among PUs. Communicommuni-cation is illustrated after the computation phase of the application only to evidence it, as communication can happen at the same time tasks are computing.
Below the initial task mapping in Figure 2.9, five different task mappings are pre-sented. Mapping (a) improves communication, but does not solve the load imbalance problem. Mapping (b) fixes the load imbalance, but increases the communication costs of the application. This could be a result of the task mapping algorithm not taking into account the communication behavior of the application or the machine topology. Map-ping (c) solves both problems, but application performance is affected by the execution time of the task mapping algorithm. While this algorithm is running, the application is stalled. A similar problem happens with mapping (d), where the task migration overhead increases the total execution time of the application. The ideal case in Figure 2.9 is illus-trated by mapping (e), where both performance problems are handled by a task mapping algorithm with a low overhead.
For performance portability to be achieved, a task mapping algorithm must take in-formed decisions regarding where to map tasks. In the next section, we discuss the main sources of application and platform knowledge used by task mapping algorithms.
PUs 0 1 2 3 Load Communication T im e 0 1 2 3 Task mapping Task migration 0 1 2 3
(a) Load imbalance
0 1 2 3 Task mapping Task migration 0 1 2 3 (b) Costly comm. Task mapping Task migration 0 1 2 3 0 1 2 3 (c) Algorithm time Task mapping Task migration 0 1 2 3 0 1 2 3 (d) Migration time Task mapping Task migration 0 1 2 3 0 1 2 3
(e) Best scenario
T
im
e
Figure 2.9: Challenges for performance portability.
2.3.3 Information required for mapping tasks
As previously discussed in Sections 2.2.1 and 2.1.2, we can see an application execu-tion as the quintuple A = (T , Load, Size, Msgs, Bytes), and the machine topology of the parallel platform where it is executing as a quadruple O = (P, L, S, C). Nonetheless, different task mapping algorithms may only consider part of this representation for its de-cisions, as they focus on different objectives or scenarios where part of this information is not available.
Task mapping algorithms that focus on mitigating load imbalance usually require some knowledge of the execution time of the tasks or the current utilization of the pro-cessing units. Tasks’ loads, or Load, can be obtained by timing the execution of each task (for instance, at a runtime (KALE; KRISHNAN, 1993) or operating system (HOFMEYR et al., 2011) level), or by predicting their processing time based on some previous knowl-edge of the application. However, this second approach can only be applied to applica-tions with static loads mostly. By using Load, an algorithm will seek to distribute tasks in a way that the sum of their loads in each PU is similar.
The total time spent of migrating tasks, or the migration overhead, can be estimated using the amount of bytes private to each task, or their Size. The current task mapping M is also important in this situation, as it enables the task mapping algorithm to keep some tasks where they currently are, avoiding unnecessary task migrations.
The communication graph of an application plays an important role when trying to re-duce costly communications. Task mapping algorithms can use the number of messages (Msgs) or the data volume exchanged between tasks (Bytes) to evaluate which tasks should be mapped close to each other. Such information can be captured at operating sys-tem level (DIENER; CRUZ; NAVAUX, 2013), runtime level (FRANCESQUINI; GOLD-MAN; MEHAUT, 2013), or even by tracing an execution of the application (MERCIER; CLET-ORTEGA, 2009). Still, with no knowledge about the machine topology, one can
only map communicating tasks to the same PU.
The machine topology can be used by task mapping algorithms in two different detail levels. The first one involves using the machine topology hierarchy, as the set of levels in the topology L and the first topology level shared by two PUs S, to designate which PUs are closer to each other. However, this approach does not differentiate nonuniform or asymmetric levels. The second step includes knowledge about the communication time between PUs C. By combining this information with the communication graph of the application, one can estimate the communication costs of different mappings. The mechanisms used to discover the machine topology hierarchy and communication times are the subject of the next section.
2.4
Machine topology identification
Existing approaches to identify the characteristics of a system architecture can be divided into two different groups. The first group focuses on controlling and discover-ing the different topology levels in a parallel platform, while the second group involves benchmarks and applications to obtain the communication times of the platform and other parameters. We present examples of both groups in the next sections and discuss which characteristics of the machine topology they could be able to provide to task mapping algorithms.
2.4.1 Hierarchy perception
A first technique to organize and model the hierarchical topology of a machine would be to read the vendors’ architecture specifications and to describe it manually. An ad-vantage of such approach lies in the ability to obtain architecture details that may not be available for tools (e.g., the physical distance between two components). However, this faces several issues, such as: (i) the problems of being manual work (portability, propen-sity to errors, scalability, etc.); (ii) limited information made available by vendors; and (iii) at a communication costs level, the differences between what is specified and what the system provides under different workloads. Due to such limitations, this approach is usually not chosen.
A tool used in different works to provide information about the system’s architecture is named Portable Hardware Locality, orHWLOC(BROQUEDIS et al., 2010)(HWLOC,
2013). HWLOCprovides a portable abstraction of the underlying machine hardware,
de-scribing the system architecture hierarchy. It automatically gathers the machine topology of a compute node, and it provides the ability to extend it to include multiple compute nodes. HWLOCcontains supplementary information about machine components, such as
cache sizes, line sizes, and associativity. Its interface supports the manipulation of the hardware abstractions, and the binding of tasks and memory onto PUs and NUMA nodes.
HWLOC is able to represent nonuniformity. For instance, it uses a distance matrix made
available by the BIOS to represent the distance among NUMA nodes. However, it does not express asymmetries at a topology level.
Another tool likeHWLOCis LIKWID (TREIBIG; HAGER; WELLEIN,
2010)(LIK-WID, 2013). The main difference between the two is that LIKWID supports hardware performance counters for a target application and architecture. Nonetheless, this feature depends on the support provided by the hardware. It represents nonuniformity for NUMA nodes the same way thatHWLOCdoes, and it also does not report asymmetries. Moreover,
hardware abstraction as data structures.
Instead of using general tools like HWLOC and LIKWID, some companies prefer to
provide machine topology information through special interfaces to developers. For in-stance, the UV 2000 series server from SGI includes a topology file with its operating system that contains all NUMAlink 6 interconnections between pairs of NUMA nodes inside the parallel platform (SGI UV 2000 System User Guide, 2012). With this infor-mation, one can measure the distance between two NUMA nodes in the machine as the number of hops.
A last approach to probe the machine topology involves benchmarking the hardware, as done by Servet (GONZALEZ-DOMINGUEZ et al., 2010)(SERVET, 2013). Servet is a benchmark suite to characterize the communication costs of platforms composed of multiple UMA compute nodes. It assesses the cache hierarchy, memory access costs and bottlenecks, and the communication latency among PUs. This communication latency is used to group PUs into levels, which form the machine topology. However, Servet does not explicitly contemplate nonuniformity in the memory level.
Besides Servet, there are different sets of benchmarks to evaluate the memory and network levels of a machine topology. A brief list is presented next.
2.4.2 Communication cost scanning
Benchmarks that work inside a single compute node usually focus in more than just scanning communication costs. For instance, BlackjackBench (DANALIS et al., 2012)(BLACKJACK, 2013) is a suite composed of several micro-benchmarks to probe the hardware characteristics of a compute node, such as caches’ line size, size, latency, and associativity; TLBs number, page size, and working set; instruction latencies and throughputs; and others. BlackjackBench’s focus is to provide hardware information for algorithm-guided tuning, and architecture-aware compiler environments. It also contains a collection of scripts to ease and automate the statistical analysis of benchmarked data. Analysis techniques include enforcing monotonicity to reduce noise when it makes sense, e.g., considering that cache access latency only increases as we move farther from the processing unit; and finding the steps in curves that represent hardware changes, such as the size of a cache level in the hierarchy, by finding the biggest gradients (relative values increase).
A very traditional benchmark suite that considers characteristics of a compute node and its network interconnections can be found in LMBENCH (STAELIN,
1996)(LMBENCH, 2013). It includes benchmarks to evaluate PUs, memory, network, file system, and disk. Although current implementations are able to run benchmark in-stances in parallel, the original suite was focused on evaluating CNs with one PU only. For this reason, they cannot uncover asymmetric and nonuniform levels in the topology by themselves. Memory benchmarks assess read latency and read bandwidth of the dif-ferent cache and memory levels, and include an implementation of the STREAM bench-mark (STAELIN, 1996, ap. (MCCALPIN, 1995)). Meanwhile, the network benchbench-mark measures the round-trip time (RTT) between two CNs using two different transport pro-tocols: TCP (Transmission Control Protocol) and UDP (User Datagram Protocol).
When focusing at an interconnection network level only, different frameworks are available for the development of benchmarks. An example of this is Netgauge (HOE-FLER et al., 2007)(NETGAUGE, 2013). Netgauge splits communication patterns, such as one-to-one or one-to-many, from the communication protocols and interfaces used, such as InfiniBand or TCP. It also provides the ability to implement new modules and
insert them in the framework. Similarly to BlackjackBench, Netgauge automates the sta-tistical analysis of benchmarked data.
Meanwhile, at a higher level than Netgauge, coNCePTuaL, or Network Correctness and Performance Testing Language (PAKIN, 2007)(CONCEPTUAL, 2013), is a domain-specific language to write network benchmarks. It eases the expression of complex com-munication patterns with its high level language. coNCePTuaL’s focus is to provide a portable, readable, and reproducible way to evaluate networks. Benchmarks described with coNCePTuaL are used to generate C code using different communication interfaces, such as TCP and MPI, that are then executed. When run, they automatically document the state of the system. coNCePTuaL is also able to process output data to ease its statistical analysis.
It can be noticed that no tool or benchmark alone is able to capture information from both memory and interconnection levels while also detecting the communication costs of the platform. This motivates the development of new approaches to model the machine topology.
2.5
Discussion
In this chapter, we presented the main characteristics of parallel HPC platforms and scientific applications that influence performance. We have seen that a parallel platform is composed of multiple processing units distributed over one or more compute nodes. Its machine topology is organized hierarchically, including multiple cache, memory, and network levels. When tasks mapped to processing units exchange messages, their com-munication time can be influenced by asymmetry and nonuniformity at different topology levels. When communication time is unoptimized, we say that the task mapping suffers from costly communications.
Besides the influence of the machine topology on the communication time, the parallel application also plays an important role. Communication performance is affected by its communication graph, which includes the number of messages exchanged between its tasks and their data volume, and may present irregular and dynamic behaviors.
Irregularity and dynamism can also be present at a task load level, as exemplified with scientific applications from three different areas: seismic wave propagation, weather forecasting, and molecular dynamics. If a mapping results in a large task load difference among PUs, the faster PUs will have to idly wait for the slowest one to continue their computations. In this scenario, we say that the task mapping suffers from load imbalance. We defined that a task mapping achieves performance portability when it is able to map an application to different parallel platforms while maintaining a low core idleness. This involves mitigating load imbalance, costly communications, and also keeping its own overhead to a minimum. Task mapping overhead is related to the time spent by an algorithm computing a new task mapping, and the time spent migrating tasks. To achieve all that, a task mapping algorithm requires detailed information about the application and the machine topology.
Different approaches to obtain information about the machine topology were dis-cussed. Most tools and applications focus on identifying the different topology levels in a parallel platform or evaluating the communication costs at different levels, but not both. To fill this gap, we propose our own approach to model the machine topology of HPC platforms in the next chapter, and employ it in novel topology-aware load balancing algorithms in Chapter 4.
3
MODELING THE TOPOLOGIES OF HPC PLATFORMS
As discussed in the previous chapter, a parallel platform can include complex mem-ory and network hierarchies in its topology. Such topology may present asymmetries and nonuniformity in different levels, which influence the performance of scientific ap-plications. This is specially true when considering their communication performance. To mitigate this problem, task mapping algorithms can take into account properties of the parallel platform and organize them into their own machine topology model. However, current tools are usually focused on modeling the memory hierarchy and/or the network hierarchy, or capturing the communication costs of platform, but not both.
In this chapter, we present the rationale of our machine topology model, as well as its features, limitations, techniques, and tools involved. Our main objective is to provide a unified machine topology model that includes both memory and network levels, and that exposes asymmetry and nonuniformity in different levels, so they can be used by task mapping algorithms and others. Additional objectives include:
• Presenting a general vision of the topology, allowing the model to be applied over different platforms in a portable way;
• Providing an interface that allows the machine topology model to be used by differ-ent algorithms, specially task mapping ones;
• Modeling communication times over the topology with real, precise, and accurate costs;
• Profiling the machine topology without incurring in large overheads. This includes limiting the scope of information collected; and
• Building our solution over well established tools.
3.1
Topology representation
We start this chapter by introducing how different topology levels are represented in our model, followed by a discussion about the parameters used to represent communica-tion costs.
3.1.1 Topology tree
We base our approach to machine topology modeling over the abstraction provided by
HWLOC(BROQUEDIS et al., 2010). HWLOCexposes information about a compute node