HAL Id: tel-01892032
https://tel.archives-ouvertes.fr/tel-01892032
Submitted on 10 Oct 2018
HAL is a multi-disciplinary open access
archive for the deposit and dissemination of sci-entific research documents, whether they are pub-lished or not. The documents may come from
L’archive ouverte pluridisciplinaire HAL, est destinée au dépôt et à la diffusion de documents scientifiques de niveau recherche, publiés ou non, émanant des établissements d’enseignement et de
T
HESE DE DOCTORAT DE
L'UNIVERSITE
DE
BRETAGNE
OCCIDENTALE
COMUE UNIVERSITE BRETAGNE LOIRE
ECOLE DOCTORALE N°605
Biologie Santé
Spécialité : Analyse et traitement de l’information et des images médicales
Video analysis for augmented cataract surgery
Thèse présentée et soutenue à Brest, le 13/07/2018 Unité de recherche : UMR1101 Inserm, LaTIM Par
Hassan ALHAJJ
Rapporteurs avant soutenance :
Vincent SOLER Professeur d’Université – Praticien
Hospitalier, CHU de Toulouse
Nicolas PADOY Maitre de conférences, HDR, à
l’Université de Strasbourg
Composition du Jury :
Vincent SOLER Professeur d’Université – Praticien
Hospitalier, CHU de Toulouse Président
Nicolas PADOY Maitre de conférences, HDR,
à l’Université de Strasbourg
Gwenolé QUELLEC Chargé de recherche, HDR, à
l’Inserm
Béatrice COCHENER Professeur d’Université – Praticien Hospitalier, CHRU de Brest
Acknowledgements
First and foremost, I would like to thank Almighty Allah SWT for giving me the strength, knowledge, ability and opportunity to undertake this research study and to complete it. Without his blessings, this achievement would not have been possible. I would like to express my appreciation to Prof. B´eatrice Cochener for giving me the opportunity to do a Phd. She have given me the opportunity to access a large amount of surgical data and precious advices in order to accomplish the job.
I take pride in acknowledging the insightful guidance of Dr. Gwenol´e Quel-lec, my thesis supervisor. He has given me invaluable guidance, inspiration and suggestions in my quest for knowledge. Without his guidance and patience, this thesis would not have been possible and I shall eternally be grateful to him for his assistance. I am also grateful to DR. Mathieu Lamard for his support, encourage-ment and ideas that have been great contributors in the completion of the thesis. In addition, it would be inappropriate if I omit to mention the name of Dr. Guy Cazuguel who has supervised me during my first year of thesis.
I would also like to express my gratitude to my committee members, Prof. Vin-cent Soler and Dr. Nicolas Padoy, who examined my thesis work and provided insightful suggestions.
My acknowledgement would be incomplete without thanking the biggest source of my strength and moral support, my family, especially my mother, my father, my brother and my sisters.
Ultimately, I have great pleasure in acknowledging my gratitude to my colleagues and my friends for supporting me during the 3.5 years of my thesis.
The digital era is increasingly changing the world due to the sheer volume of data produced every day. In particular, the medical domain is highly affected by this revolution, because analysing this data can be a source of education/support for the clinicians. In this thesis, we propose to reuse the surgery videos recorded in the operating rooms for computer-assisted surgery system. We are chiefly interested in recognizing at each instant of the surgery the surgical gesture being performed in order to provide relevant information. To achieve this goal, this thesis addresses the surgical tool recognition problem, with applications in cataract surgery. The main objective of this thesis is to address the surgical tool recognition problem in cataract surgery videos. In the surgical field, those tools are partially visible in videos and highly similar to one another. To address the visual challenges in the cataract surgical field, we propose to add an additional camera filming the surgical tray. Our goal is to detect the tool presence in the two complementary types of videos: tool-tissue interaction and surgical tray videos. The former records the patient’s eye and the latter records the surgical tray activities.
Two tasks are proposed to perform the task on the surgical tray videos: tools changes detection and tool presence detection. First, we establish a similar pipeline for both tasks. It is based on typical classification methods on top of visual learn-ing features. It yields satisfactory results for the tools changes task, however, it badly performs the surgical tools presence task on the tray. Second, we design deep learning architectures for the surgical tool detection on both video types in order to address the difficulties in manually designing the visual features. To alleviate the inherent challenges on the surgical tray videos, we propose to generate simulated surgical tray scenes dataset along with a patch-based convolutional neural network (CNN). Ultimately, we study the temporal information using RNN based on the CNNs results. Contrary to our primary hypothesis, the experimental results shows deficient results for the surgical tool presence on the tray but very good results on the tool-tissue interaction videos. We achieve even better results in the surgical field after fusing the tools changes information from coming the tray and tool presence signals on the tool-tissue interaction videos.
1 Introduction 16
1.1 Outline . . . 18
2 Context and Literature Review 19 2.1 Medical Archives . . . 20
2.1.1 Data Mining . . . 20
2.1.2 Computer-aided Decision in Medical Imaging . . . 21
2.1.2.1 Computer-aided Diagnosis . . . 22
2.1.2.2 Computer-assisted Surgery . . . 22
2.1.2.2.1 Intraoperative Applications . . . 23
2.1.2.2.2 Postoperative Applications . . . 23
2.1.3 LaTIM Research Positioning . . . 24
2.1.3.1 Works on Still Images . . . 24
2.1.3.2 Surgery Videos Analysis . . . 25
2.1.4 Summary . . . 26
2.2 Activity Recognition . . . 26
2.2.1 Computer Vision Domain . . . 26
2.2.2 Medical Domain . . . 29
2.2.2.1 Visual-based Representation . . . 29
2.2.2.2 Surgical Workflow . . . 29
2.2.2.3 Activity Recognition in Surgery Videos . . . 31
2.2.2.3.1 LaTIM Work on Surgery Videos Analysis . 32 2.2.2.4 Surgical Tool Detection . . . 35
2.3 Thesis positioning . . . 38
3 Cataract Surgery Data Description 41 3.1 Cataract Surgery . . . 42 3.2 Video Acquisition . . . 43 3.2.1 Preoperative Phase . . . 43 3.2.2 Intraoperative Phase . . . 45 3.2.3 Postoperative Phase . . . 45 3.3 Description . . . 45 3.3.1 Tools . . . 45 3.3.2 Videos . . . 52
3.3.3 Constraints and Challenges . . . 52
4.1.4 Experimental Results . . . 68
4.1.5 Change Detection Conclusion . . . 69
4.2 Tool Presence Detection . . . 71
4.2.1 Methodology . . . 71 4.2.1.1 Classification . . . 72 4.2.1.2 Optimization . . . 72 4.2.2 Experimental Datasets . . . 72 4.2.3 Evaluation Metrics . . . 72 4.2.4 Experimental Results . . . 72
4.2.5 Tool Presence Detection Conclusion . . . 74
4.3 Summary . . . 74
5 Surgical Tool Detection in Surgical Videos using Deep Learning 79 5.1 Deep Neural Networks . . . 80
5.1.1 Vanilla Neural Network . . . 81
5.1.1.1 Optimization . . . 83
5.1.1.2 Regularization . . . 84
5.1.2 Convolutional Neural Network . . . 84
5.1.2.1 Convolution Layer . . . 85 5.1.2.2 Pooling Layer . . . 85 5.1.2.3 Fully-Connected Layer . . . 86 5.1.3 Transfer Learning . . . 86 5.2 Network Architectures . . . 87 5.2.1 Earlier Networks . . . 87 5.2.2 Residual Network . . . 88 5.2.3 Inception Network . . . 89
5.2.4 Residual Inception Network . . . 90
5.2.5 Neural Architectural Search Network . . . 90
5.3 Change Detection . . . 92 5.3.1 Model Formulation . . . 93 5.3.2 Experimental Setups . . . 93 5.3.2.1 Dataset . . . 93 5.3.2.2 Networks Configurations . . . 94 5.3.3 Experimental Results . . . 96
5.3.4 Change Detection Conclusion . . . 100
5.4.1.1 Dataset . . . 100
5.4.1.2 Networks Configurations . . . 102
5.4.2 Experimental Results . . . 103
5.4.2.1 Tool-Tissue Interaction Videos . . . 104
5.4.2.2 Surgical Tray Videos . . . 106
5.4.3 Tool Presence Detection Conclusion . . . 108
5.5 Proposed Solution For Surgical Tray Challenges . . . 112
5.5.1 Simulated Dataset . . . 113
5.5.1.1 Video Setups . . . 113
5.5.1.2 Random Number Tools Dataset . . . 113
5.5.2 Model Formulation . . . 114
5.5.3 Experimental Setups . . . 115
5.5.3.1 Datasets . . . 115
5.5.3.2 Networks Configurations . . . 116
5.5.4 Experimental Results . . . 116
5.5.5 Surgical Tray Challenges Conclusion . . . 118
5.6 Summary . . . 120
6 Temporal Analysis of Surgery Videos 122 6.1 Sequence Classification with Neural Networks . . . 123
6.1.1 Recurrent Neural Network . . . 123
6.1.2 Long Short Term Memory . . . 124
6.1.3 Bidirectional Recurrent Neural Network . . . 125
6.2 Temporal Analysis for Tool Presence Detection . . . 125
6.2.1 Models Formulation . . . 126
6.2.2 Experimental Setups . . . 127
6.2.2.1 Datasets . . . 127
6.2.2.2 Network Configurations . . . 128
6.2.3 Experimental Results . . . 128
6.2.4 Temporal Analysis Conclusion . . . 130
6.3 EndoVis/CATARACTS Subchallenge . . . 131
7 Discussions and conclusions 132 7.1 Summary and Discussions . . . 132
7.2 Conclusions and Future Works . . . 135
8 Publications 137 9 Appendices 153 A Homography Experimentations . . . 153
B Results Of Surgical Tool Presence Detection . . . 156
(a) Specular reflection . . . 30
(b) Iris out of camera field of view . . . 30
(c) Blurred field of view . . . 30
(d) Occlusion challenge . . . 30
2.4 In blue, the motion fields approximated by spatio-temporal polyno-mials. In green, the motion fields between two consecutive images measured by the Farneb¨ack algorithm [Quellec et al., 2015]. . . 33
(a) courtesy to [Quellec et al., 2015] . . . 33
(b) courtesy to [Quellec et al., 2015] . . . 33
2.5 In (a), the method of segmenting and categorizing of subsequences proposed by [Quellec et al., 2014b]. In (b), the activity recognition approach proposed by [Quellec et al., 2014b]. . . 34
(a) courtesy to [Quellec et al., 2014b] . . . 34
(b) courtesy to [Quellec et al., 2014b] . . . 34
2.6 courtesy of [Charri`ere et al., 2017]. . . 35
2.7 Surgical tray image captured at time t. Microscope image captured at time t + a few seconds, showing part of the knife that has been taken out from the tray. . . 39
(a) Microscope field of view . . . 39
(b) Surgical tray . . . 39
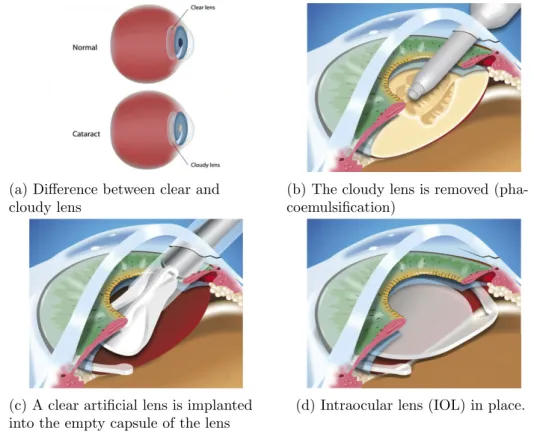
3.1 Main phases in the cataract surgery procedure. These images are a modified version of images got from this site1. . . 42
3.2 OPMI Lumera T microscope for ophthalmic surgeries. . . 44
(e) OPMI Lumera T microscope . . . 44
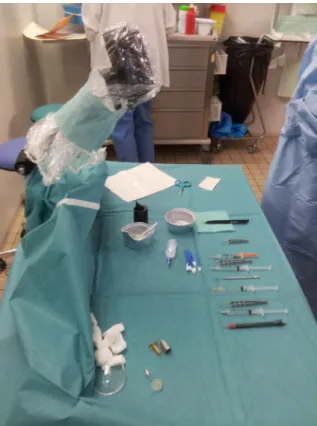
(f) OPMI Lumera T microscope ready to use in ocular surgeries . 44 3.3 The camera fixed on the surgical tray in the OR. . . 44
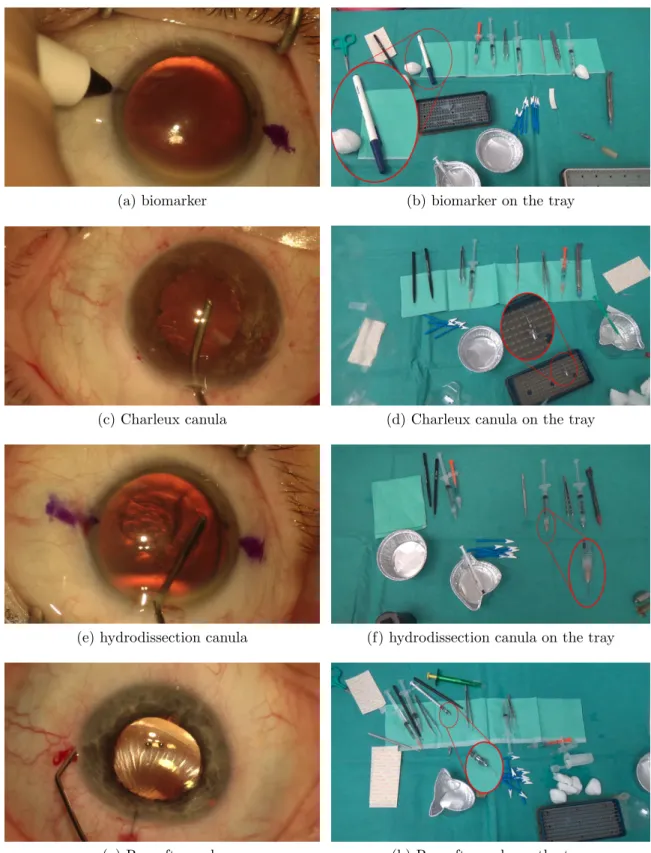
3.4 The surgical tools annotated in the tool-tissue interaction videos and their full-view version on the tray. . . 47
(c) Charleux canula . . . 47
(d) Charleux canula on the tray . . . 47
(e) hydrodissection canula . . . 47
(f) hydrodissection canula on the tray . . . 47
(g) Rycroft canula . . . 47
(h) Rycroft canula on the tray . . . 47
3.5 Figure 3.4 (Cont.). . . 48
(a) viscoelastic canula . . . 48
(b) viscoelastic canula on the tray . . . 48
(c) cotton . . . 48
(d) cotton on the tray . . . 48
(e) capsulorhexis cystotome . . . 48
(f) capsulorhexis cystotome on the tray . . . 48
(g) Bonn forceps . . . 48
(h) Bonn forceps on the tray . . . 48
3.6 Figure 3.5 (Cont.). . . 49
(a) capsulorhexis forceps . . . 49
(b) capsulorhexis forceps on the tray . . . 49
(c) Troutman forceps . . . 49
(d) Troutman forceps on the tray . . . 49
(e) needle holder . . . 49
(f) needle holder on the tray . . . 49
(g) irrigation / aspiration handpiece . . . 49
(h) irrigation / aspiration handpiece on the tray . . . 49
3.7 Figure 3.6 (Cont.). . . 50
(a) phacoemulsifier handpiece . . . 50
(b) phacoemulsifier handpiece on the tray . . . 50
(c) vitrectomy handpiece . . . 50
(d) vitrectomy handpiece on the tray . . . 50
(e) implant injector . . . 50
(f) implant injector on the tray . . . 50
(g) primary incision knife . . . 50
(h) primary incision knife on the tray . . . 50
3.8 Figure 3.7 (Cont.). . . 51
(a) secondary incision knife . . . 51
(b) secondary incision knife on the tray . . . 51
(c) micromanipulator . . . 51
(d) micromanipulator on the tray . . . 51
(e) Mendez ring . . . 51
(f) Mendez ring on the tray . . . 51
(g) Vannas scissors . . . 51
(h) Vannas scissors on the tray . . . 51
3.9 Figure 3.8 (Cont.). . . 52
(a) suture needle . . . 52
(f) Examples of tools non-used in the surgical field . . . 54
3.11 A web-based application for surgical tools annotation for the tool-tissue interaction videos and the surgical tray videos. . . 58
3.12 Tool usage during a typical surgery. Green and red indicates respec-tively the number of instance of tool present in each frame of the surgical tray video and the tool-tissue interaction video. Pink boxes indicate the moments where a tool is taken from the surgical tray, being used in the surgical field and probably put it back on the tray. Blue boxes show different types of exceptions. . . 59
3.13 Figure 3.12 (Cont.). . . 60
3.14 Tool usage during a complicated surgery. Green and red indicates respectively the number of instance of tool present in each frame of the surgical tray video and the tool-tissue interaction video. Pink boxes indicate the moments where a tool is taken from the surgical tray, being used in the surgical field and probably put it back on the tray. Blue boxes show different types of exceptions. . . 61
3.15 Figure 3.14 (Cont.). . . 62
4.1 Summary of optical flow application. (a) and (b) represent the last image before a motion is detected and the first image after a motion is stopped, respectively. (c) The tools colored refer to the objects that have been put on and moved between the two images. Gray background indicates nothing moved. Edges of the objects show a sparse motion. (d) Yellow indicates the value and the direction of the Farneb¨ack optical flow calculated for each pixel [Farneb¨ack, 2003]. (e) Optical flow registration on image (c). . . 66
(a) Image right before a motion is detected . . . 66
(b) Image right after a motion is stopped . . . 66
(c) Image (b) - image (a) . . . 66
(d) Optical flow result . . . 66
(e) Optical flow registration . . . 66
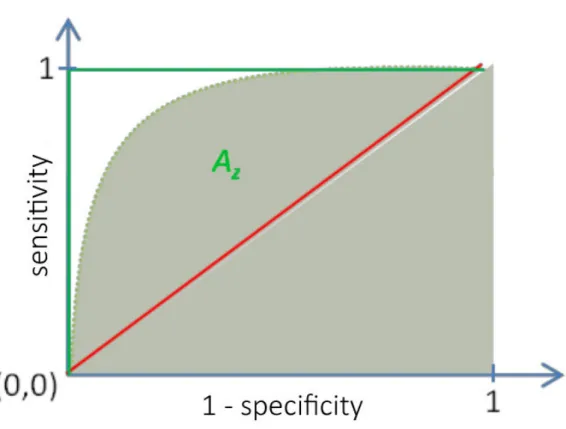
4.2 ROC curve presentation. Red line is the random representation , green lines represent perfect classifier and the dashed curve is an example of ROC curve with an area under it Az. . . 69
4.3 Two examples of tools detection: a success and a failure. (a), (b) and (c), (d) are two examples of surgical actions. In (d), (e), (h) and (i) gray indicates nothing moved, red level indicates a high probabil-ity of having a tool taken from the tray, green level represents high probability of having a tool put on the tray and black represents low
probability of having a tool put on or taken from the tray. . . 70
(a) Sample of Il . . . 70
(b) Sample of If . . . 70
(c) Manual segmentation of images (a) and (b) . . . 70
(d) Result of tool detection . . . 70
(e) Sample of Il . . . 70
(f) Sample of If . . . 70
(g) Manual segmentation of images (e) and (f) . . . 70
(h) Result of tool detection . . . 70
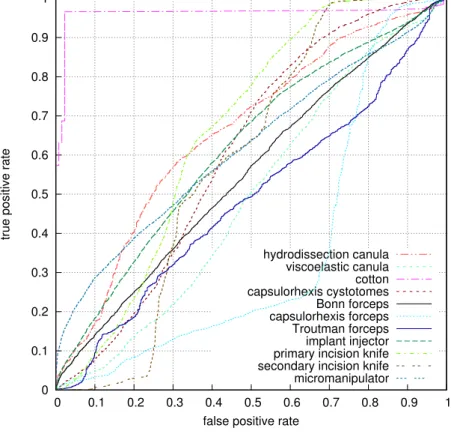
4.4 ROC curves for the most frequent tools used in the cataract surgery. . 73
4.5 Two examples for cotton detection: a success and a failure. In (a) and (c), tools bounded box in yellow are the targeted tools in each image. In (b) and (d), pixel value represents the probability of having the targeted tool in the patch. Gray indicates probability equal zero and green indicates high probability. . . 75
(a) Image containing cotton . . . 75
(b) Result of cotton detection . . . 75
(c) Image containing cotton . . . 75
(d) Result of cotton detection . . . 75
4.6 Examples of surgical tools detection. Tools bounded box in yellow are the targeted tools in each image. Right: pixel value represents the probability of having the targeted tool in the patch. Gray in-dicates probability equal zero, green inin-dicates high probability and black indicates low probability. . . 76
(a) hydrodissection canula sample . . . 76
(b) hydrodissection canula detection . . . 76
(c) viscoelastic canula sample . . . 76
(d) viscoelastic canula detection . . . 76
(e) capsulorhexis cystotome sample . . . 76
(f) capsulorhexis cystotome detection . . . 76
(g) Bonn forceps sample . . . 76
(h) Bonn forceps detection . . . 76
(i) capsulorhexis forceps sample . . . 76
(j) capsulorhexis forceps detection . . . 76
4.7 Figure 4.6 (Cont.). . . 77
(a) Troutman forceps sample . . . 77
(b) Troutman forceps detection . . . 77
(c) implant injector sample . . . 77
(d) implant injector detection . . . 77
representation thanks to this way of arrangement of neurons. . . 82
(a) Illustration of biological inspiration behind the single artificial neuron. . . 82
(b) An example of 3-layer neural networks. . . 82
5.2 An example of a simple convolution neural network. . . 85
5.3 Two types of layers in CNNs. . . 86
(a) Pooling layer illustration . . . 86
(b) Convolution layer illustration . . . 86
5.4 Courtesy of [Canziani et al., 2016]. Complexity comparison between top scoring deep learning networks for ImageNet classification task until early 2017. Left: top-1 validation accuracies for single-model architectures. Right: top-1 accuracy in function of the amount of operations (G-Ops: giga operations per second) required for a forward pass. The blobs size is proportional to the number of network param-eters. The legend, reported in the bottom right corner, is spanning from 5 × 10⁶ to 155 × 106 parameters. . . 87
5.5 Left: Normal CNN. Right: Residual Linked CNN. . . 88
5.6 Illustration of the na¨ıve inception module. It is noteworthy that a padding is applied to match all the output dimensions. . . 89
5.7 An overview of Neural Architecture Search. . . 91
5.8 Courtsy of [Zoph et al., 2017]. Scalable architectures for image classi-fication task. Left: Model architecture for CIFAR-10. Right: Model architecture for ImageNet. N is a hyperparmeter to be chosen em-pirically. . . 92
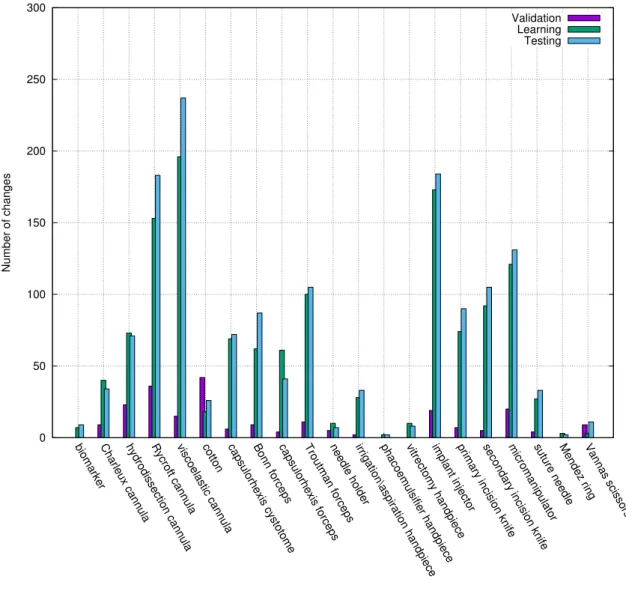
5.9 Learning subset distribution with a time period γ = 1. 34128 is the number images with no tools changes, representing 96.3% of the learning subset. 1322 is the number of images with tools changes, which are roughly equally distributed between the tools appearances and disappearances. . . 94
5.10 Tools change frequency in the learning subset with a time period γ = 1. . . 95
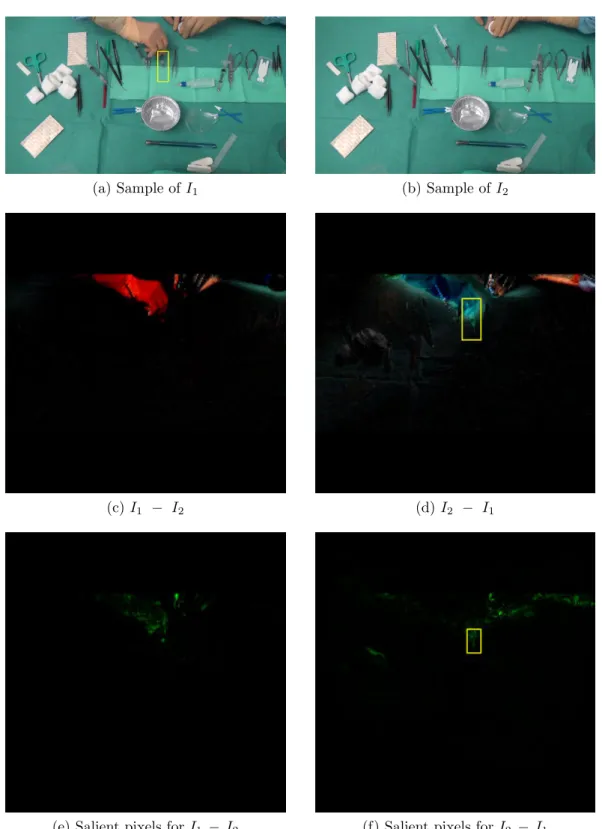
5.11 Two examples of tools changes. (a) and (b) represents the real scene images of an action with γ = 1. (c) and (d) are the input images that contain the tools changes. (e) and (f) are the hue-constrained sensitivity analysis for ResNet-152. Yellow boxes contain the tools changes occurred in this action. . . 97
(b) Sample of I2 . . . 97
(c) I1− I2 . . . 97
(d) I2− I1 . . . 97
(e) Salient pixels for I1 − I2 . . . 97
(f) Salient pixels for I2 − I1 . . . 97
5.12 Figure 5.11 (Cont.) . . . 98
(a) Sample of I1 . . . 98
(b) Sample of I2 . . . 98
(c) I1− I2 . . . 98
(d) I2− I1 . . . 98
(e) Salient pixels for I1 − I2 . . . 98
(f) Salient pixels for I2 − I1 . . . 98
5.13 A complicated example of tools changes. (a) and (b) represents the real scene images of an action with γ = 1. (c) and (d) are the in-put images that contain the tools changes. (e) and (f) are the hue-constrained sensitivity analysis for ResNet-152. Yellow boxes contain the tools changes occurred in this action. . . 99
(a) Sample of I1 . . . 99
(b) Sample of I2 . . . 99
(c) I1− I2 . . . 99
(d) I2− I1 . . . 99
(e) Salient pixels for I1 − I2 . . . 99
(f) Salient pixels for I2 − I1 . . . 99
5.14 Chord diagram illustrating tool co-occurrence in tool-tissue interac-tion training video frames. . . 101
5.15 Chord diagram illustrating tool co-occurrence in surgical tray training video frames. . . 102
5.16 Frequency histogram of tool presence in the tray videos subsets. . . . 103
5.17 Frequency histogram of tool presence in the tool-tissue interaction videos subsets. . . 104
5.18 Hue-constrained sensitivity analysis for the CNNs. These examples were taken from the testing set of the tool-tissue interaction videos. . 106
5.19 Hue-constrained sensitivity analysis for best performing I-CNN: NASNet-A. These examples were taken from the testing set of the surgical tray videos. . . 110
5.20 Confusion matrix for NASNet-A (I-CNN) tool absence (no presence) detection. For easier understanding, the diagonal cells are circled in red. N/A is not applicable: no images were found where the class in row is absent and the class in column is present. . . 111
5.21 Samples extracted from the RNT simulated dataset. . . 114
(a) Sample with 5 tools . . . 114
(b) Sample with 8 tools . . . 114
based on previous hidden state ht−1 and the current input using the
Equation (6.2). . . 124 6.2 Left: the structure of the module in RNN. Right: the structure of
the module in LSTM. . . 125 6.3 structure of BRNN using LSTM cells. . . 126 9.1 Homography transformation decomposition. Courtsy to [Malis and
Vargas, 2007] . . . 154 9.2 A sample of Ir is on the left and a sample of Is is on the right.
The yellow box is the bounding box for the targeted tool connected component. The white points are the key-points in the reference tool image and inside the bounding box. The red circle surrounds the actual result of applying H on the corner points of Ir. . . 155
9.3 Confusion matrix for Inception-ResNet-V2 (P-CNN) tool absence de-tection of the evaluation using of the RW testing subset. For easier understanding, the diagonal cells are circled in red. N/A is not ap-plicable: no images were found where the class in row is absent and the class in column is present. . . 156 9.4 Hue-constrained sensitivity analysis for best performing network
us-ing P-CNN: Inception-ResNet-V2. These examples were taken from the testing set of the surgical tray videos. . . 158 9.5 Hue-constrained sensitivity analysis for best performing network
us-ing P-CNN: Inception-ResNet-V2. These examples were taken from the testing set of the surgical tray videos. . . 159 9.6 Hue-constrained sensitivity analysis for best performing network
us-ing P-CNN: Inception-ResNet-V2. These examples were taken from the testing set of the surgical tray videos. . . 160 9.7 Confusion matrix for Inception-ResNet-V2 (P-CNN) tool absence (no
presence) detection. For easier understanding, the diagonal cells are circled in red. N/A is not applicable: no images were found where the class in row is absent and the class in column is present. . . 161
3.1 The surgical tools commonly used in the cataract surgery and their roles in the surgery procedure. Disposable surgical tools are in bold. . 46 3.2 Statistics about tool usage annotation in the tool-tissue interaction
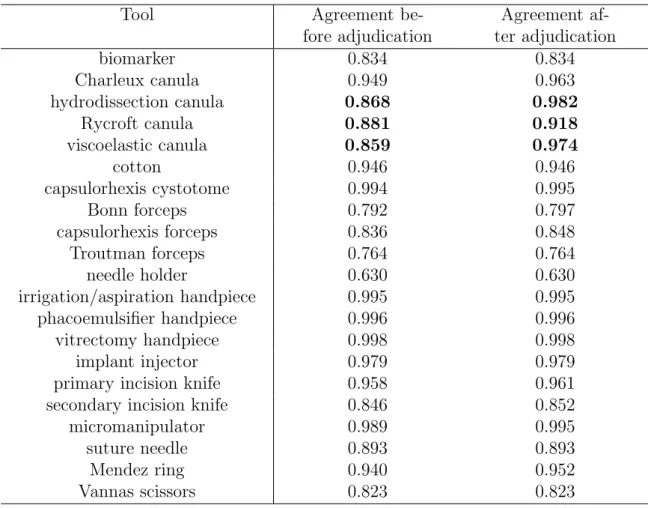
videos. The two columns indicate inter-rater agreement (Cohen’s kappa) before and after adjudication; the largest changes are in bold. 55 3.3 Statistics about tool usage annotation in the surgical tray videos.
The two columns indicate inter-rater agreement (Weighted Cohen’s kappa) before and after adjudication; the largest changes are in bold. 56 4.1 Possible outcomes of a binary classifier benign/malignant. . . 68 4.2 Performance Az of detecting the tools put on or taken from the tray
using handcrafted and learning features. . . 71 4.3 Performance Az of surgical tool presence detection using learning
fea-tures. The best object detected is presented in bold and the least one is presented in italic. . . 74 5.1 Performance Az of detecting tools changes in the surgical tray videos.
The best result is in bold. . . 96 5.2 I-CNN results in terms of areas under the ROC curve (Az) for
tool-tissue interaction videos. For each tool, the highest score is marked in bold. . . 105 5.3 I-CNN results in terms of areas under the ROC curve (Az) for surgical
tray videos. For each tool, the highest score is underlined. . . 109 5.4 Confusion matrix interpretation according to the tools distribution in
the learning subset. Tools are presented in ascending order of their frequency distribution. . . 112 5.5 P-CNN results in terms of areas under the ROC curve (Az) for the
RNT validation subset and the RW testing subset. For each tool, the highest score is marked in bold for the RW data and is underlined for synthetic data. . . 117 5.6 I-CNN results in terms of areas under the ROC curve (Az) for the
RNT validation subset and the RW testing subset. For each tool, the highest score is marked in bold for the RW data and is underlined for synthetic data. . . 118 5.7 I-CNN and P-CNN results of RW testing subset for the best
on the surgical tray. For each tool, the highest score is in bold. . . 134 9.1 P-CNN results in terms of areas under the ROC curve (Az) for surgical
1
Introduction
Chapter Content
1.1 Outline . . . 18
We are living in an era where technology is increasingly changing the shape of our world. It is no wonder that the technological advances have highly affected the med-ical field. They have been translated into medmed-ical innovations ranging from medmed-ical image acquisition systems to robotic surgical systems. These systems produce a massive data storage relatively unexplored and difficult to be explored manually by the clinicians. Thus, the need for automating the process of extracting information from the medical data. In this context, various computer-aided decision systems have been explored during the last few decades, such as computer-aided diagnosis and computer-assisted surgery. Computer-aided diagnosis can be defined as a di-agnosis made by the clinicians who take into account the results of an automated medical opinion. This second opinion is based on finding commonalities between the medical case being studied and the previous ones already diagnosed. This implicitly improves the medical knowledge of the clinicians and supports them in their decision-making task. In addition to the medical diagnostic aid, the medical archived records can also be exploited to provide surgical guidance. Computer-assisted surgery is a field where a surgery is supported by a computer-based tools and methodologies. Various kind of computer-assisted surgical systems can be put in place in the operat-ing room (OR) to guide the clinicians rangoperat-ing from simply knowoperat-ing the state of the OR to letting a surgical robot perform some tasks of the surgical procedure. This can be done by analyzing the various signals coming from the equipments installed in the OR. In other words, it is about exploiting these signals in order to tell what is taking place during the surgery. In our team, we are primarily interested in the
of view from only the operative field to both the operative field and the surgical tray by recording a second video stream filming the surgical tray. In contrast to the tool-tissue interaction field of view, the surgical tools are more easily recognizable on the surgical tray. Nevertheless, it is still challenging to detect the surgical tools on the tray due to its specification: it holds too many objects other than the tools used in the operative field and the surgeons accomplish some preliminary actions before using the tools inside the surgical field. In this thesis, we propose to jointly analyze the tool-tissue interaction video and the surgical tray video in order to ex-ploit their associated advantages: (1) the details of the tools edges and how they are used in the surgical field. (2) the recognizable version of the surgical tools with their installation environment on the surgical tray.
With an estimated nineteen million operations performed annually, cataract surgery is the most common surgical procedure. It is considered as an ideal field of study with potential applications in real-time decision support, report generations and surgical training. Due to the limited number of public surgical tool datasets, our first contribution is the generation of a large dataset for surgical tool recognition in the cataract surgery. We have collected and labelled tens of cataract surgery videos using a web application built specifically for this task. They are containing real sur-gical procedures where each surgery is recorded in two videos: tool-tissue interaction video and surgical tray video. They are the result of a close collaboration with the ophthalmology department of Brest University Hospital. This dataset permits the evaluation of the proposed approaches in this thesis. In addition, we released pub-licly, in 2017, the tool-tissue interaction videos in the context of a challenge called CATARACTS1 in order to detect the surgical tool presence in the surgical field
videos. In 2018, we released the surgical tray videos along with the tool-tissue inter-action videos in the context of EndoVis/CATARACTS2, a sub-challenge of MICCAI
EndoVis challenge for the sake of pushing forward the results obtained in the first challenge by providing a new technical challenge represented by the tray videos.
As second contribution, two different surgical tool recognition pipelines are pro-posed in this thesis. One is a patch-based approach using traditional classification methods on top of handcrafted features or learning features. Yet, designing discrim-inative features is not a trivial task due to the challenges in both types of videos. We propose to automatically learn the visual features in both types of videos
us-ing deep learnus-ing methods. Moreover, we propose to generate simulated surgical tray datasets, expectedly sidestepping the inherent challenges of the surgical tray. Therefore, the second approach is based on well-known convolutional neural net-works (CNN) architectures on top of these simulated datasets for the surgical tray videos. These CNNs are used as well on the tool-tissue interaction videos. In addition, the temporal constraints are deemed as a significant component for any surgical activity recognition system. Getting leverage of the temporal constraints in a surgical tool recognition system can have as well a noticeable effect on the perfor-mance of the system. Then, to incorporate the temporal information, Long-Short Term Memory (LSTM) network architecture is used on top of the visual features extracted for both videos.
1.1
Outline
In this thesis, we discuss only the work where we are the main contributor, how-ever, in Appendix C, we present the papers issued from this thesis where we are a secondary contributor.
Chapter 2 introduces the context of this thesis and includes a literature review of the methods proposed in the surgical activity recognition and the surgical tool recognition fields.
Chapter 3 describes the cataract surgery, the dataset collection and the chal-lenges present in it.
Chapter 4 presents several surgical tool recognition pipelines based on tradi-tional classification and feature extraction approaches on the surgical tray videos.
Chapter 5 describes the deep learning based solution to address the surgical tool presence detection in the tool-tissue interaction and the surgical tray videos. It explores as well the simulated surgical tray dataset.
Chapter 6 contains the fusion of the surgical tool information coming from both types of videos, expectedly boosting the performance of the system.
Chapter 7 concludes the work done in this thesis and introduces several possi-ble improvements of the methodologies and directions for future work.
Context and Literature Review
Chapter Content
2.1 Medical Archives . . . 20 2.1.1 Data Mining . . . 20 2.1.2 Computer-aided Decision in Medical Imaging . . . 21 2.1.3 LaTIM Research Positioning . . . 24 2.1.4 Summary . . . 26 2.2 Activity Recognition . . . 26 2.2.1 Computer Vision Domain . . . 26 2.2.2 Medical Domain . . . 29 2.3 Thesis positioning . . . 38
Along with the tremendous technological progress during the last few decades, the digital data became increasingly involved in all aspect of our life. From tiny mass storage in the sixties to today’s Data Centers, the humanity has reached a historic milestone. In addition to the use of computers for scientific computing, the use of ”Big Data” has been added to extract knowledge and expertise directly from the digital data archived in all areas: social networks, economics, finance, ecology, cartography, multimedia, etc. With the ”Big Data” emanating from various digital sources, its importance has enormously increased across industrial and academic fields. In fact, it can provide better insights for the problem being addressed and it helps mitigate risk and make smart decision by proper risk analysis. Thus, the analysis of such data has tremendously grown making the scientists to tap the dark data that was considered useless few decades ago. Health is surely one of the areas
data that are recorded every day in hospital services, medical practices and among health professionals. The volume of this data as well as their inherent complexity make clinical decision-making more challenging than ever for clinicians and other care givers. Moreover, extracting knowledge from ”Big Data” remains a challenging task. However, in addition to the problem of managing and securing these data, they have a real potential to facilitate the work of clinicians, in particular by setting up tools to assist in decision-making.
2.1
Medical Archives
With the advances in technology related to medical signals and image acquisition, there has been an escalation of complexity in medical data which has opened new opportunities for the researchers to reform the modern medicine. These advances have begotten medical innovations, such as navigation and monitoring systems, novel imaging technologies and revolutionary surgical tools (magnetic resonance imaging (MRI), ultrasound imaging, surgical microscope, etc.). These medical devices are becoming more versatile, and they are collecting and analyzing more data than ever before, resulting in massive digital medical databases relatively unexplored. [Healthcare, 2008] states that the number of images acquired in the United States in the radiology and cardiology departments increases at annual rate of 6 to 8 % during the last decade. This would represents a volume of about 100 petabytes in 2014, which is tantamount to the data on the servers of Facebook at that time. Digital archives are able to combine a very large number of clinical cases and be a rich source of information, but difficult to exploit directly by clinicians. It can be very time consuming and daunting to go through all archived cases. Therefore, the automatic interpretation of these archives is an essential step in the development of methods of medical decision-making. In this thesis, we are interested in the digital data coming from the operating room (OR). This data has spurred the community to build a context-aware system (CAS) which treats the information available in the OR to provide contextual support to the clinicians. The work done to date, such as [Cleary et al., 2005] [Bharathan et al., 2013], are ranging from simply showing the relevant information appropriately during surgery to assisting the clinicians in performing challenging surgical tasks by providing recommendations/warnings or suggesting actions to take. To provide such a support, it is required to use efficient tools to discover patterns in the large data sets which involves methods at the intersection of machine learning, statistics, and database systems. This is represented by data mining. In the following sections, we describe in short the data mining approach. Then, we introduce the medical applications issued from analyzing the medical data. Ultimately, we summarize this section along with introducing the field of interest of this thesis.
2.1.1
Data Mining
to use the data and the knowledge associated with them to predict or explain one or more observations. These approaches are based on supervised machine learning algorithms, such as decision trees or neural networks.
Figure 2.1: The transition from raw data to knowledge.
Data mining applications are very large [Padhy et al., 2012] [Liao et al., 2012] and are widely used in diverse areas. These applications are based on vital meth-ods (predictive and descriptive models: classification, regression, clustering etc.) adapted to the large amount of stored data and the resources available to analyze and exploit them automatically. In the medical field [Hashemi et al., 2018], data mining is mainly used in the context of epidemiology, i.e. the study and analysis of causes, patterns and effects of health and diseases.
2.1.2
Computer-aided Decision in Medical Imaging
Nowadays, medical devices produce large volumes of data per patient in seconds, making it tedious for clinicians to quest the information while providing timely diagnoses. This presented a significant need for development and improvement of computer-aided decision support systems in medicine. These systems are used to
in patient care. Also, they are designed to assist the clinicians and other health professional in choosing between certain relationships or variables for the purpose of making a decision [Chen et al., 2013]. This situation calls for the use of medical science methods to process the massive amount of data and construct a computer-aided decision systems to assist such decision makers. In fact, there are several areas in medicine for which computer-aided decision systems have become implemented and designed. In the following sections, we describe in short two different types of computer-aided decision and their applications.
2.1.2.1 Computer-aided Diagnosis
One way to reuse the medical archives is to look at the medical records that have commonalities between patients who have the same diseases. This improves the medical knowledge by identifying new diagnostic rules that will be taught to clini-cians or directly to patients. Using the medical records containing complex digital data, such as images or videos, it is possible to extract diagnostic rules that link the patterns identified in the data to a diagnosis. However, it is not necessarily obvious to teach the clinicians new diagnostic rules based on numerical features, such as the texture of an image or a motion feature in a video. In this context, rather than trying to teach complex rules to clinicians, it is preferable to train automatic deci-sion algorithms based on medical records. So, computer-aided diagnosis (CAD) is a form of the employment of machines to support human diagnostic reasoning. Sev-eral studies, such as [Doi, 2007], have suggested that the incorporation of the CAD system into the diagnostic process can improve the performance of image diagnosis by providing the quantitative support for the clinical decision. The purpose of CAD system is then to improve the diagnostic accuracy and the consistency of clinicians’ interpretation by using the system output as a guide. It is necessary to note that the CAD system is used only as a tool to provide additional information to clinicians who will make the final decision as the diagnosis of the patient. Usually two types of general approaches are employed in computerized schemes for CAD systems. One is to find the location of lesions by searching for the abnormal patterns. Another is to quantify the image features of normal and/or abnormal patterns. CAD is applicable to all imaging modalities, including projection radiography, computer tomography (CT), MRI, ultrasound imaging, and nuclear medecine imaging. In addition, com-puterized schemes for CAD can be developed for all kinds of examinations on every part of the body. The most popular application is probably the automated breast cancer screening in mammograms [Shin et al., 2015], which allows to some extent to replace a second medical opinion by an automated diagnosis. The work of the team in this context was concentrated in the diabetic retinopathy (DR) which is detailed in the section 2.1.3.1.
2.1.2.2 Computer-assisted Surgery
In addition to the diagnostic assistance, digital medical records can also be reused for surgical assistance. Computer-assisted surgery represents a surgical concept and a set of methods, that use computer technology for surgical planning and for
2.1.2.2.1 Intraoperative Applications
The intraoperative recognition of surgical tasks in the OR can be used to deter-mine the information required by the clinician’s team during the surgical procedure. For example, in the cataract surgery, the system could help the surgeon in identifying the orientation of the implant (the artificial lens that replaces the natural lens of the eye) while injecting it in the eye. This would help to get rid of employing two tools dedicated to this task, leading to diminution of the procedure time. Furthermore, if one is able to analyze the surgical video streams in real-time, it is then possible to train automatic decision systems: as soon as an abnormal event is detected during the surgery, an alert can be generated. Also, it can be seen as real-time notification system [Twinanda et al., 2017] that calls senior surgeons when certain key surgical activities are being executed in the OR or in the presence of a particularly critical situation. Moreover, it is possible to inform the surgeons of defects identified in certain surgical operations, for instance the system would suggest the best actions to handle such critical cases. So, surgeons can then adapt the workflow in order to improve the safety and the effectiveness of the surgery. It is then possible to develop semi-automatic decision support tools: real-time recommendations can be generated by relying on similar surgeries within an archive [Charri`ere et al., 2017]. The kind of alerts or recommendations used in such scenarios should be informa-tive, convenient and the simplest possible so we don’t add complexity to the OR. In addition, these real-time systems can optimize the surgical workflow and the OR resource management [Bhatia et al., 2007]. For instance, by knowing which surgical task is being done in the OR, the completion time of the surgery can be estimated. This can be used to notify the clinical staff to prepare the next patient [Doebbeling et al., 2012].
2.1.2.2.2 Postoperative Applications
The automatic recognition of surgical tasks is not only advantageous during the surgery procedure, but also afterwards when the surgery is over. For example, with the ability to automatically analyze the surgery, it can be possible to automatically generate a surgical report. In other words, events, actions and critical situations could be automatically identified, helping in the generation of the operative report. Using this report, it is also feasible to assess the surgical skill of the surgeons and track their improvement over time [Reiley and Hager, 2009] [Reiley et al., 2011]. In
indexing the content of videos appropriately, thus faster access to surgical activities done by experts. Not to mention the possibility of improving the medical knowledge by retrospectively analyzing the workflow of the surgery.
2.1.3
LaTIM Research Positioning
The Laboratory of Medical Information Processing (LaTIM), UMR 1101 of INSERM (National Institute of Health and Medical Research), develops a multidisciplinary re-search (Fig. 2.2) in which information sciences and health sciences enrich each other through exchanges between the two fields. Inside the IMAGINE team (Multimodal Information Integration for Decision Support and Optimization of Interventional Therapy), the METIS axis (Multimedia mEdical informaTion analysIs, protectIon and Secondary use) develops research on medical databases for two aims: to secure the sharing of the medical data and to reuse them for medical decision support. In this context, several studies have been carried out in the field of content-based image retrieval (CBIR [Long et al., 2009]) and multiple-instance learning (MIL) [Quellec et al., 2017a]. Research on still images was then extended to the analysis of clinical cases containing image data and demographic data. In parallel, content-based video retrieval (CBVR [Hu et al., 2011]) and MIL studies were initiated in order to provide the per-operative support. The methods developed focused on the ophthalmology applications thanks to a strong collaboration with the ophthalmology department of the Regional University Hospital Center (CHRU) in Brest.
2.1.3.1 Works on Still Images
Regarding still images, the main objective of the work carried out at LaTIM is to assist in the diagnosis of diabetic retinopathy (DR). Diabetic retinopathy is a complication of diabetes reaching the retina. The diagnosis and the detection of this disease is made by a examination of the fundus of the eye. A large number of fundus images are then examined each year by ophthalmologists, in order to detect the presence and the number of possible lesions. In order to facilitate and accelerate the examination of these images, many automatic image analysis algorithms have been studied. The literature is very rich on this subject [Amin et al., 2016]. The early studies were based on wavelet transform [Quellec et al., 2008] [Quellec et al., 2010a] [Quellec et al., 2012b] [Quellec et al., 2010b]. Quellec et al. have also worked on decision-making methods by merging information from the images, with contextual semantic information such as age, sex or patient history [Quellec, 2008]. This method yields good performance with an acceptable error rate. Afterwards, methods based on multiple-instance learning were proposed in [Quellec et al., 2012a] [Quellec et al., 2011] [Quellec et al., 2016b]. They showed significant improvements compared to the previous studies done in the team. The multiple-instance learning concept was also used to automate the mammography examination [Quellec et al., 2016a]. In the last few years, the deep learning has emerged at breakneck speed. This led to a numerous studies trying to automatically diagnose the DR. For instance, at Google, [V et al., 2016] they achieved a new state of the art performance in the automatic diagnosis of
(a) Multimodal information integration for decision support and optimization of interventional therapy
(b) Therapeutic action guided by multi-modal imaging in oncology
Figure 2.2: LaTim teams
severity of diabetic retinopathy (DR). The leading solutions were all based on deep learning. [Quellec et al., 2017b] has recently proposed a framework based on deep learning to detect automatically the DR and the lesions related to it. This framework has shown significant performance improvement compared to the previous work of the team.
2.1.3.2 Surgery Videos Analysis
The team has been interested for several years in the exploitation of videos recorded during surgeries such as cataract surgery in ophthalmology. The methods developed have a long-term objective of providing real-time assistance to the surgeon, i.e. offering examples of similar situations, recommendations or alerts. It is therefore necessary to be able to analyze in real-time the videos recorded during the surgery and to compare it to the data archived. To reduce and facilitate the search for similar cases, we rely on surgical workflows, which define the different steps of the surgery. An essential step toward this aim is to be able to recognize the surgical task being performed by the surgeon. As for still images, the methods studied
multiple-instance learning methods). Initially, various methods were developed to automatically recognize the surgical task performed within a sub-sequence. Then, these methods were adapted to perform a more complex task: automatic sequencing of a complete surgical video in surgical tasks. These methods are detailed in section 2.2.2.
2.1.4
Summary
Apart from medical data being inherently complex, the sheer volume of the medical data collected is growing speedily. Taking advantage of the technical and comput-erized trends, several medical applications have been introduced in the context of computer-aided decision. In particular, one of the applications is to analyze the archived surgical data to provide information to the surgeons in real-time. To this end, several effective methods have been developed around the reuse of medical data for surgical decision support. For the objective of real-time surgical support, several tracks have been explored and validated to allow the automatic surgical video anal-ysis. This includes robust methods to recognize the surgical task/activity during the execution of the surgery. This is an essential step in order to be able to gener-ate approprigener-ate recommendations/warnings and recognize critical situations. In the coming section, we discuss the existing approaches that tackle the surgical activity recognition (SAR) domain, where we refer to the step/phase/task as an activity. Ul-timately, we brief the position of our work with respect to the work already existing in the literature.
2.2
Activity Recognition
The need of SAR has emerged along with the interest of developing computer-assisted surgery systems. Various kind of signals got from the surgical equipments was used to tackle the problem of recognizing the surgical activity [Pernek and Ferscha, 2017]. One of the first applications based on activity recognition was to know the state of the OR, e.g. occupied or not occupied in [Bhatia et al., 2007]. In recent years, [Twinanda et al., 2017] [Charri`ere et al., 2017] [Dergachyova et al., 2016] have been shown that the surgical tool usage signals can provide valuable information in performing the activity recognition task in cholecystectomy and cataract surgeries. In this thesis, we are interested in the surgical video analysis field. We focus the discussion in the following sections on vision-based approaches used to address the automatic surgical video analysis issue. First, we review the state-of-the-art methods for activity recognition in the computer vision domain. Then, we discuss the vision-based approaches that have been proposed in the medical domain. Afterwards, we describe the methods that have been proposed in the surgical tools recognition field.
2.2.1
Computer Vision Domain
The methods in this field are typically built by using a two-step pipeline: visual feature representation step and the activity recognition step.
The visual feature representation can be divided into two main groups: spatial and spatio-temporal features. The spatial features can be color information [Jain and Vailaya, 1996] and texture features [Manjunath and Ma, 1996]. They can be deemed as global descriptors. Also, there exist local descriptors which represents the characteristics of image patches, for instance key-points detectors and descriptors like Harris corner detector [Harris and Stephens, 1988], scale-invariant feature trans-form (SIFT) [Lowe, 2004], speeded-up robust features (SURF) [Bay et al., 2008], and histogram of gradients (HOG) [Dalal and Triggs, 2005]. They are to some extent invariant to background clutter, appearance, occlusions, and to scale and rotation in some cases. Then, these local descriptors can be combined to build a global descriptor using feature encoding methods, such as the bag-of-word (BOW) approach. And to provide semantic information, high-level features, such as human pose estimation [Xu et al., 2012] and the results of object detection [Wu et al., 2007] are then utilized for activity recognition. By using such high-level features, the methods will have better performance in modeling the activities performed in the scene. On the contrary, the spatio-temporal features consider not only the spatial information but also the temporal information from an image sequence, such as op-tical flow-based features [Chaudhry et al., 2009] and spatio-temporal features such as the spatio-temporal key-points detector proposed in [Laptev, 2005]. These fea-tures are referred to as handcrafted feafea-tures, where the domain knowledge is used to extract features that makes the methods work. But, in recent years, features learning methods such as principal component analysis (PCA [Abdi and Williams, 2010]), independant component analysis (ICA [Parsons, 2005]) and artifical neural networks (ANN [Specht, 1988]) in particular deep learning, have earned a dearly interest in the computer vision field. Deep learning achieved a new state-of-the-art performance in different types of tasks in this field, for instance the activity recog-nition in [Tran et al., 2015]. One of the most common deep learning algorithms is the convolutional neural networks (CNN). In 2012, a CNN architecture in ImageNet challenge, referred to as AlexNet [Krizhevsky et al., 2012], reached a new state-of-the-art performance in classifying one thousand different classes. This network has shown its ability to learn discriminative learning features in order to do the task.
The second step of the activity recognition pipeline is the model/algorithm used to classify/detect/recognize the activity. Numerous methods were applied to the automatic detection of road traffic or pedestrian flows. [Piciarelli and Foresti, 2006]
tection of abnormal vehicle trajectories. Indeed, by detecting the typical movements and trajectories, it is easier to locate the abnormal events. Thus, [Hospedales et al., 2012] relied on probabilistic Bayesian methods to automatically analyze the be-haviour of pedestrians or vehicles in real-time. This method allows to learn classical patterns of behaviour, thus leading to detect atypical events. These methods are efficient in distinguishing atypical events from the normal ones previously learned. However, surveillance videos are relatively different from surgical videos: they are generally filmed with a fixed background. In fact, the SAR methods can generally be categorized in two groups of methods: pre-segmented and frame-wise classifica-tion methods. The former is the task of labeling videos with their corresponding activity labels. The latter consists of identifying a sequence of activities performed in a video without any information regarding the beginning/ending of each activity. On the one hand, classification algorithms can be used to address the pre-segmented classification such as discriminative modeling (SVM in [Xia and Aggarwal, 2013]). One the other hand, the frame-wise classification requires the incorporation of the temporal information in the recognition pipeline. Dynamic time warping (DTW), hidden markov model (HMM) and dynamic Bayesian networks (DBN) are the most well-known approaches used to address this problem.
Among deep learning methods, various approaches have been recently proposed which were inspired by the two-stream CNNs proposed by [Simonyan and Zisser-man, 2014a]. It incorporates spatial and temporal information extracted from RGB and optical flow images. These two image types are fed into two separate networks, and finally they fused the prediction score of each network. This method is the basis of many other methods such as [Tran et al., 2015] [Sun et al., 2015] [Zhu et al., 2016] [Yue-Hei Ng et al., 2015] [Feichtenhofer et al., 2016]. In fact, CNN can extract spatio-temporal features but only on a fixed-length of image sequences. To incorporate the temporal information inside the CNN, recurrent neural network (RNN) architecture was proposed in [Werbos, 1990] [Rumelhart and McClelland, 1987]. However, it was demonstrated in [Bengio et al., 1994] that the RNN are dif-ficult to train when the gap between the relevant information and the point where it is needed is very large. This is related to the vanishing weights problem [Bengio et al., 1994]. To overcome this issue, a modified architecture called Long Short-Term Memory (LSTM) was proposed in [Hochreiter and Schmidhuber, 1997]. [Donahue et al., 2017] has proposed a combination of a CNN and LSTM, which performs fairly well on various tasks, e.g. image description and activity recognition. However, tra-ditional two-stream CNNs are unable to exploit the correlation between the spatial and temporal streams. In [Ma et al., 2017], spatial and temporal features were ex-tracted from a two-stream ConvNet using ResNet-101 pre-trained on ImageNet, and fine-tuned for single-frame activity prediction. The spatial and temporal features are concatenated and then used as input to: Temporal Segment LSTM (TS-LSTM) or Temporal-Inception. This method yields a new state-of-the-art performance in the activity recognition domain. A detailed technical explanation about CNN and LSTM is presented respectively in sections 5.1 and 6.1.
still few methods proposed in the literature on the automatic analysis of surgical videos and the SAR is no exception to this matter. The scarcity is due to several reasons. First, the video acquisition is challenging because of the unavailability of the required equipments to do it and the strict regulations applied inside the OR. Also, this topic is relatively a new research field comparing to the activity recogni-tion in the computer vision field. In addirecogni-tion, there are numerous visual challenges in the surgical videos, e.g. occlusions, rapid camera motions and reflections. In fact, there are only few surgical activity datasets that have been released publicly, e.g. JIGSAWS 1, EndoVis 2 and m2cai16-workflow3 datasets.
In this context, several vision-based studies have been proposed to tackle topics relatively related to the activity recognition task, such as surgeon skills evalua-tion [Suzuki et al., 2015], surgical tool recognievalua-tion [Twinanda et al., 2017]. Precisely, in this thesis, we address the surgical tool recognition problem which is a fundamen-tal element in the SAR task, thus in any computer-assisted surgical system.
2.2.2.1 Visual-based Representation
Different types of signals exist in the OR. In this thesis, we are interested in the vi-sual signal emanating from the surgical equipment filming the operative scene. One of the biggest advantage of the surgery videos analysis is that it does not require any installation of additional components in the OR that would alter the surgical procedure. But, this analysis would require to overcome the visual challenges pre-sented in these videos, such as the challenges shown in Fig 2.3. For further details, the dataset generated in this thesis and the challenges presented in it are detailed in section 3.3.
2.2.2.2 Surgical Workflow
In order to design useful computer-aided systems, we need to define what the al-gorithms should look for in videos. In particular, if we want the alal-gorithms to automatically extract the workflow, we need to establish a terminology for describ-ing this workflow and provide visual examples for each term. In the literature, there are different ways of describing a surgery. A surgery can be defined at different lev-els of abstraction. This is called granularity levlev-els. Depending on the granularity,
1
https://cirl.lcsr.jhu.edu/research/hmm/datasets/jigsaws release/
2
(a) Specular reflection (b) Iris out of camera field of view
(c) Blurred field of view (d) Occlusion challenge
Figure 2.3: Visual challenges in cataract surgeries.
various terms have been used to refer to the activity, such as surgeme [Lin et al., 2006], phase [Blum et al., 2010] [Padoy et al., 2012], and gesture [Zappella et al., 2013].
In a recent review of surgical activities definition [Lalys and Jannin, 2014], they presented different levels of granularity that can be found in the literature. The finest description level corresponds to the visual features extracted from the video, such as the presence/absence of object/tool. They are induced by actions or gestures made with surgical instruments. An action can be seen as the application of a gesture to realize an objective. The terms ”steps”, ”task”, or ”phases” are also often found in the literature. A task corresponds to a job that must be carried out with a precise objective. It is therefore related to the realization of a surgical objective, such as making an incision or making a suture. The same task can be performed several times in the same surgery. We can define a ”step” as a sequence of physical actions/tasks, which does not necessarily lead to the realization of a surgical objective. A set of steps make up a surgical phase. The term surgical phases corresponds in the literature to high-level surgical tasks. They must lead to the realization of an essential surgical objective for the surgery. At the end, the coarsest level of description is the surgical procedure itself. This level is used in the case where one seeks to differentiate automatically the type of surgery, or the examination carried out. For instance, [Twinanda et al., 2015] sought to automatically determine the type of abdominal surgery performed. Also, a multi-level granularity approach is possible and it has been explored in [Charri`ere et al., 2017] [Forestier et al., 2015].
One of the earliest studies in this field is [Lo et al., 2003]. A pipeline was pro-posed, based on a Bayesian network on top of visual cues related to shape and de-formation changes and other low level features, to segment the laparoscopic videos. This method produced promising results in segmenting these videos. The following studies tended to use the tool usage signals with the assumption that this infor-mation can be obtained whether by further analysis of the video or through other sensors. [Ahmadi et al., 2006] [Padoy et al., 2007] [Blum et al., 2008] were based on DTW or HMM and produced satisfactory results for SAR. Afterwards, [Padoy et al., 2008] proposed a pipeline based on HMM on top of a combination of visual features and tool usage signals. This mixture yields promising results in recognizing the phases in laparoscopic videos. In [Blum et al., 2010], the tool usage signals were used only at learning time since it was difficult to obtain them at test time. The canonical correlation analysis (CCA) were used to reduce the dimension of the handcrafted visual features, expectedly leading to more semantically discriminative visual features. It was tested on laparoscopic videos. This method showed better performance than the PCA-based methods.
In addition, the motion information has been used as part of the visual features in the SAR studies. In [Zappella et al., 2013], in addition to HOG, the motion data represented by histogram of optical flow (HOF) around the detected STIPs were extracted to represent the video frames. But, these videos were recorded for training purposes so not as long as real procedures. Another work made by [Lalys et al., 2010] to extract the surgical phases in the microscope videos. This method is based on a multitude of visual features such as color, texture and shape information. Using the combination of SVM and HMM on top of the visual features, the pipeline yields promising result for the recognition of the phases. In another work from the same team [Lalys et al., 2012], similar features were used in a vision-based methods to segment the phases in cataract surgery. DTW was on top of the mixture of the features which has been proven to perform very well. In [Forestier et al., 2015], they developed a real-time method for automatic video annotation. They wanted to recognize which surgical phase is being performed by the surgeon, relying on a low granularity level (surgical actions). This method used decision trees to model the surgical workflow instead of HMM. The visual content of the surgery videos was not analyzed: the features used as input of the model was the ground truth of the action being carried out by the surgeon. Recently, in [Dergachyova et al., 2016], HMM based pipeline was proposed to address the surgical phase recogni-tion on laparoscopic videos. The visual features extracted are color, texture and
But, the combination of tool usage signals and visual features produced the best performance in this method. It is also in accordance with [Padoy et al., 2008] where the combination of visual features and tool usage signals yields the best recognition results.
The aforementioned methods were all based on handcrafted features but a learn-ing feature approach could be better representative, expectedly leadlearn-ing to better performance. In an early study [Klank et al., 2008], an approach based on genetic algorithm to learn feature representations for surgical phase recognition on laparo-scopic videos was proposed. A SVM model was on top of the extracted features to obtain the recognition results. The results showed that the learnt features are more discriminitave than the handcrafted ones. Recently, the deep learning based meth-ods have rapidly emerged. But, due to the limitation of the number of large public dataset in the medical field, few deep learning approaches were proposed to tackle the SAR on tool-tissue interaction videos. In [Lea et al., 2016], CNN based approach is proposed to perform action segmentation. This method has been evaluated on JIGSAWS dataset. It was based on spatial and temporal convolutional components. The results proved that this approach is better than other deep architectures and handcrafted-based features pipelines. Recently, solutions based on RNNs have also been proposed [Jin et al., 2016] [Bodenstedt et al., 2017] [Twinanda et al., 2016]. These RNNs process instant visual features extracted by a CNN from images. In particular, [Jin et al., 2016] apply a CNN+LSTM network to a small sliding window of three images. [Bodenstedt et al., 2017] apply a CNN+GRU network to larger slid-ing windows and copy the internal state of the network between consecutive window locations. As for [Twinanda et al., 2016], they apply a CNN+LSTM network to full videos. Interestingly, the CNN proposed by [Twinanda et al., 2016], namely EndoNet, detects tools as an intermediate step. A challenge on surgical workflow analysis was organized at M2CAI 20164: two of the top three solutions relied on
RNNs, more specifically on LSTM networks [Jin et al., 2016] [Twinanda et al., 2016]. In [Twinanda et al., 2017], an end-to-end approach was proposed to automatically detect the presence/absence of the surgical tools and the surgical activity at once on laparoscopic videos. The CNN was based on an extended version of AlexNet architecture. The features extracted by the CNN were fed to a SVM model to do surgical phases recognition. Also, a HMM model was on top of it to add the tempo-ral constraints. This method performed very well in recognizing the surgical phases in laparoscopic videos. They also demonstrated that a transfer learning approach, pre-trained on ImageNet dataset for example, significantly improve the results.
As demonstrated in the latest pipelines proposed in this field, the tool usage sig-nals contain strong discriminative and semantic information. Both handcrafted and features learning approaches proved that the tool usage signals is a key ingredient to any automatic SAR, thus the need to detect/recognize the surgical tools.
2.2.2.3.1 LaTIM Work on Surgery Videos Analysis
At LaTIM, The work in the field of surgical video analysis currently applies to the cataract surgery. In a first step, several methods have been developed to
auto-computationally expensive and therefore does not allow real-time assistance. The experiments were done on two different ocular datasets: membrane peeling and cataract dataset.
To simplify the problem, rather than analyzing a thorough surgical video, the prob-lem has been reduced to the classification of video sequences. The videos were cut into sequences where each of which represents a surgical activity. In this context, several methods adapted to real-time have been developed. [Quellec et al., 2014a] proposed to automatically cut out a surgical activity in elementary motions to fa-cilitate its recognition. The subsequences were described by vectors invariant to the variations in duration and speed of execution within surgical tasks. Then, they were compared to the archived subsequences. This system provided a very fast solution and good recognition rates.
(a) courtesy to [Quellec et al., 2015] (b) courtesy to [Quellec et al., 2015]
Figure 2.4: In blue, the motion fields approximated by spatio-temporal polynomi-als. In green, the motion fields between two consecutive images measured by the Farneb¨ack algorithm [Quellec et al., 2015].
A second method [Quellec et al., 2015] consists to approximate the displacement fields by a spatio-temporal polynomial during a short video sequence, as illustrated in Fig.2.4. For each surgical activity, a MIL process is performed to identify which spatio-temporal polynomials are extracted when this activity is performed in the video sequence. The same concept was applied for query video sequence in order to identify the surgical activity performed. The experiments were done on a cataract
tation of the videos (to indicate the beginning and the end of each surgical step). The next step was therefore to set up methods for segmenting these steps automat-ically. A real-time method of automatic segmentation in surgical activities has been proposed by [Quellec et al., 2014b]. This method is based on the fact that there is usually a transition period between two surgical activities (called idle activity), in which there is nothing taking place in the microscope field of view. This delay comes from the fact that the surgeon changes tools between two surgical tasks. The
(a) courtesy to [Quellec et al., 2014b]
(b) courtesy to [Quellec et al., 2014b]
Figure 2.5: In (a), the method of segmenting and categorizing of subsequences pro-posed by [Quellec et al., 2014b]. In (b), the activity recognition approach propro-posed by [Quellec et al., 2014b].
proposed method works initially on the detection of these transitions, based on a nearest neighbours cases approach. The surgery is then segmented temporally into ”action phase” and ”transition phase”. Whenever a ”transition phase” is detected, the ”action phase” preceding it is classified (As shown in Fig.2.5a). Conditional Random Fields (CRFs) were used for the classification part. The motion features between the current image and the previous one, color and texture features as well as duration of the ”transition phase” are used to build the visual signatures of the segments (As shown in Fig.2.5b). This method were evaluated on a cataract video dataset and the performance was fairly good. But, one main limitation in this approach is that several surgical activities can take place during the same action phase. This is the case if the ”transition phase” is not detected between two surgi-cal activities or if the surgeon has changed the tool from one hand to another while continuing the same action.
Lately, [Charri`ere et al., 2017] have proposed improvements to the previous work done in the team. At the outset, they relied on content-based search approach to automatically recognize the surgical activity in a subsequence of a surgical video. This part was based on the motion features extracted from the subsequences. Then, the method proposed in [Piciarelli and Foresti, 2006] was adapted to compare the

![Figure 5.4: Courtesy of [Canziani et al., 2016]. Complexity comparison between top scoring deep learning networks for ImageNet classification task until early 2017.](https://thumb-eu.123doks.com/thumbv2/123doknet/14538011.724342/91.892.161.758.367.583/courtesy-canziani-complexity-comparison-learning-networks-imagenet-classification.webp)