HAL Id: hal-02062499
https://hal.archives-ouvertes.fr/hal-02062499
Submitted on 2 Dec 2020HAL is a multi-disciplinary open access archive for the deposit and dissemination of sci-entific research documents, whether they are
pub-L’archive ouverte pluridisciplinaire HAL, est destinée au dépôt et à la diffusion de documents scientifiques de niveau recherche, publiés ou non,
Synthesis, crystallographic structure and
thermodynamic properties of T2-Al2MgC2
Guillaume Deffrennes, Bruno Gardiola, Erwann Jeanneau, Georges Mikaelian,
Benigni P., Alain Pasturel, Alexander Pisch, J. Andrieux, Olivier Dezellus
To cite this version:
Guillaume Deffrennes, Bruno Gardiola, Erwann Jeanneau, Georges Mikaelian, Benigni P., et al.. Synthesis, crystallographic structure and thermodynamic properties of T2-Al2MgC2. Journal of Solid State Chemistry, Elsevier, 2019, 273, pp.150-157. �10.1016/j.jssc.2019.02.039�. �hal-02062499�
Synthesis, crystallographic structure and
thermodynamic properties of T2-Al
2
MgC
2
Guillaume DEFFRENNESa, Bruno GARDIOLAa, Erwann JEANNEAUb, Georges Mikaelianc,
Pierre Benignic, Alain PASTURELd, Alexander PISCHd, Jérôme ANDRIEUXa, Olivier
DEZELLUSa*
a Laboratoire des Multimatériaux et Interfaces, Université Claude Bernard Lyon 1, Villeurbanne,
France
b Centre de Diffractométrie Henri Longchambon, Université Claude Bernard Lyon 1,
Villeurbanne, France
c Institut Matériaux Microélectronique Nanosciences de Provence, Universités d'Aix-Marseille et
de Toulon, Marseille, France
d Laboratoire de Science et Ingénierie des Matériaux et Procédés, Université Grenoble Alpes,
CNRS, Grenoble INP, Grenoble, France
Corresponding author : Dr. Olivier DEZELLUS
e-mail : [email protected]
Keywords : T2-Al2MgC2; Al-C-Mg; Crystal structure; Density Functional Theory (DFT);
Abstract
T2-Al2MgC2 was synthesized from the elements in a Mg-Al melt at 1000°C using sealed Ta
crucibles. Single crystals of T2-Al2MgC2 were extracted by evaporating the Mg-Al matrix. The
crystal structure of T2-Al2MgC2 was refined for the first time on the basis of single-crystal X-ray
diffraction. The crystal is trigonal (space group P-3m1, Z=1) with lattice parameters of
a=3.3767(11) Å, c=5.807(2) Å and V=57.34(5) Å3. Based on the refined crystal structure, DFT
calculations were conducted to evaluate the thermodynamic properties and the electronic structure
of the phase. The heat of formation of T2-Al2MgC2 was calculated to be -23.6 kJ/moles of atoms
at 298K. The heat capacity of T2-Al2MgC2 was measured by DSC from 300 to 871K and
calculated by DFT from 0 to 1000K. Based on the calculated heat capacity, the entropy of
formation of the phase at 298K was determined to be 70.0 J/mol/K. The band structure and the
electronic density of state of T2-Al2MgC2 was calculated leading to an indirect band gap value of
1. Introduction
Refinement of the microstructure of Mg-based materials provides an avenue for promoting their
competitiveness. As a matter of fact, a fine grain size leads to an improvement in creep resistance
[1], ductility and strength [2–5], as well as corrosion resistance [6] of Mg alloys. Carbon
inoculation is the primary method to achieve refined microstructures for Mg-Al alloys [7] while
the underlying mechanisms remain uncertain. Recently strong evidence [4,8,9] pointed towards
the heterogeneous nucleation of primary Mg on top of the Al2MgC2 ternary phase.
Another interesting approach for synthesizing mechanically-enhanced materials is the
development of magnesium-based composites. Indeed, reinforcements may improve the creep
resistance, strength and stiffness of the alloys. Various reinforcements were used to tailor the
Mg-matrix composites properties, and in particular a variety of carbon-based reinforcements such as
silicon carbide, titanium carbide, carbon nanotubes and boron carbide [10]. The formation of
Al2MgC2 carbide at the fibre/matrix interfaces of a C/Mg-Al MMC has a considerable influence
on the mechanical properties of the composite by changing the fibre/matrix bonding strength [11].
Although Al2MgC2 plays a major role in the grain refinement of Mg-Al alloys as well as in the
mechanical properties of Mg-Al based composites, the ternary phase and its thermodynamic
properties are not included in commercial thermodynamic databases [12–14]. This absence is due
to the fact that the thermodynamic properties of Al2MgC2 are mostly unknown as the high vapour
pressure and reactivity of Mg together with the fact that Al2MgC2 reacts vigorously with water
[8,15] make experimental work difficult.
As the synthesis, extraction and handling of hygroscopic Al2MgC2 single-crystals is challenging,
the crystal structure of this ternary carbide has only been determined by means of powder
Al2MgC2 which is stable above 727°C [16], was determined by Rietveld refinement by Bosselet
et al. (Trigonal, P-3m1, a=3.3770(9) Å, c=5.817(1) Å) [16] and by Kubus and Meyer (Trigonal,
P-3m1, a=3.3676(1) Å, c=5.7997(2) Å) [17]. The so-called T1-Al2MgC2 allotropic form of
Al2MgC2 was found to be predominant below 717°C but could not be synthesized free of the T2
crystalline variety [16]. T1-Al2MgC2 was indexed with a hexagonal symmetry with a=3.4017(7)
Å and c=12.292(2) Å [15]. While structural characterization by powder diffraction can be more
practical than single-crystal diffraction techniques, the quality of the structural information
obtained by the latter is considered to be more accurate and precise than the former [18].
A well-established crystal structure is a prerequisite in order to be able to perform predictive
DFT (density functional theory) calculations. The heat of formation of the T2-Al2MgC2 carbide
was calculated in the past using the GGA functional. The reported value with respect to Al-fcc,
Mg-hcp and C-graphite is -0.064 eV/moles of atoms [19], i.e. -6.18 kJ/moles of atoms. Recently
the authors investigated the heat of formation of Al4C3 in a study that will be published elsewhere
[20]. It was shown that the heat of formation of this binary carbide calculated using the GGA
functional was significantly too positive as compared to available experimental information,
notably due to a large error in the ground state energy of C-graphite. This discrepancy can be
explained by the fact that graphite, Al4C3 [21] and T2-Al2MgC2 are layered structures and that the
GGA functional is not suited to describe the weak interactions in the bonding energy between the
layers. Recently, the new SCAN (Strongly Conditioned and Appropriately Normed) semi-local
density functional was introduced which is particularly suited to describe the ground state
properties of layered materials [36]. As the SCAN functional gave much better results for Al4C3
In the present study, an alternative procedure to synthesize the T2-Al2MgC2 phase in a Mg-Al
melt at 1000°C using sealed Ta crucibles was developed. Single-crystals of the carbide phase were
obtained for the first time by evaporating the Mg-Al matrix at 800°C. The crystal structure of the
T2-Al2MgC2 phase was confirmed from single-crystal X-ray diffraction and heat capacity
measurements were performed by Differential Scanning Calorimetry (DSC). DFT calculations
using the SCAN functional were conducted from the refined structure to determine the
thermodynamic properties of the carbide phase.
2. Materials and methods 2.1. Materials
Commercial powders of magnesium (purity > 99,8 wt.%, grain size 150 < d < 850 μm, Alfa
Aesar), aluminium (purity > 99,8 wt.%, grain size 44 < d < 420 μm, Alfa Aesar) and graphite
(synthetic, d < 20 μm, Sigma Aldrich) were used in this study. The magnesium powder was
selected to be coarse in order to reduce the surface/volume ratio and the amount of MgO impurities.
The graphite powder was selected to be fine enough in order to avoid the isolation of coarse
graphite particles from the melt by the formation of a carbide layer at the graphite/alloy interface.
2.2. Sample preparation
The powders were mixed in mass ratio of Mg : Al : C = 70 : 19 : 11 which was selected on the
basis of the isothermal section proposed by Viala et al. at 727°C [15]. A liquid-rich overall
composition is expected in order to ensure that the sample is homogeneous and to enable crystal
growth. The selected overall composition is expected to lead to a three-phase equilibrium between
T2-Al2MgC2, graphite and a magnesium-rich liquid with phase amounts being roughly 67 wt.% of
Mg-rich matrix, 29wt.% of Al2MgC2 and 4wt.% of graphite. First of all, this ensured that the
single-crystals by evaporating the matrix, a magnesium-rich matrix was desired as aluminium is less
volatile than magnesium. Having a small amount of graphite as a side product ensures this
requirement and increases the T2-Al2MgC2 yield.
The details of the sample preparation were given elsewhere [22]. The main steps are ball-milling
of the powders in a tungsten carbide mortar and cold-pressing of the mixture under 250 MPa, both
being performed under protective Ar atmosphere (H2O = 26 ppm). Typical powder compacts
weighed 80 mg. Tantalum crucibles (purity > 99,95wt.%, Concept Metal) sealed under an absolute
pressure of 0.6 bar of Ar (purity>99.9999 %, Alphagaz 2, Air Liquide) were used for the synthesis.
2.3. Synthesis of T2-Al2MgC2
The powder compacts placed in sealed Ta crucibles were heat treated at 1000±4°C for 240 hours.
The Ta crucibles were sealed inside vitreous silica containers under an absolute Ar pressure of 0.2
bar in order to avoid external oxidation and oxygen diffusion through the Ta crucibles during the
heat treatment. The initial sample composition was not altered by magnesium evaporation as only
a negligible fraction of Mg was needed to supply its equilibrium vapour pressure given the
crucibles volume [22]. The samples were efficiently quenched by breaking the silica containers as
soon as they were removed from the furnace. X-ray diffraction was performed on the samples and
Figure 1. XRD Diffraction pattern of a 70Mg – 19Al – 11C sample heat-treated 240 hours at
1000°C and quenched. A kapton tape was used to protect Al2MgC2 from hydrolysis. The peaks
attributed to Mg were shifted to account for the Al solid solution. No MgO could be detected
within the detection range.
2.4 SEM-EDS
At the end of the heat treatments the Ta crucibles were opened using a diamond wire saw without
adding any lubricant. Samples were embedded in resin and polished using a water-free procedure
to prevent the hydrolysis of T2-Al2MgC2. The samples were pumped under dynamic high vacuum
for a few hours to remove trapped solvent or gases from the porosities. A conductive silver paint
was applied to the entire surface of the resin in air as quickly as possible (t<15min). The samples
were again placed under dynamic high vacuum before being transported to the electron microscope
in a static vacuum chamber. Standards made of Mg (purity > 99.9%, Goodfellow), Al (Purity >
prepared following the same procedure. SEM observations were made on a Zeiss Merlin Compact
SEM equipped with plasma cleaning equipment and an energy dispersive spectrometer (EDS).
Plasma cleaning of the samples significantly reduced the oxygen content and the carbon
contamination at the sample surface. An accelerating voltage of 10kV and a working distance of
8.5 mm were selected. For the EDS analysis, the beam was calibrated in energy using the graphite
standard. A counting time of 20 seconds was used for the measurements. The concentration of
each element was calculated from the ratios between intensity in the specimen and in the standard
using the PAP model [23].
2.5 Extraction of T2-Al2MgC2
As no selective etching solution exists to dissolve an Mg-Al matrix from T2-Al2MgC2 crystals,
the ternary carbide phase was extracted by evaporation of the Mg-Al matrix. After synthesis of
T2-Al2MgC2 (cf. 2.2) the Ta crucibles were opened and placed inside a 304L stainless steel tube.
The assembly was heated at 800±5°C in a conventional horizontal tube furnace with an Eurotherm
controller under dynamic high vacuum. During the evaporation, the Mg vapours were trapped out
of the furnace using a water-cooling circuit. After 30 minutes, the assembly was cooled in air
before being opened under a protective Ar atmosphere.
2.6 Single-crystal X-ray diffraction
After the extraction of T2-Al2MgC2, the resulting mixture was plunged in a perfluoropolyether
oil (FOMBLIN® YR1800, Solvay) to protect the T2-Al
2MgC2 single-crystals from hydrolysis. A
suitable crystal of T2-Al2MgC2 was selected and mounted on a Gemini kappa-geometry
diffractometer (Rigaku OD, 2015) equipped with an Atlas CCD detector and using Mo radiation
Intensities were collected at 150 K by means of the CrysalisPro software [24]. Reflection
indexing, unit-cell parameter refinement, Lorentz-polarization correction, peak integration and
background determination were carried out with the CrysalisPro software [24]. An analytical
absorption correction was applied using the modelled faces of the crystal [25]. The resulting set
of hkl was used for structure solution and refinement. The structures were solved by direct
methods with SIR97 [26] and the least-square refinement on F2 was achieved using the
CRYSTALS software [27]. All atoms were refined anisotropically.
2.7 Differential Scanning Calorimetry
The heat capacity measurements were performed in a DSC 111 calorimeter from the Setaram
Company by the so-called "small temperature steps procedure" or "discontinuous method" using
the classical three steps method as described by Höhne et al. [28]. Extensive details on the
experimental apparatus and protocol can be found elsewhere [29]. After the extraction of
T2-Al2MgC2, the resulting mixture was sealed in a stainless steel crucible under argon protective
atmosphere (O2 < 1 ppm, H2O = 26 ppm) inside a glovebox. In total, four stainless steel crucibles
were used. The first one was filled with 64.610 mg of the mixture resulting for the extraction of
T2-Al2MgC2, the second one with 61.375 mg of Standard Reference Material 720 α-Al2O3 [30],
and the third and fourth ones were sealed empty. The temperature program and the processing of
the recorded thermograms were performed with the SETSOFT 2000 software provided by
Setaram. A 2.5 K temperature step with a 1.5 K/min heating rate between each step and an 800 s
stabilization time after each step were selected. The heat capacity measurements were performed
between 300 and 871 K. A point by point correction factor, calculated from the ratio between the
reference [30] and the apparent heat capacity of α-Al2O3, was applied. Finally, it is important to
from its extraction. Therefore corrections were applied for the impurities assuming that heat
capacity were additive. The heat capacity function of the impurities used for the corrections were
obtained from the NIST-JANAF thermochemical tables [31] and practical details are given in the
discussion Section 3.3.
2.8 DFT calculations
The ground state properties of T2-Al2MgC2 were determined using DFT [32,33]. The VASP
software package [34,35] in its most recent version (5.4.4) was used for the calculations.
The many-body exchange correlation functionals for the elements were selected using prior
work by Pisch et al. on the ground state properties of Al4C3 [21]. For layered carbides, such as
graphite, Al4C3 and Al2MgC2 in this contribution, the Strongly Conditioned and Appropriately
Normed (SCAN) semi-local density functional [36] is particularly adapted. In addition, van der
Waals interactions were added in the calculations to take into account the long-range order
phenomena in these materials. The numerical routines from Klimes et al. [37,38] as implemented
in the VASP code were used. For Al, the 3s and 3p orbitals, for C, 2p and 2s orbitals and for Mg
the 3s orbitals are considered as valence states in the calculations. The energy cutoff for the
projector augmented plane-wave bases was set to 800 eV. An automatically generated, gamma
centered grid of k-points (26x26x15) in the irreducible part of the Brillouin zone was used
following the Monkhorst-Pack scheme [39].
The lattice parameters of T2-Al2MgC2 as well as the internal atomic coordinates were fully
relaxed. The linear tetrahedron method with Blöchl corrections [40] was used to calculate the
electronic density of states (DOS). The relaxations were performed with a convergence criterion
Finite temperature properties such as Zero Point Energy (ZPE) or heat capacities at constant
volume / pressure can be approximated using lattice dynamics theory. The phonon spectrum of
Al2MgC2 was determined using the frozen-phonon (Supercell) method with a 3x3x2 Supercell.
The vibrational modes were calculated using the phonopy code [41] coupled to VASP. The
convergence criterion for the Hellman-Feynman forces was set to 10-6 eV/Å to avoid any residual
strain in the lattice.
The total energy of formation for T2-Al2MgC2 at 0K in kJ/mol is obtained by subtracting the
weighted sum of the constitutive elements from the calculated ground state energy of the ternary
compound:
H(T2-Al2MgC2) = E(T2-Al2MgC2) – (2 E(Al-fcc) + E(Mg-hcp) + 2 E(C-graphite))
This formation energy is then corrected with respect to the calculated ZPE energies:
Hcor(T2-Al
2MgC2) = H(T2-Al2MgC2) + ZPE(Al2MgC2)
for which the ZPE correction was calculated as follows:
ZPE(T2-Al2MgC2) = ZPE(T2-Al2MgC2)- (2 ZPE(Al-fcc) + ZPE(Mg-hcp) + 2
ZPE(C-graphite))
The heat capacity at constant volume can be calculated in the harmonic approximation (HA)
using the phonon density of states as a function of frequency q of the band s:
𝐹(𝑉0, 𝑇) = 1 2∑ ℏ𝜔(𝑞, 𝑠) + 𝑘𝐵𝑇 ∑ 𝑙𝑛 [1 − 𝑒𝑥𝑝 ( −ℏ𝜔(𝑞,𝑠) 𝑘𝐵𝑇 )] 𝑞,𝑠 𝑞,𝑠
The vibrational entropy and the heat capacity at constant volume are given by:
𝑆 = − (𝜕𝐹
𝜕𝑇)𝑉; 𝐶𝑉 = −𝑇 ( 𝜕2𝐹 𝜕𝑇2)
𝑉
When repeating the HA calculations for several different volumes V to obtain a minimum value
of F(V,T), the heat capacity at constant pressure in the quasi-harmonic approximation QHA can
𝐶𝑃 = −𝑇 (𝜕
2𝐺(𝑇, 𝑃)
𝜕𝑇2 )
with G(T,P) = minV[E(V)+F(V;T)+PV].
The standard heat of formation at 298K of T2-Al2MgC2 was calculated using the calculated Cp
value from the quasi-harmonic approximation and the heat content values for the pure elements
Al-fcc, Mg-hcp and C-graphite from NIST-JANAF [31]. In addition, using the calculated thermal
expansion coefficient, the volume evolution can be calculated as a function of temperature. The
calculated cell volume value at 150K was compared to the experimental value.
3. Results and discussion 3.1 Synthesis of T2-Al2MgC2
The T2-Al2MgC2 carbide was synthesized at 1000±4°C for 240 hours from the composition
70Mg – 19Al – 11C wt.%. As expected from the isothermal section proposed by Viala et al. [15],
stoichiometric T2-Al2MgC2 crystals were obtained in a 97.7Mg-2.3Al wt.% (97.9Mg-2.1Al at.%)
matrix along with graphite located at the carbide – matrix interface and a few MgO particles. This
microstructure is shown in Fig. 2. Al2MgC2 crystals were hexagonal and rectangular shaped. The
MgO particles can be differentiated from the T2-Al2MgC2 crystals as they appear darker, have
softer edges, and are smaller. The results of the phase characterization by EDS measurements are
displayed in Table 1. The Al2MgC2 composition was determined statistically from a set of 19
crystals and is given for each element with an expanded uncertainty with 0.95 level of confidence.
The results are in good agreement with the theoretical phase stoichiometry. No carbon could be
detected in solution in the Mg-Al matrix within the detection limit. The limited amount of
wt.%Al measured after syntheses at 727°C by Viala et al. [15]. However, it is worth noting that
this composition is obtained after quenching the samples in the present study, and after natural
cooling in the case of Viala et al. [15].
Figure 2. SEM observation of a 70Mg – 19Al – 11C sample heat-treated 240 hours at 1000°C.
The microstructure is characterized by T2-Al2MgC2 crystals (grey), graphite (black), a
97.7Mg-2.3Al wt.% matrix (light grey) and MgO particles (dark grey).
Table 1. Composition in wt.% (at.%) of the phases formed in 70Mg – 19Al – 11C wt.% samples
heat-treated 240 hours at 1000°C
Phase wt.% (at.%) Mg wt.% (at.%) Al wt.% (at.%) C Matrix 97.7 (97.9) 2.3 (2.1) -
T2-Al2MgC2 exp. 23.9±0.5 (20.2±0.4) 53.2±0.7 (40.5±0.7) 23.0±0.5 (39.3±0.7)
T2-Al2MgC2 th. 23.8 (20.0) 52.8 (40.0) 23.5 (40.0)
3.2 Extraction of Al2MgC2 single-crystals
If it is assumed that the Al content in the liquid in equilibrium with graphite and T2-Al2MgC2 at
1000°C is 2.3 wt.% (2.1 at.%) (cf. 3.1), the fraction of each phase can be found from the overall
composition and the composition of each phase at 1000°C. In such case, the liquid in equilibrium
weight loss resulting from evaporation was found to be approximately 60 wt.%., which is coherent
with the expected loss and suggests that evaporation was complete.
After evaporation, the aspect of the powder compact changed from metallic to friable brown
coloured, composed of T2-Al2MgC2 single crystals along with graphite, MgO, and Al4C3. The
Al4C3 phase was formed during the evaporation process as it was not found during the SEM
analysis performed on the bulk sample after the synthesis. Indeed, as the magnesium evaporates,
the liquid becomes richer in aluminium and is able to react with graphite to form Al4C3. Optical
microscope images of T2-Al2MgC2 single-crystals are shown in Fig. 3. The crystals were
micrometric and hexagonal platelet-shaped, brownish, transparent and shiny, typically with a
smooth surface on one side and a rough surface on the other, and were often found stuck to one
another.
Figure 3. Optical microscope images of T2-Al2MgC2 crystals along with graphite at a
magnification of 50X. The crystals were plunged in a perfluoropolyether oil to protect them from
hydrolysis.
Synthesis and extraction of single crystals of the low-temperature allotropic form of Al2MgC2,
3.2 Crystallographic structure of T2-Al2MgC2
The T2-Al2MgC2 carbide phase synthesized at 1000°C crystallizes in a trigonal structure (space
group P-3m1 and Z=1) represented in Fig. 3. The structure and the details of its determination can
be found in Table 2. Atom coordinates and thermal displacement parameters can be found in Table
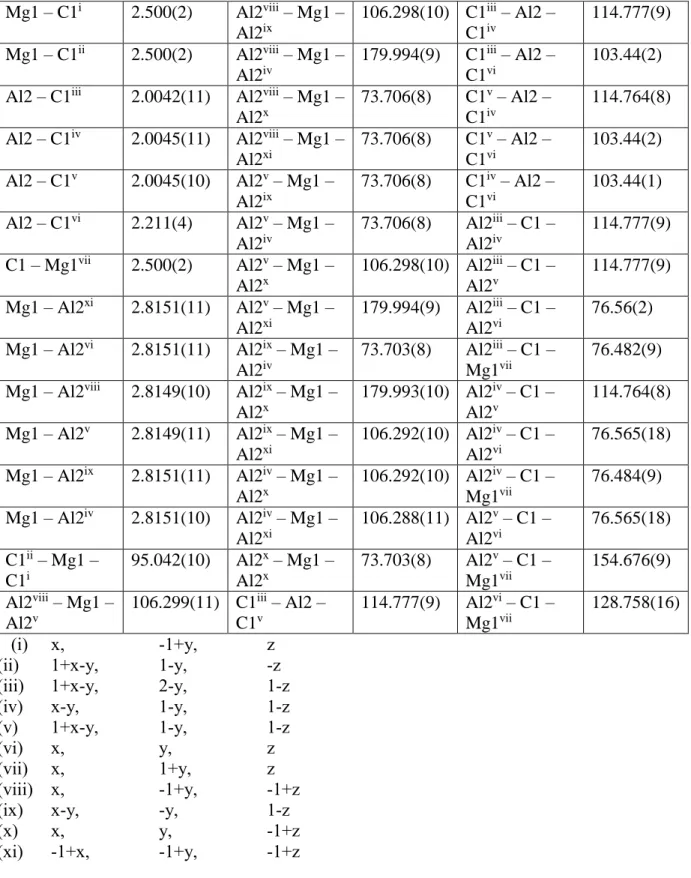
3. Sites were found to be of full occupancy. Distances and angles between atoms can be found in
Table 4.
As illustrated in Fig. 4, the crystal structure of T2-Al2MgC2 is characterized by alternating layers
of Mg occupying the vertices of the trigonal lattice and of Al / C. The Al / C layers are composed
of distorted aluminium and carbon tetrahedrons imbricated one in the other. Magnesium atoms are
located in a carbon trigonal antiprism. Aluminium atoms are surrounded by a carbon tetrahedron.
Carbon atoms are situated inside a polyhedron formed by a trigonal antiprism between three
magnesium atoms and a four aluminium atom tetrahedron.
Figure 4. (a) Crystal structure of T2-Al2MgC2. Al, C and Mg surroundings as well as Al / C
The lattice parameter a of 3.3767 Å, corresponding to the bond length separating Mg atoms, is
close to the Mg-Mg distance of 3.2093 Å in the hexagonal close-packed magnesium structure
[Str49]. The Al-C bond lengths of 2.0042(11), 2.0045(10), 2.0045(11) and 2.211(4) Å match the
Al-C bond lengths observed for the Al4C3 phase, viz. 1.89, 1.95 and 2.19 Å [42]. The Mg-C bond
length of 2.500(2) Å is slightly longer than the Mg-C bond lengths reported for metastable
magnesium carbide phases at atmospheric pressure [43], viz. from 2.21 to 2.46 Å for Mg2C3 [44],
2.174(4) Å for MgC2 [45], and 2.36 Å for Mg2C recently synthesized by Kurakevych et al. [46].
Therefore, a weak bonding can be expected between the Mg and Al / C layers. As a result, an
interesting and challenging perspective would be the delamination of the structure similarly to the
formation of MXenes from the MAX phases [47,48] in order to obtain a two-dimensional AlC
material.
The lattice parameters found in this work are in very good agreement with those obtained from
X-ray powder diffraction in the literature [16,17]. A slight difference is found for the z coordinate
of the Al2 and C1 atoms in the structure between this work (respectively 0.6503(2) and 0.2695(6)
(cf. Table 3) and the results from Kubus et al. [17] (resp. 0.6525(4) and 0.266(8)) and Bosselet et
Table 2. Structure refinement of T2-Al2MgC2
Crystal Shape Hexagonal Platelet Crystal Appearance Transparent and shiny Crystal Size 0.10x0.09x0.02 mm² Crystal System Trigonal
Space Group P-3m1 (164)
Temperature 150 K
Lattice Parameters a= 3.3767(11) Å c= 5.807(2) Å Cell Volume 57.34(5) Å3
Formula Weight 102.29 g/mol
Z 1 Density, calculated 2.962 g/cm3 Radiation MoKα (λ=0.71073 Å) hkl range -5≤h≤5, -5≤k≤5, -9≤l≤9 θ-range 3.45° - 36.06° Reflections measured 1292 Independent Reflections 139 Reflections I > 2σ(I) 121 Absorption correction Analytical
Rint 0.089
Absorption coefficient 1.127 cm-1
Transmission min. / max. 0.919 / 0.974 Min / Max residual
electron density e-/Å3 -0.62 / 0.67
Table 3. Coordinates and thermal displacement parameters of T2-Al2MgC2 (in Å2)
Atom / Wyckoff position / Site symmetry
x y z Ueq U11=U22 U33 U12
Mg1 / 1a / -3m 0 0 0 0.0085 0.0095(6) 0.0065(8) 0.0047(3) Al2 / 2d / 3m 1/3 2/3 0.6503(2) 0.0059 0.0059(4) 0.0057(6) 0.0030(2) C1 / 2d / 3m 1/3 2/3 0.2695(6) 0.0053 0.0054(7) 0.0051(12) 0.0027(3)
Table 4. Distances (in Å) and angles (in °) in T2-Al2MgC2 Mg1 – C1i 2.500(2) Al2viii – Mg1 – Al2ix 106.298(10) C1iii – Al2 – C1iv 114.777(9) Mg1 – C1ii 2.500(2) Al2viii – Mg1 – Al2iv 179.994(9) C1iii – Al2 – C1vi 103.44(2)
Al2 – C1iii 2.0042(11) Al2viii – Mg1 –
Al2x
73.706(8) C1v – Al2 –
C1iv
114.764(8)
Al2 – C1iv 2.0045(11) Al2viii – Mg1 – Al2xi 73.706(8) C1v – Al2 – C1vi 103.44(2) Al2 – C1v 2.0045(10) Al2v – Mg1 – Al2ix 73.706(8) C1iv – Al2 – C1vi 103.44(1) Al2 – C1vi 2.211(4) Al2v – Mg1 – Al2iv 73.706(8) Al2iii – C1 – Al2iv 114.777(9) C1 – Mg1vii 2.500(2) Al2v – Mg1 – Al2x 106.298(10) Al2iii – C1 – Al2v 114.777(9) Mg1 – Al2xi 2.8151(11) Al2v – Mg1 – Al2xi 179.994(9) Al2iii – C1 – Al2vi 76.56(2) Mg1 – Al2vi 2.8151(11) Al2ix – Mg1 – Al2iv 73.703(8) Al2iii – C1 – Mg1vii 76.482(9)
Mg1 – Al2viii 2.8149(10) Al2ix – Mg1 –
Al2x 179.993(10) Al2iv – C1 – Al2v 114.764(8) Mg1 – Al2v 2.8149(11) Al2ix – Mg1 – Al2xi 106.292(10) Al2iv – C1 – Al2vi 76.565(18) Mg1 – Al2ix 2.8151(11) Al2iv – Mg1 – Al2x 106.292(10) Al2iv – C1 – Mg1vii 76.484(9) Mg1 – Al2iv 2.8151(10) Al2iv – Mg1 – Al2xi 106.288(11) Al2v – C1 – Al2vi 76.565(18) C1ii – Mg1 – C1i 95.042(10) Al2x – Mg1 – Al2x 73.703(8) Al2v – C1 – Mg1vii 154.676(9) Al2viii – Mg1 – Al2v 106.299(11) C1iii – Al2 – C1v 114.777(9) Al2vi – C1 – Mg1vii 128.758(16) (i) x, -1+y, z
(ii) 1+x-y, 1-y, -z (iii) 1+x-y, 2-y, 1-z (iv) x-y, 1-y, 1-z (v) 1+x-y, 1-y, 1-z
(vi) x, y, z
(vii) x, 1+y, z (viii) x, -1+y, -1+z (ix) x-y, -y, 1-z
(x) x, y, -1+z
3.3 Thermodynamic properties of T2-Al2MgC2
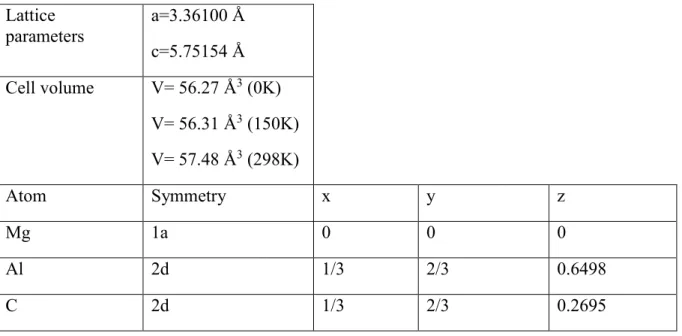
The calculated lattice parameters and the fully relaxed atomic positions are reproduced in Table
5. The calculated values are in good agreement with the experimental data from single-crystal
X-ray diffraction displayed in Tables 2 and 3.
Table 5. Lattice parameters, cell volume and atomic positions of T2-Al2MgC2 calculated using
the SCAN functional, the VASP code and an energy cutoff of 800 eV
Lattice parameters a=3.36100 Å c=5.75154 Å Cell volume V= 56.27 Å3 (0K) V= 56.31 Å3 (150K) V= 57.48 Å3 (298K) Atom Symmetry x y z Mg 1a 0 0 0 Al 2d 1/3 2/3 0.6498 C 2d 1/3 2/3 0.2695
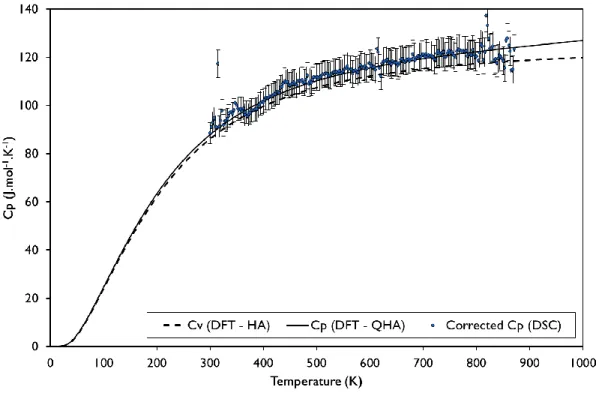
Heat capacities at constant volume and constant pressure were calculated from 0K to 1000K by
DFT and were measured at constant pressure by DSC from 300 to 871K. The DSC measurements
were performed on the mixture resulting from the extraction of T2-Al2MgC2 and corrections had
to be applied to take into account the presence of impurities. T2-Al2MgC2, graphite, MgO, Al4C3,
Al and Ta was detected by XRD. It is noteworthy that the hydrolysis of T2-Al2MgC2 was prevented
during the whole processing as Al2MgO4 was not detected. Rietveld analysis was attempted
Al2MgC2 was calculated from the global composition and the composition of each phases as
measured by EDS (cf. Section 3.1) and was further supported by microscopy image analysis. The
proportion of MgO was estimated between 1 to 6.6 wt.% based on microscopy image analysis.
Regarding Al4C3, the phase forms during the evaporation process when the remaining Al react
with graphite as discussed in Section 3.2. As the evaporation of Al is negligible at 800°C, the
proportion of those Al4C3, Al and graphite phases is therefore linked to the advancement of this
reaction and their proportion intervals were selected to be from no reaction to a complete reaction.
Finally, the amount of Ta was roughly estimated to be between 1 and 3 wt.%. From the proportion
intervals of each impurity an upper and a lower limit of the corrected heat capacity could be
obtained resulting in a mean with an uncertainty of ±4.2%. This uncertainty adds to the one on the
raw heat capacity measurements estimated at ±2.5% [29], and a final combined uncertainty of
±4.9% is determined. The results from DFT and DSC measurements are plotted in Fig. 5. A good
Figure 5. Heat capacity of Al2MgC2 as calculated at constant volume using the harmonic
approximation (dotted line) and at constant pressure using the quasi-harmonic approximation
(solid line) and as measured by DSC (symbols). Corrections were applied on the experimental
measurements for the impurities. Because of an insufficient knowledge of the phase proportions,
the experimental heat capacity data points plotted are a mean between the upper and lower limit
of the corrected results as detailed in the discussion.
The calculated thermodynamic properties of T2-Al2MgC2 are summarized in Table 6.
T2-Al2MgC2 is stable with respect to its constituents at 0K and also at room temperature. The entropy
of formation was calculated from by integrating the heat capacity data in the quasi-harmonic
Table 6. Calculated thermodynamic properties of T2-Al2MgC2. The heats of formation are
referred to elemental Al-fcc, Mg-hcp and C-graphite at the given temperature and the values for
Al-fcc and C-graphite were taken from [21]. The heat contents from 0K to 298K of Al-fcc,
Mg-hcp and C-graphite used to determine standard heat of formation of T2-Al2MgC2 were taken from
[31]. A correction of -1.95 kJ/moles of atoms relative to the difference between the ideal
C-graphite and true C-C-graphite was applied to the standard heat of formation of T2-Al2MgC2 as
described in [21].
fH(0K) -20.0 kJ/moles of atoms
corH(0K) (with ZPE correction) -20.9 kJ/moles of atoms
Cv(298K) (DFT – HA) 85.6 J/mol K Cp(298K) (DFT – QHA) 87.4 J/mol K H(298K) – H(0K) (from QH approximation) 12.7 kJ/molK
fH(298K) -23.6 kJ/moles of atoms
S0(298K) 70.0 J/mol K
3.4 Electronic and lattice dynamic properties of T2-Al2MgC2
The calculated electronic density of state (DOS) as well as the band structure of T2-Al2MgC2
is presented in Fig.6. An indirect band gap of 1.74 eV was calculated which is close to the value
reported for calculations using the GGA functional [19]. It is important to recall, that semi-local
DFT calculations tend to underestimate the band gap values and the real experimental value may
therefore higher.
The total and partial phonon density of state as well as the phonon band structure is reproduced
in Fig. 7. Magnesium essentially contributes to the acoustic branch of the phonon spectrum while
function of temperature T in the quasi-harmonic approximation is presented in Fig. 8. The
calculated volume at 298K in the quasi-harmonic approximation is close to the experimental value
with a difference below 1%.
Fig. 6: Calculated total electronic density of states (DOS) and band structure for T2-Al2MgC2
Figure 7. Calculated phonon density of states and phonon band structure for T2-Al2MgC2 from
Figure 8. Calculated volumetric thermal expansion coefficient β as a function of temperature T
for T2-Al2MgC2 in the quasi-harmonic approximation
4. Conclusion
The T2-Al2MgC2 phase was synthesized in sealed Ta crucibles. Single-crystals of the allotropic
form of Al2MgC2, stable above 727°C, were extracted and characterized. The crystal structure of
the T2-Al2MgC2 was obtained on the basis of single-crystal diffraction and was found to be in
good agreement with results in the literature obtained from powder diffraction. Based on the
refined structure, DFT calculations were conducted and the enthalpy of formation of T2-Al2MgC2
was estimated to be -23.6kJ/moles of atoms at 298K. The heat capacity of T2-Al2MgC2 was
calculated using the harmonic and quasi-harmonic approximations in good agreement with DSC
coefficient of T2-Al2MgC2 was calculated in the quasi-harmonic approximations. The indirect
band gap of the ternary carbide was found to be 1.73 eV. The thermodynamic properties of
T2-Al2MgC2 investigated in this work are prerequisite for the CALPHAD modeling of the phase. This
is the first step toward obtaining a complete thermodynamic database of the Al-C-Mg system,
enabling the accelerated development of processes such as the grain refinement of Mg-Al alloys
and of Mg-based composites.
This research did not received any specific grant from funding agencies in the public,
commercial, or not-for-profit sectors. The authors wish to thank the GDR CNRS n°3584
(TherMatHT) community where fruitful discussions led to collaboration on this project. The
assistance of members of the “Centre Technologique des Microstructures, Université Lyon 1”
(CTμ, http://microscopies.univ-lyon1.fr) for SEM characterizations is gratefully acknowledged.
Thanks are also due to Stéphane Martinez (Mechanical Workshop of the University Claude
Bernard Lyon 1) and François Cauwet (LMI, Université Claude Bernard Lyon 1) for their help on
designing the experimental assembly. The authors are grateful to Catherine Tassin-Arques and
Magali Morais (SiMaP, Université Grenoble Alpes) for providing the experimental set-up used to
References
[1] C.J. Bettles, M.A. Gibson, S.M. Zhu, Microstructure and mechanical behaviour of an elevated temperature Mg-rare earth based alloy, Materials Science and Engineering: A. 505 (2009) 6–12. doi:10.1016/j.msea.2008.11.004.
[2] C.H. Caceres, G.E. Mann, J.R. Griffiths, Grain Size Hardening in Mg and Mg-Zn Solid Solutions, Metallurgical and Materials Transactions A. 42 (2011) 1950–1959.
doi:10.1007/s11661-010-0599-2.
[3] M. Suresh, A. Srinivasan, K.R. Ravi, U.T.S. Pillai, B.C. Pai, Microstructural refinement and tensile properties enhancement of Mg–3Al alloy using charcoal additions, Materials Science and Engineering: A. 528 (2011) 2502–2508. doi:10.1016/j.msea.2010.12.008. [4] M. Suresh, A. Srinivasan, U.T.S. Pillai, B.C. Pai, Mechanism for Grain Refinement and
Mechanical Properties of AZ91 Mg Alloy by Carbon Inoculation, Procedia Engineering. 55 (2013) 93–97. doi:10.1016/j.proeng.2013.03.225.
[5] J. Du, J. Yang, M. Kuwabara, W. Li, J. Peng, Effects of Carbon and/or Alkaline Earth Elements on Grain Refinement and Tensile Strength of AZ31 Alloy, MATERIALS TRANSACTIONS. 49 (2008) 2303–2309. doi:10.2320/matertrans.MRA2008146. [6] K.D. Ralston, N. Birbilis, Effect of Grain Size on Corrosion: A Review, Corrosion. 66
(2010) 075005-075005–13. doi:10.5006/1.3462912.
[7] Y.C. Lee, A.K. Dahle, D.H. StJohn, The role of solute in grain refinement of magnesium, Metallurgical and Materials Transactions A. 31 (2000) 2895–2906.
doi:10.1007/BF02830349.
[8] Y. Huang, K.U. Kainer, N. Hort, Mechanism of grain refinement of Mg–Al alloys by SiC inoculation, Scripta Materialia. 64 (2011) 793–796. doi:10.1016/j.scriptamat.2011.01.005. [9] H.-L. Wang, J.-J. Tang, Y.-J. Zhao, J. Du, First-principles study of Mg/Al2MgC2
heterogeneous nucleation interfaces, Applied Surface Science. 355 (2015) 1091–1097. doi:10.1016/j.apsusc.2015.04.046.
[10] A. Dey, K.M. Pandey, Magnesium Metal Matrix Composites - A Review, Reviews on Advanced Materials Science. 42 (2015) 58–67.
[11] A. Feldhoff, E. Pippel, J. Woltersdorf, Carbon-fibre reinforced magnesium alloys: nanostructure and chemistry of interlayers and their effect on mechanical properties, Journal of Microscopy. 196 (1999) 185–193. doi:10.1046/j.1365-2818.1999.00618.x. [12] FactSage FTLite, FactSage Software FTlite database version 7.2 (accessed 03 march 2018),
2018.
[13] Thermo-Calc TCMG, Thermo-Calc Software TCMG database version 4 (accessed 15 march 2018), 2018.
[14] CompuTherm PanMg, CompuTherm LLC Pandat Software PanMg2017 DATABASE (accessed 15 march 2018), 2017.
[15] J.C. Viala, G. Claveyrolas, F. Bosselet, J. Bouix, The chemical behaviour of carbon fibres in magnesium base Mg-Al alloys, Journal of Materials Science. 35 (2000) 1813–1825. [16] F. Bosselet, B.F. Mentzen, J.C. Viala, M.A. Etoh, J. Bouix, Synthesis, and structure of
T2-Al2MgC2, European Journal of Solid State and Inorganic Chemistry. 35 (1998) 91–99. doi:10.1016/S0992-4361(98)80017-9.
[18] K.D.M. Harris, M. Tremayne, B.M. Kariuki, Contemporary Advances in the Use of Powder X-Ray Diffraction for Structure Determination, Angewandte Chemie International Edition. 40 (2001) 1626–1651.
doi:10.1002/1521-3773(20010504)40:9<1626::AID-ANIE16260>3.0.CO;2-7.
[19] K. Persson, Materials Data on Mg(AlC)2 (SG:164) by Materials Project, (2014). doi:10.17188/1313297.
[20] A. Pisch, A. Pasturel, G. Deffrennes, O. Dezellus, G. Mikaelian, P. Benigni, Submitted to Computational Materials Science.
[21] J.L. Kennedy, T.D. Drysdale, D.H. Gregory, Rapid, energy-efficient synthesis of the
layered carbide, Al 4 C 3, Green Chemistry. 17 (2015) 285–290. doi:10.1039/C4GC01277A.
[22] G. Deffrennes, B. Gardiola, M. Lomello, J. Andrieux, O. Dezellus, R. Schmid-Fetzer, Thermodynamics of Phase Formation in Mg–Al–C Alloys Applied to Grain Refinement, in: D. Orlov, V. Joshi, K.N. Solanki, N.R. Neelameggham (Eds.), Magnesium Technology 2018, Springer International Publishing, Cham, 2018: pp. 323–327. doi:10.1007/978-3-319-72332-7_49.
[23] J. Pouchou, F. Pichoir, Very High Elements x-Ray-Microanalysis - Recent Models of Quantification, J. Microsc. Spectrosc. Electron. 11 (1986) 229–250.
[24] Rigaku Oxford Diffraction, CrysAlisPro 1.171.38.41, 2015.
[25] R.C. Clark, J.S. Reid, The analytical calculation of absorption in multifaceted crystals, Acta Crystallographica Section A Foundations of Crystallography. 51 (1995) 887–897.
doi:10.1107/S0108767395007367.
[26] A. Altomare, M.C. Burla, M. Camalli, G.L. Cascarano, C. Giacovazzo, A. Guagliardi, A.G.G. Moliterni, G. Polidori, R. Spagna, SIR 97: a new tool for crystal structure determination and refinement, Journal of Applied Crystallography. 32 (1999) 115–119. doi:10.1107/S0021889898007717.
[27] P.W. Betteridge, J.R. Carruthers, R.I. Cooper, K. Prout, D.J. Watkin, CRYSTALS version 12: software for guided crystal structure analysis, Journal of Applied Crystallography. 36 (2003) 1487–1487. doi:10.1107/S0021889803021800.
[28] G. Höhne, W. Hemminger, H.-J. Flammersheim, Differential scanning calorimetry, Springer, Heidelberg; New York, 2010.
[29] P. Benigni, G. Mikaelian, R. Pothin, A. Berche, R.M. Ayral, J.C. Tedenac, P. Jund, J. Rogez, Measurement of the heat capacity of ZnSb by DSC between 300 and 673 K, Calphad. 55 (2016) 238–242. doi:10.1016/j.calphad.2016.09.008.
[30] G.A. Uriano, Standard Reference Material 720 Synthetic Sapphire (α-Al2O3), National Bureau of Standards Certificate. (1982).
[31] M.W. Chase, National Institute of Standards and Technology (U.S.), eds., NIST-JANAF thermochemical tables, 4th ed, American Chemical Society ; American Institute of Physics for the National Institute of Standards and Technology, Washington, DC : New York, 1998. [32] P. Hohenberg, W. Kohn, Inhomogeneous Electron Gas, Physical Review. 136 (1964)
B864–B871. doi:10.1103/PhysRev.136.B864.
[33] W. Kohn, L.J. Sham, Self-Consistent Equations Including Exchange and Correlation Effects, Physical Review. 140 (1965) A1133–A1138. doi:10.1103/PhysRev.140.A1133. [34] G. Kresse, J. Furthmüller, Efficient iterative schemes for ab initio total-energy calculations
using a plane-wave basis set, Physical Review B. 54 (1996) 11169–11186. doi:10.1103/PhysRevB.54.11169.
[35] G. Kresse, D. Joubert, From ultrasoft pseudopotentials to the projector augmented-wave method, Physical Review B. 59 (1999) 1758–1775. doi:10.1103/PhysRevB.59.1758. [36] J. Sun, A. Ruzsinszky, J.P. Perdew, Strongly Constrained and Appropriately Normed
Semilocal Density Functional, Physical Review Letters. 115 (2015). doi:10.1103/PhysRevLett.115.036402.
[37] J. Klimeš, D.R. Bowler, A. Michaelides, Chemical accuracy for the van der Waals density functional, Journal of Physics: Condensed Matter. 22 (2010) 022201. doi:10.1088/0953-8984/22/2/022201.
[38] J. Klimeš, D.R. Bowler, A. Michaelides, Van der Waals density functionals applied to solids, Physical Review B. 83 (2011). doi:10.1103/PhysRevB.83.195131.
[39] H.J. Monkhorst, J.D. Pack, Special points for Brillouin-zone integrations, Physical Review B. 13 (1976) 5188–5192. doi:10.1103/PhysRevB.13.5188.
[40] P.E. Blöchl, O. Jepsen, O.K. Andersen, Improved tetrahedron method for Brillouin-zone integrations, Physical Review B. 49 (1994) 16223–16233.
doi:10.1103/PhysRevB.49.16223.
[41] A. Togo, I. Tanaka, First principles phonon calculations in materials science, Scripta Materialia. 108 (2015) 1–5. doi:10.1016/j.scriptamat.2015.07.021.
[42] G.A. Jeffrey, V. Wu, The structure of the aluminum carbonitrides. II, Acta Crystallographica. 20 (1966) 538–547. doi:10.1107/S0365110X66001208.
[43] H. Liu, G. Gao, Y. Li, J. Hao, J.S. Tse, Crystal Structures and Chemical Bonding of Magnesium Carbide at High Pressure, The Journal of Physical Chemistry C. 119 (2015) 23168–23174. doi:10.1021/acs.jpcc.5b07862.
[44] H. Fjellvaag, P. Karen, Crystal structure of magnesium sesquicarbide, Inorganic Chemistry. 31 (1992) 3260–3263. doi:10.1021/ic00041a018.
[45] P. Karen, A. Kjekshus, Q. Huang, V.L. Karen, The Crystal Structure of Magnesium Dicarbide, Journal of Alloys and Compounds. 282 (1999) 72–75.
[46] O.O. Kurakevych, T.A. Strobel, D.Y. Kim, G.D. Cody, Synthesis of Mg 2 C: A Magnesium
Methanide, Angewandte Chemie International Edition. 52 (2013) 8930–8933. doi:10.1002/anie.201303463.
[47] V.M. Hong Ng, H. Huang, K. Zhou, P.S. Lee, W. Que, J.Z. Xu, L.B. Kong, Recent progress in layered transition metal carbides and/or nitrides (MXenes) and their composites:
synthesis and applications, Journal of Materials Chemistry A. 5 (2017) 3039–3068. doi:10.1039/C6TA06772G.
[48] O. Mashtalir, M. Naguib, V.N. Mochalin, Y. Dall’Agnese, M. Heon, M.W. Barsoum, Y. Gogotsi, Intercalation and delamination of layered carbides and carbonitrides, Nature Communications. 4 (2013). doi:10.1038/ncomms2664.


![Table 6. Calculated thermodynamic properties of T2-Al 2 MgC 2 . The heats of formation are referred to elemental Al-fcc, Mg-hcp and C-graphite at the given temperature and the values for Al-fcc and C-graphite were taken from [21]](https://thumb-eu.123doks.com/thumbv2/123doknet/14662431.739990/24.918.111.792.413.676/calculated-thermodynamic-properties-formation-referred-elemental-graphite-temperature.webp)
