Beyond CPU: Considering Memory Power Consumption of Software
9
0
0
Texte intégral
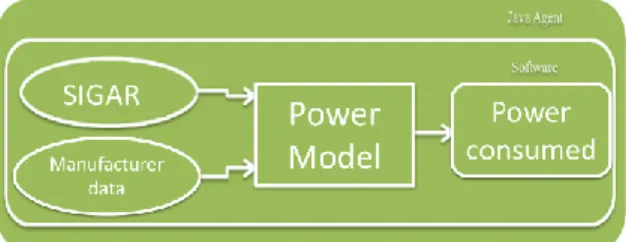
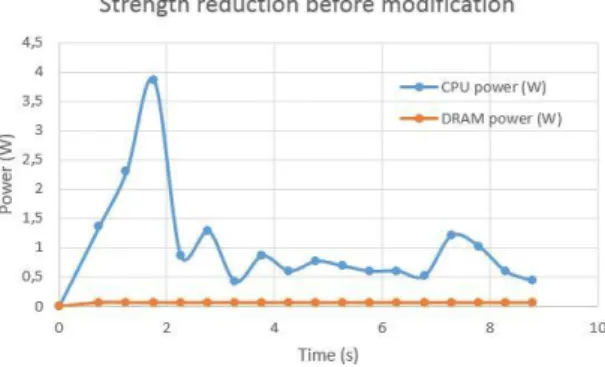
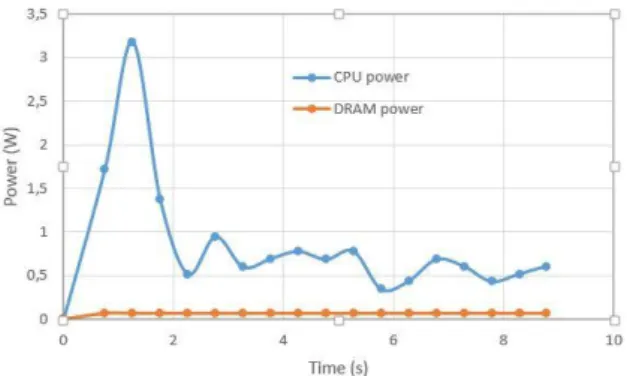
Figure
Documents relatifs