HAL Id: tel-02096272
https://tel.archives-ouvertes.fr/tel-02096272
Submitted on 11 Apr 2019
HAL is a multi-disciplinary open access archive for the deposit and dissemination of sci-entific research documents, whether they are pub-lished or not. The documents may come from teaching and research institutions in France or abroad, or from public or private research centers.
L’archive ouverte pluridisciplinaire HAL, est destinée au dépôt et à la diffusion de documents scientifiques de niveau recherche, publiés ou non, émanant des établissements d’enseignement et de recherche français ou étrangers, des laboratoires publics ou privés.
Bashar Al-Nuaimi
To cite this version:
Bashar Al-Nuaimi. Ancestral Reconstruction and Investigations of Genomics Recombination on
Chloroplasts Genomes. Bioinformatics [q-bio.QM]. Université Bourgogne Franche-Comté, 2017. En-glish. �NNT : 2017UBFCD042�. �tel-02096272�
Thèse de Doctorat
é c o l e d o c t o r a l e s c i e n c e s p o u r l ’ i n g é n i e u r e t m i c r o t e c h n i q u e s
U N I V E R S I T É D E F R A N C H E - C O M T É
n
Ancestral Reconstruction and
Investigations of Genomics
Recombination on Chloroplasts
Genomes
Thèse de Doctorat
é c o l e d o c t o r a l e s c i e n c e s p o u r l ’ i n g é n i e u r e t m i c r o t e c h n i q u e s
U N I V E R S I T É D E F R A N C H E - C O M T É
THESE DE DOCTORAT DE L’ETABLISSEMENT UNIVERSITE
BOURGOGNE FRANCHE-COMTE
PREPAREE A Université de Franche-Comté
École doctorale n°37
Sciences Physiques pour l'Ingénieur et Micro techniques
Doctorat de spécialité:
Informatique
Ancestral Reconstruction and Investigations of Genomics
Recombination on Chloroplasts Genomes
By
Bashar Talib Hameed Al-Nuaimi
PR. ARNAUD LEROUZIC Rapporteur
PR. FRÉDÉRICMAGOULÉS
Universit
é de
Paris-SudUniversité de Paris-Saclay Rapporteur
PR. CHRISTOPHE GUYEUX Université deFranche-Comté Examinateur
N◦ 2 1 4 1 1 3 4 5
Thèse présentée et soutenue à Besançon le 13 octobre 2017
Composition du Jury :
Throughout my life, one person has always been there during those difficult and trying times. I would like to dedicate this thesis and everything I do to my wife. In addition to my family, I have always been surrounded by strong supportive friends. I would not be who I am today without the support of my supervisor Jean-François COUCHOT
I also dedicate this work to my friends ; Bassam Alkindy and Abbas Abdul Azeez, who has encouraged me all the way and whose encouragement has made sure that I give it all it takes to finish that which I have started.
Firstly, I would like to express my sincere gratitude to my adviser Dr. Jean-François COUCHOT for the continuous support of my Ph.D. study and related research, for his patience, motivation, and immense knowledge. His guidance helped me in all the time of research and writing of this thesis. I could not have imagined having a better adviser and mentor for my Ph.D. study.
Besides my adviser, I would like to thank the rest of my thesis committee : Prof. Christophe Guyeux, Prof. Frédéric Magoulès, Prof. Arnaud Le Rouzic, and Prof. Sylvain Contassot-Vivier for their insightful comments and encouragement, but also for the hard question which incented me to widen my research from various perspectives.
My sincere thanks also goes to Prof. Raphaël Couturier, Dr. Michel Salomon, who provided me an opportunity to join their team as intern, and who gave access to the laboratory and research facilities. Without they precious support it would not be possible to conduct this research.
My gratitude and my thanks go to the crew members of DISC for the friendly and warm atmosphere in which it supported me to work. Therefore, Thanks Julien Bourgeois, director of DISC (Informatique des systèmes complexes) department in Besançon, Dominique Menetrier, Jean-Michel Caricand, Laurent Steck, Stéphanie Pardo and to all other people if I forget his name. For their unwavering support and encouragement.
I would also like to express my strongly thanks to the crew of supercomputer facili-ties (Mesocentre) for their generous advices and help in launching the calculations using supercomputer capabilities by installing the modules, creation the site Internet that makes dreams come true. Therefore, thanks to Laurent Philippe, Kamel Mazouzi, Guillaume Laville, and Cédric Clerget.
I thank my fellow labmates in for the stimulating discussions, for the sleepless nights we were working together before deadlines, and for all the fun we have had in the last four years. Also, I thank my friends in the following institution Panisa Treepong, Serge Moulin. In particular, I am grateful to Dr. Bassam Alkindy for enlightening me the first glance of research.
Last but not the least, I would like to thank my wife : my parents and to my family for supporting me spiritually throughout writing this thesis and my life in general.
Ancestral reconstruction and investigations of genomics
recombination on chloroplasts genomes
Bashar Talib Hameed Al-Nuaimi
Université de Bourgogne Franche-Comté, 2017
Supervisor : Jean-François Couchot
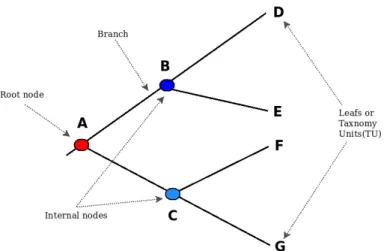
The evolution theory underpins on modern Biology. All new species emerge from an existing species. This results in different species are sharing a common ancestry, as represented in phylogenetic classification. The common ancestry can explain the similari-ties between all living organisms, such as general chemistry, cell structure, DNA as the genetic material and genetic code. The individuals of a species share the same genes but (ordinarily) different sequence of alleles of these genes. An individual inherits alleles from their ancestry or parents. The purpose of phylogenetic studies is to analyze the changes that occur in different organisms during the evolution by identifying the relation-ships between genomic sequences and determining the ancestral sequences and their descendants. A phylogeny study can also estimate time of divergence between groups of organisms that share a common ancestor. Phylogenetic trees are useful in fields of biology, such as bioinformatics, for a systematic and comparative phylogenetic. Evolutio-nary tree or phylogenetic tree is a branching exhibit the evolutioEvolutio-nary relationships among various biological organisms or other existence based upon differences and similarities in their genetic characteristics. Phylogenetic trees are built from molecular data like DNA sequences and protein sequences. In a phylogenetic tree, nodes represent genomic sequences and are called taxonomic units. Each branch connects any two adjacent nodes. Every similar sequence will be a neighbor on the outer branches, and a common internal branch will connect them to a common ancestor. Internal branches are called hypothetical taxonomic units. Thus the taxonomic units joined together in the tree are implied to have descended from a common ancestor. Our research performed in this dissertation focuses on improving appropriate evolutionary prototypes and robust algorithms for solving the phylogenetic and ancestral inference problems applying on gene order and DNA data under the whole-genome evolution, along with their applications.
Ancestral genome reconstruction can be described as a phylogenetic study of species of interest to extra details than what is provided by a standard phylogenetic tree. It may include information on ancestor species such as their gene content, the configuration of
these genes in the genome, the nucleotide sequence itself. Such information can help to understand the history of evolutionary a set of organisms better and through shed light on the genomic basis of phenotypes.
In this thesis, we are interested in both theoretical and practical problems in phylogenetic tree reconstruction and genome rearrangements. We propose a heuristic approach to ancestral genome reconstruction, and we implement one of the practical tools applicable to the analysis of real datasets spanning a complex phylogeny and accommodating a variety of genome architectures. We demonstrate the efficiency of our approach on the well-studied data set of chloroplast genomes and apply it to the reconstruction of rearrangement histories of complete, and really accurate reconstruction of some specific bacteria lineages such as Mycobacterium Genus. The reconstructing ancestral genomes problem of in a given phylogenetic tree stands in different comparative genomics domains. In this work, we focus on reconstructing ancestral genomes by the gene order, accessibility to reconstruction a whole genome DNA sequences. Ancestral genome reconstruction in this sense and for chloroplastic genomes and specific bacteria strains is the topic of this thesis.
KEY WORDS : Ancestral reconstruction, nucleotide sequence, taxonomic units, phylogenetic tree, Mycobacterium Genus, Chloroplastic genomes
Dedication 1 Acknowledgements 3 Abstract 5 Table of Contents 10 List of Figures 13 List of Tables 16 List of Abbreviations 17 I General introduction 19 1 General Presentation 21 1.1 Introduction . . . 21
1.2 Presentation of the Problems . . . 22
1.3 State of the art : a general overview . . . 23
1.4 Organization of the thesis manuscript . . . 24
1.5 Publications . . . 25
1.5.1 Publications in international conferences and journals . . . 25
1.5.2 Publications in national seminars and workshops . . . 26
II SCIENTIFIC BACKGROUND 27 2 Scientific Background 29 2.1 Chromosomes and genomes . . . 29
2.1.1 A short overview . . . 29
2.1.2 Genome and DNA mutations . . . 30
2.2 Sequence alignment . . . 32
2.2.1 BLAST . . . 33
2.2.2 Local Sequence Alignment : Smith–Waterman algorithm . . . 33
2.2.3 Global Sequence Alignment : the Needleman Wunsch example . . . 34
2.2.4 Multiple Sequence Alignment (MSA) . . . 35
2.3 About phylogenetic trees . . . 36
2.4 Phylogeny construction methods . . . 37
2.4.1 Neighbor-Joining Algorithm . . . 37
2.4.2 Maximum Parsimony . . . 38
2.4.3 Bayesian methods . . . 39
2.4.4 Maximum Likelihood . . . 39
2.4.5 Ancestral genome reconstruction . . . 39
III Contributions 41 3 Comparison of Metaheuristics to Measure Gene Effects on Phylogenetic Supports and Topologies 43 3.1 Introduction . . . 43
3.2 Presentation of the problem . . . 45
3.3 Phylogenetic predictions using metaheuristics . . . 47
3.3.1 Binary Particle Swarm Optimization . . . 47
3.3.1.1 BPSO applied to phylogeny . . . 47
3.3.1.2 Distributed BPSO with MPI . . . 49
3.3.1.3 Distributed BPSO Algorithm : Version I . . . 50
3.3.1.4 Distributed BPSO Algorithm : Version II . . . 50
3.4 Genetic algorithm . . . 50
3.4.1 Genotype and fitness value . . . 50
3.4.2 Genetic process . . . 51
3.4.3 Crossover step . . . 52
3.4.4 Mutation step . . . 52
3.4.5 Random step . . . 53
3.4.6 Genetic algorithm evaluation on a large group of plant species . . . 53
3.4.7 First experiments on Rosales order . . . 54
3.5 A simulated annealing approach . . . 57
3.5.2 Designing SA for phylogenetic studies . . . 58
3.6 Comparison of the metaheuristics . . . 61
3.6.1 Data generation . . . 61
3.6.1.1 Genomes recovery and annotations . . . 61
3.6.1.2 Extracting subsets of genomes for simulations . . . 62
3.6.1.3 A simple comparison in small dimensions . . . 62
3.6.2 Experimenting the heuristics on small collections of genomes . . . . 64
3.6.2.1 A first family of algae . . . 64
3.6.2.2 A second family with two problematic bootstraps . . . 66
3.6.3 Early analysis on SA computed problem : an illustration . . . 67
3.6.4 A further comparison of the distributed versions of GA and BPSO performance . . . 70
3.7 Conclusion . . . 73
4 Relation between Gene Content and Taxonomy in Chloroplasts 75 4.1 Materials and methods . . . 76
4.1.1 Data acquisition . . . 76
4.1.2 Core and pan genome . . . 76
4.2 Obtained results . . . 79
4.2.1 Gene content . . . 79
4.2.2 Relations between gene content and taxonomy . . . 80
4.3 Through a well supported tree of chloroplasts . . . 83
4.3.1 How we computed our phylogenetic tree, and why . . . 83
4.3.2 Phylogenetic investigations . . . 83
4.4 Conclusion . . . 84
5 Ancestral Reconstruction and Investigations of Genomic Recombination on Campanulides Chloroplasts 85 5.1 Introduction . . . 85
5.2 Presentation of the problem . . . 86
5.3 Ancestral analysis methods . . . 87
5.3.1 Method I : Naked eye investigation . . . 87
5.3.2 Method II : Ancestor Prediction based on Gene Contents . . . 88
5.4 Discussion . . . 90
5.4.1 The Apiales order . . . 90
5.4.3 The Fabids order . . . 94
5.4.4 Comparison with MLGO . . . 95
5.5 Conclusion . . . 99
6 On the Ability to Reconstruct Ancestral Genomes from Mycobacterium Ge-nus 101 6.1 Introduction . . . 101
6.2 A concrete semi-automatic ancestral reconstruction . . . 103
6.2.1 Multiple sequence alignment . . . 104
6.2.2 Phylogenetic study . . . 105
6.2.3 Ancestral reconstruction : mononucleotidic variants . . . 105
6.2.4 Ancestral reconstruction of larger variants . . . 106
6.3 Discussion . . . 118
6.4 Conclusion . . . 118
IV Conclusion 119 7 Conclusion and Perspectives 121 7.1 Conclusion . . . 121
7.2 Future work . . . 122
V Appendix 125
8 Appendix 127
2.1 DNA has a double-helix shape. Bases are found in pairs inside the double helix. The bases in DNA are named A, T, G, and C. Pyrimidine T ( resp. C) forms pairs with purine A (resp. G), and vice versa, https://www.slideshare.
net/AmyHollingsworth/lab5dnaextractionfromstrawberriesandliverfall2014. . 31
2.2 A mutation occurs when a DNA sequence is damaged or changed, which may for instance alter the genetic message carried by a gene. . . 31
2.3 Single Nucleotide Polymorphism (SNP). . . 32
2.4 Global alignments are applied for comparing homologous genes whereas local alignment can be used to locate homologous regions in otherwise non-homologous genes. . . 33
2.5 Multiple sequence alignment of various sequences of Apiales order. . . 36
2.6 Example of a phylogenetic tree structure. . . 37
3.1 Overview of the proposed pipeline. . . 46
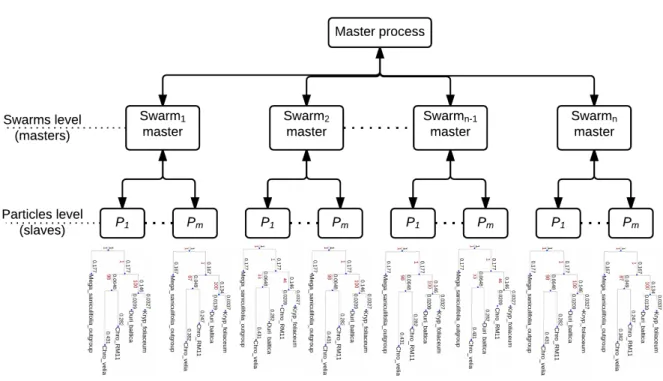
3.2 The distributed structure of BPSO algorithm. . . 49
3.3 Random pair selections from given population. . . 51
3.4 Outline of the genetic algorithm. . . 52
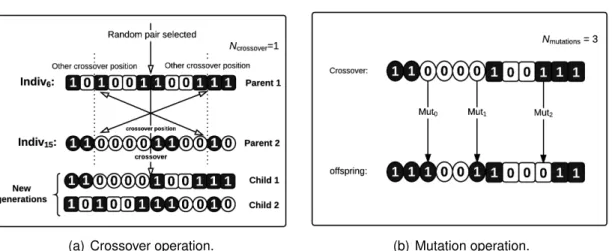
3.5 (a) Two individuals were selected from given population. The first portion from determined crossover position in the first individual is switched with the first portion of the second individual. The number of crossover positions is determined by Ncrossover. (b) Random mutations are applied depending on the value of Nmutation, changing randomly gene state from 1 to 0 or vice versa. 53 3.6 Average fitness of Rosales order . . . 55
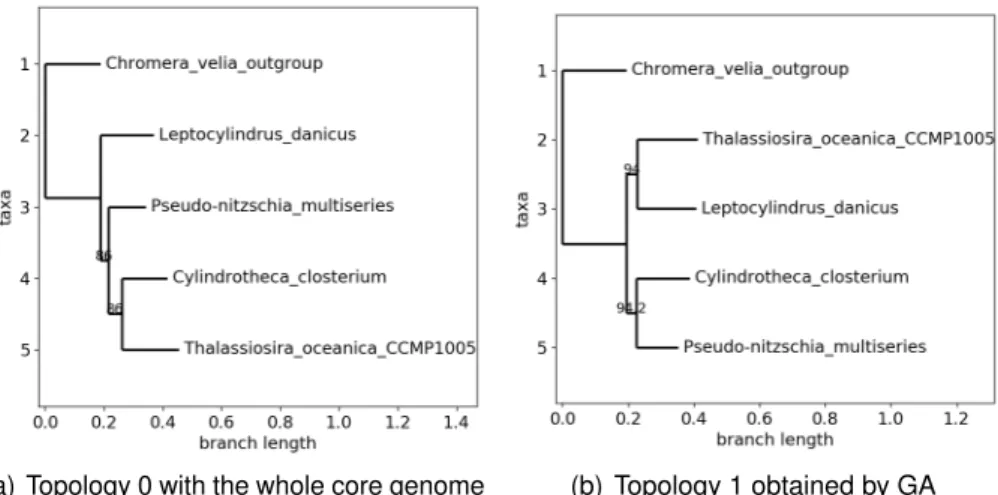
3.7 The best obtained topologies for Rosales order,Topology0 . . . 56
3.8 The best obtained topologies for Rosales order,Topology0 . . . 56
3.9 The best obtained topologies for Rosales order,Topology0 . . . 56
3.10 Simulated annealing as a threshold class algorithm. . . 58
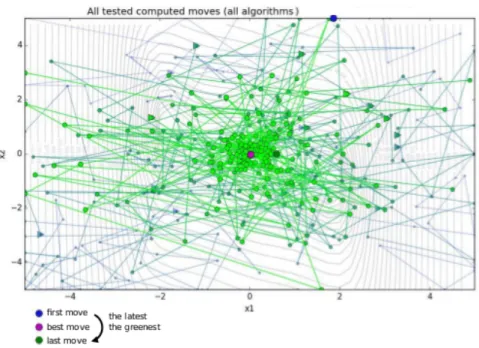
3.11 Successive positions given by the three metaheuristics : circles, points, and triangles are respectively for SA, GA, and PSO. . . 63
3.12 Illustration of output provided by simulated annealing approach : three-hump camel function, one instance of parallelled SA with final greedy local descent. 63 3.13 Phylogeny of family Number 1 with the whole core genome. . . 65
3.15 Obtained topologies with the second family. . . 68
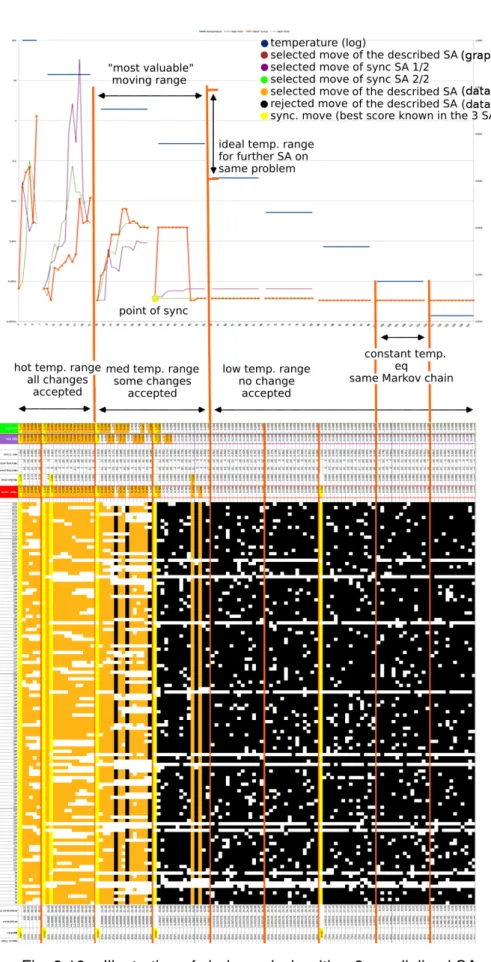
3.16 Illustration of clade analysis with a 3-parallelized SA. . . 69
3.17 Illustration of convergence on 3-parallelized SA. . . 71
3.18 BPSO with 10 and 15 particles vs. GA. . . 71
4.1 Taxonomy backbone tree . . . 78
4.2 The distributions of chloroplast genomes depending on the genomes size. . 79
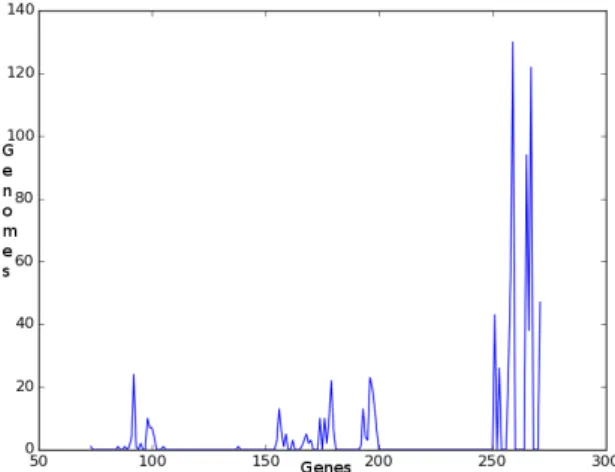
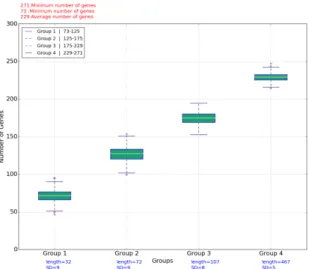
4.3 Classification of chloroplast genomes according to numbers of pan genes. . 81
4.4 ACCA gene loss in various branches of the tree . . . 82
5.1 Most supported phylogenetic tree obtained from Apiales order. . . 87
5.2 Simulation of ancestral reconstruction process between two genomes . . . 88
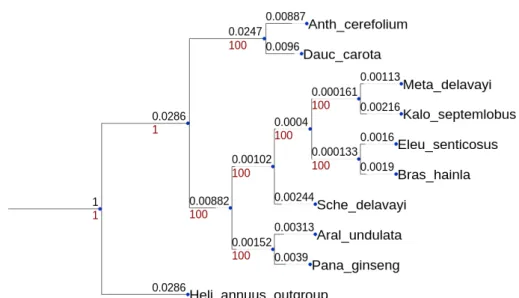
5.3 Apiales and Asterales species tree. The numbers shown at each branch are bootstrap values computed by RAxML [1]. A letter has also been associated to each internal node as defined in Step 1. . . 89
5.4 Simulation of gene investigation step between two genomes. . . 90
5.5 Graphical presentation of genes alignment between pairs of genomes (Bras_hainla, Kalo_septemlobus) and (Bras_hainla, Meta_delavayi) . . . . 92
5.6 Graphical presentation of genes alignment between genomes Kalo_sep-temlobus and Meta_delavayi . . . 93
5.7 (A) : Example of gene correspondances in sister genomes D. carota and A. cerefolium. For instance YCF68 is found in position 111 in A. cerefolium while it is missing from D. carota. Additionally, ORF56 is in 2 copies, posi-tions 114 and 115, in D. carota, while this gene is only represented once at position 115 in its sister. (B) Comparison between two sisters. The result is the ancestor genome (C). We can reasonably deduce that two copies of ORF56 have been deleted from genome A. cerefolium. The ancestor, for this part, contains too the gene YCF68, which has been deleted from the genome D. carota . . . 93
5.8 Insertion and deletion events found during ancestor reconstruction on Apiales order. Letters in red refer to ancestor genomes (their lengths are provided too). . . 94
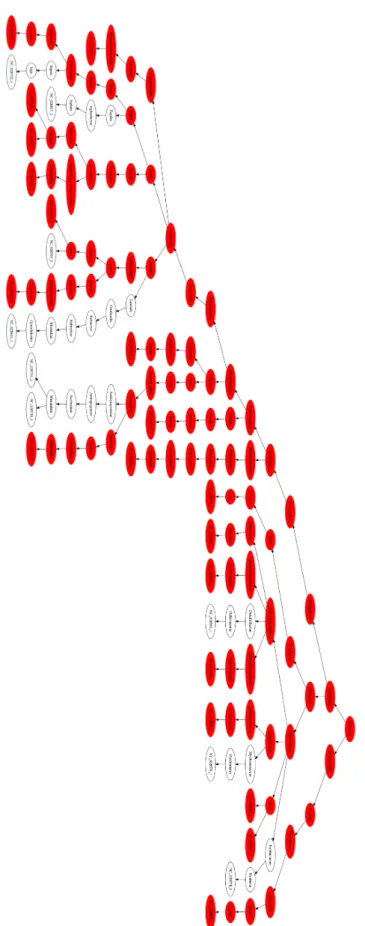
5.9 Summary of the complete ancestral genomes reconstruction of the Aste-rales order. Insertion and deletion events are provided, with names and length of each internal node. . . 95
5.10 A phylogenetic tree in the reconstruction of the Fabids ancestor and the unambiguous reconstruction accuracy of our algorithms on this tree. Al-phabetic characters represent the ancestors. L stands for the length of each node (number of genes), [D, I] describes the number of deletions and insertion, while inversions are indicated too. . . 96
5.11 Example of comparison with MLGO on Apiales order. We show similarity in gene contents between our results, ancestor node (C), and ancestor node
(A1) from MLGO. . . 98
5.12 Apiales order tree produced by MLGO. . . 98
6.1 Various genome rearrangement events. . . 103
6.2 Representation of a multiple sequence alignment. . . 103
6.3 A synteny representation of all available Mycobacterium strains . . . 108
6.4 Well-supported phylogenies on M. canettii species using a M. tuberculosis as outgroup . . . 108
6.5 Well-supported phylogenies of M. tuberculosis species with M. africanum as outgroup. Phylogenetic trees have been calculated on the entire genomes with RAxML and GTR Gamma model . . . 109
6.6 SNPs location of mononucleotidic variants of M. canettii. . . 110
6.7 SNPs location of mononucleotidic variants of M. turberculosis. . . 110
6.8 A representation of M. tuberculosis genomes species tends to show more than 95% nucleotide similarity with little recombination events. . . 111
6.9 Synteny blocks in M. canettii. Each genome is colored according to the position of the corresponding region in the first genome (gray if a region is unshared). . . 111
6.10 Dot plots provide an alternative representation of the synteny map of M. canettii. Black diagonal lines show syntenic regions sharing the same orien-tation, whereas red anti-diagonal ones represent blocks of synteny between opposite strands. The description of all of these species tends to show a high sequence similarity with little recombination events. . . 112
6.11 The insertions and deletions of nucleotides (indels) on the internal node of the tree (a) represent the nucleotides contain the ancestor nodes and their children on M. canettii species . . . 113
6.12 Example of an ancestral reconstruction of one problematic column in the alignment . . . 114
6.13 Ancestral reconstruction examples on M. canettii species . . . 115
6.14 Ancestral reconstruction examples on M. tuberculosis species . . . 116
2.1 Some examples of genome varieties . . . 30
2.2 BLAST programs. http://www.ncbi.nlm.nih.gov/BLAST/ . . . 34
3.1 Results of genetic algorithm approach on various families. . . 46
3.2 Genomes information of Rosales species under consideration . . . 48
3.3 Best tree in each swarm . . . 55
3.4 Best topologies obtained from the generated trees, b is the lowest bootstrap of the best tree having this topology, p is the number of considered genes to obtain this tree. . . 55
3.5 The CONSEL results regarding best trees . . . 57
3.6 Family number 1 (Pelargonium cotyledonis as outgroup). . . 64
3.7 Family number 2 (Chromera velia as outgroup). . . 66
3.8 Groups from BPSO version I. . . 72
3.9 Groups from PSO version II. . . 72
3.10 PSO vs GA. . . 72
4.1 Information on chloroplast sizes at highest taxonomic level . . . 75
4.2 Example of genomes information of Streptophyta clade . . . 76
4.3 Summarized properties of the pan genomes at the highest taxonomic level. 77 4.4 Taxonomy in the second level . . . 80
4.5 Example of comparison between pairwise genomes from various species, to investigate the changes that occurred within branches of the tree. . . 81
5.1 Genomes information of Apiales order. . . 86
5.2 Gene duplicate for each genome in Apiales order. . . 91
5.3 Gene duplicate for each genome in Asterales order. . . 97
5.4 The variation in comparison results of ancestral genomes nodes on Aste-rales order with MLGO. . . 97
5.5 The variation in ancestral genomes nodes which were achieved by compa-ring our method results with MLGO tool on Fabids order. . . 98
6.2 Number of alignment columns with polymorphism, by pair of strains, on M. canettii genomes. Note that, when a large string is deleted at some location in the tree, all the characters of this deletion are counted here. . . 107 6.3 Variations in the alignment of M. tuberculosis . . . 107 6.4 Number of SNPs in the considered species (100.X refers to an ancestral
AlignSeqs Align a Set of Unaligned Sequences. BLAST . . . Basic Local Alignment Search Tool. BPSO . . . . Binary Particle Swarm Optimization. BP . . . Bootstrap Probability.
DOGMA . . Dual Organellar GenoMe Annotator. DPSO . . . . distributed Particle Swarm Optimization. DNA . . . Deoxyribonucleic Acid.
EMBL . . . . European Molecular Biology Laboratory. GA . . . Genetic Algorithm.
Gap . . . Absence of a homologous character in either sequence could be a reason of deletion in the comparing sequence or an insertion in the sequence to which it is compared to. In either case a gap is added and a value of -1 is added to the score. Gap indicated an arbitrary number of null characters (represented by dashes). GSA . . . Global Sequence Alignment.
GTR . . . GTRGAMMA : GTR model of nucleotide substitution with theΓ model of rate
heterogeneity. All model parameters are estimated by RAxML.
Indel . . . An insertion/deletion polymorphism, commonly abbreviated “indel,” is a type of genetic variation in which a specific nucleotide sequence is present (insertion) or absent (deletion).
JModelTest jModelTest is a tool to carry out statistical selection of best-fit models of nucleotide substitution.
LSA . . . Local Sequence Alignment. LUCA . . . . Last Universal Common Ancestor.
MUSCLE . MUltiple Sequence Comparison by Log- Expectation. MSA . . . Multiple Sequence Alignment.
ML . . . Maximum Likelihood. MP . . . Maximum Parsimony.
MTBC . . . . Mycobacterium tuberculosis complex.
MLGO . . . . Maximum Likelihood for Gene-Order analysis. MLWD . . . . Maximum Likelihood on Whole-genome Data. NCBI . . . National Center of Biotechnology Information. NW . . . Needle-man Wunsch Alignment.
PHAST . . . Phylogenetic Analysis with Space/Time Models. PSA . . . Pairwise Sequence Alignment.
PSO . . . Particle Swarm Optimization.
RAxML . . . Randomized Axelerated Maximum Likelihood. RNA . . . Ribonucleic acid.
rRNA . . . ribosomal RNA.
SW . . . Smith-Waterman Alignment.
T-COFFEE multiple sequence alignment that provides a dramatic improvement in ac-curacy with a modest sacrifice in speed as compared to the most commonly used alternatives.
Topo . . . Topology. TU . . . Taxonomy Unit tRNA . . . Transfer RNA.
G
ENERAL
P
RESENTATION
1.1/
I
NTRODUCTIONWhy to reconstruct ancestral genomes ? From a fundamental point of view, studies of contemporary biological systems using, for example, approaches related to anatomy, biochemistry, physiology, and molecular biology are seriously limited by the absence of a mechanism of evolution description that would explain their establishment, organization, and functioning. The long-term aim of possessing ancestral genomes is thus to establish a broad framework for studying evolution despite the cruel lack of historical data. To achieve this goal, many algorithmic developments are necessary to efficiently and systematically process the large volumes of available data following a rigorous methodology.
Genomics studies are a typical case of very large volume data investigations : they are of very high resolution (until nucleotide level) and very reliable (many genome sequences contain less than one error every 10,000 bases), very abundant (100 sequenced euka-ryotic genomes for instance, and more than 1,000 prokaryotes), and centralized in public databases. Genomes also provide fundamental entry points to the functional properties of organisms, such as the presence or absence of genes, the expansion or regression of gene families, the topology of the cis-regulatory elements. In other words, it informs about the likelihood of certain metabolic or developmental pathways that may exist in an organism, and the importance of functions specific to each species. Genomes thus represent the foundation on which many advances can be achieved, and accessing such information in an ancestral genome provides a broad spectrum of these properties. From a more practical point of view, given the astronomical amount of genomic data supplied to the community, the pace of which is likely to accelerate further in the coming years, it is critical to maintain a substantial degree of organization for distribution and presentation of data. Ancestral genome reconstructions will allow the sequences and annotations of modern species to be linked naturally with those of ancestral species in the direction of Evolution, following the phylogeny of species. The ancestral genomes will serve as single reference points for comparing descending genomes, which will greatly facilitate the identification of ancestral genomics properties, and therefore specific lineage gains or losses. Conversely, the results that will continue to be obtained with different organization models will enrich them in return. To sum up, ancestral genomes are part of the foundations that will help us decipher the different molecular components contributing to the evolution of species, and that have led to such a variety of species and biological systems we can currently observe.
The aim of this thesis is to participate to the development of tools able to reconstruct the successive ancestors in several given lineages, thus providing a dynamic view of the evolution of genomes
1.2/
P
RESENTATION OF THEP
ROBLEMSRecently, many approaches have been developed to solve the ancestral reconstruction problem [2, 3, 4, 5, 6], but either they are limited to the evolution of one given character (for instance, a particular nucleotide), or conversely they theoretically focus on large-scale nuclear genomes (several billions of nucleotides) facing multiple recombination events. Large-scale genomic evolution problem can’t be tackled with same approaches than one-character methods : when considering the set of all possible recombinations on large genomes, the problem is indeed NP-hard. As far as we know, there is no directly applicable solution solving the evolution of large DNA sequences. Conversely, in this thesis, we focus on genomes that have a reasonable size and who faced a rational number of recombination like in the chloroplast case. Even if the problem becomes a priori tractable for such cases, it however requires the design of ad hoc solutions, and various difficulties remain to circumvent when dealing with such a specificity. For illustration purpose, the solutions will be applied on mid-scale genomes of chloroplasts first, and then of bacteria, growing so bit by bit the complexity of the problem we consider.
Let us recall the importance of understanding well the evolution of such mid-scale genomes. Chloroplasts are one of the main organelles in the plant cell. They are considered to have originated from cyanobacteria through endosymbiosis when an eukaryotic cell engulfed a photosynthesizing cyanobacterium, which further remained and became a permanent resident in the cell1. The term of chloroplast comes from the combination of chloro and plastid : it is an organelle (found in plant cells) that contain the chlorophyll. Chloroplast has indeed the ability to convert water, light energy, and carbon dioxide in chemical energy by using carbon-fixation cycle [7]. As this conversion releases oxygen, chloroplasts originated the breathable air and represent a mid to long-term carbon storage medium. Consequently, exploring the evolutionary history of chloroplasts is thus of great interest and we propose to investigate it by the mean of ancestral genomes reconstruction.
This reconstruction will be realized with the desire to explain how molecules have evolved over time, and to validate (or not) that this way can present evidence of their cyanobacteria origin. This long-term objective necessitates numerous intermediate advanced methods. For instance, it requires the ability to apply the ancestral reconstruction on a well-supported phylogenetic tree of a representative collection of chloroplastic genomes. Moreover, it necessitates the ability to detect content evolution (modification of genomes like gene loss and gain) along this accurate tree. These two prerequisites (gene content evolution, accurate phylogeny inference) have already been investigated in the literature, as reported briefly in the next section.
1.3/
S
TATE OF THE ART:
A GENERAL OVERVIEWThere exist two main computational methods to handle gene order and to propose an-cestral genome architectures : rearrangement-based and homology-based methods. The rearrangement-based methods typically search for the set of ancestral gene orders that mi-nimizes the sum of rearrangement distances over all branches of the given phylogeny [3, 4]. Homology-based methods are used to solve the small phylogeny problem that consists of the ancestral gene orders reconstruction of a species tree at the internal nodes from extant genomes. This process takes gene adjacency into account and handles them as binary characters with present and absence states. In this way, by observing the gene order as a set of adjacency genes, the aim is to discover which adjacency is contained in the ancestral genomes [2, 8]. These methods offer a better understanding of the genome evolution history and can further improve our knowledge of the mechanisms linking organic sequences to their functions. Despite this, ancestral genetic sequence reconstruction suffers from several limits such as those involved in the regulation of genes (insertion, deletion, duplication). Along with the examination of molecular evolution, it relies on the validity of models and their fundamental hypothesis [9].
Accordingly, a critical component of ancestral reconstruction of genomes is the unders-tanding of the phylogenetic tree relations between the species being examined [10]. It is crucial to identify the most suitable tree topology by using for instance bootstrap estima-tions in a maximum likelihood approach [11, 12]. Moreover, calculating the lengths of its branches is essential for a perfect reconstruction, as well as for evaluating the exactness of that reconstruction through simulations [13]. The lengths are related to the number of recombination and mutations that are likely to occur between an ancestor and its child nodes. This is why any error in the inferred phylogenetic relation will have obvious dramatic effects on the reconstructed ancestors.
So ancestral genome reconstruction (AGRC) can be described as an extension of phylo-genetic study of species of interest : it provides extra details than what is usually obtained by a classical phylogenetic tree [11]. It may include information about ancestor species such as their gene content, the organized of these genes in the genome, the nucleotide sequence itself, and so on [14]. Such information can help to understand better the evo-lutionary history of a set of organisms and through shed light on the genomic basis of phenotypes [15]. The observation of species is described by the peak or last nodes of the tree (leaves) that are gradually correlated by branches to their common ancestor [16], while nodes are represented by the branching points of the tree, which are usually designated to as inner nodes or the ancestors [17].
The ancestral reconstruction problem is as old as the field of molecular evolution. For instance, over past decades, many methods were proposed to reconstruct phylogenies from gene-order data. The prior algorithm has been established by Fitch [18] : Fitch’s parsimony algorithm first assumes a binary alphabet and is based on maximum parsimony (MP) patterns : it finds the labels to the internal nodes of a tree that reduce the number of changes or modification along tree edges. The most modern methods for phylogeny reconstruction from genome rearrangements include GRAPPA [3] and MGR [4]. However, these approaches are limited to cases where gene content are similar or when only a few deletions are expected [5]. Among the most recent methods which are based on gene adjacency, InferCARsPro is comparatively faster, but often produces an excessive number of chromosomes [2]. This problem is tackled by newer methods such as GapAdj [8], but it
is achieved by sacrificing a significant part of accuracy. Recently was proposed a faster and more accurate method called PMAG [5], which is a probabilistic framework method to infer ancestral gene order, and which involves gene insertions and deletions in addition to rearrangements. PMAG not only accurately infers ancestral genomes but also does an excellent job in assembling adjacencies into logical gene order [6]. All the aforementioned approaches, if we except PMAC, only deal with gene permutations, and they discard for instance the possibility of gene duplication or deletion. There is so an obvious lack of tools that concretely deal with ancestral reconstruction of mid-scale genomes, which consider all possible recombination – and we propose to fill this gap.
1.4/
O
RGANIZATION OF THE THESIS MANUSCRIPTThis current chapter is devoted to a general introduction of the thesis, providing the problematics and a brief description of both thesis subject and objectives. The introduction aims to place the work presented here in a more general context and provides essential data necessary for nonspecialists to understand the scope and development of the analysis presented here. The second part proposes a brief state-of-the-art about phylogenetic reconstruction, with existing methods that are related to this work.
Chapter 2 introduces some notions of biology that are essential for understanding the various problems addressed during this thesis. It gives a brief overview on how a phyloge-netic tree can be generated from a set of DNA sequences, and some concepts regarding phylogenetic analysis and algorithms used for phylogenetic reconstruction. The concepts of local and global alignments and the most common implementations are detailed in this chapter too. Multiple alignment algorithms are additionally given. It is moreover explained why small divergences in given sequences may lead to a hard alignment problem. To analyze aligned sequences, we describe various phylogenetic concepts and terminologies. Methods for constructing phylogenetic trees are finally summarized (such as distance and character based methods), together with bootstrap analysis.
Chapter 3 illustrates essential resources jointly introduced in an artificial intelligence algorithm for phylogenetic tree reconstruction. In this chapter, we study first the relevance of the Simulated Annealing (SA) algorithm to fulfill the optimization task. Then, various metaheuristics have been executed in a distributed manner using supercomputing facilities. Our proposal is based on genetic algorithm and a particle swarm optimization approach that are developed in both linear and parallel fashions, in order to reconstruct a well supported phylogenetic tree while removing genes that blur the phylogenetic signal. An improved simulated annealing method is finally added, and a comparison of 3 given metaheuristics on a large number of new groups of species is proposed.
Chapter 4 discusses other methods that are used in our ad-hoc algorithm to generate ancestral genomes. Investigations of genomic recombination on campanulides chloro-plasts are further detailed, depending on all provided information obtained with previously presented tools in Chapter 3. Then, in Chapter 5, we describe the relations that can be found between the phylogeny of a large set of 845 complete chloroplast genomes, and the evolution of gene content inside these sequences. Core and pan genomes have been computed on de novo annotations of these genomes, the former being used for producing well-supported phylogenetic trees while the latter provides information regarding the evolution of gene contents over time, and illustrates the specificity of some branches
of the trees.
In Chapter 6, we propose to reconstruct all ancestors of all complete available genomes of Mycobacterium tuberculosis and M. canettii. Doing so allows us to consider complete genomes that are more complex than the chloroplasts. The study starts by investigating the single nucleotide polymorphism level, while insertions-deletions (indels) and large scale recombinations are regarded in a second stage. By mixing automatic reconstruction of obvious situations with human interventions on signaled problematic cases, we prove that it is possible to achieve a concrete, complete, and really accurate reconstruction of lineages of the Mycobacterium tuberculosis complex.
Finally, the conclusion of the manuscript provides a summary of researches that have been realized during this thesis. A discussion about possible future work in this area is proposed too, to open the debate and introduce putative further investigations.
1.5/
P
UBLICATIONSAll the objectives of this thesis have been investigated, even though a lot of work still remain to be realized. These investigations have been validated by the following publications.
1.5.1/ PUBLICATIONS IN INTERNATIONAL CONFERENCES AND JOURNALS
1. CIBB 2015 Bassam Alkindy, Bashar Al-Nuaimi, Christophe Guyeux, Jean-François Couchot, Michel Salomon, Reem Alsrraj, and Laurent Philippe. "Binary Particle Swarm Optimization Versus Hybrid Genetic Algorithm for Inferring Well Supported Phylogenetic Trees". In Computational Intelligence Methods for Bioinformatics and Biostatistics : 12th International Meeting, CIBB 2015, Naples, Italy, September 10-12, 2015, pp. 165-179, Springer International Publishing, 2015.
2. IJBBB 2017 Al-Nuaimi Bashar, Christophe Guyeux, Bassam AlKindy, Jean-François Couchot, and Michel Salomon. "Relation between Gene Content and Taxonomy in Chloroplasts". in International Journal of Bioscience, Biochemistry and Bioinformatics (IJBBB) 2017 Vol.7(1) : 41-50 ISSN : 2010-3638.
3. IWBBIO 2017 Christophe Guyeux, Bashar Al-Nuaimi, Bassam Alkindy, Jean-François Couchot and Michel Salomon. "On the Ability to Reconstruct Ancestral Genomes from Mycobacterium Genus”. In International Conference on Bioinforma-tics and Biomedical Engineering (IWBBIO 2017) pp. 642-658. Springer International Publishing, Granada, Spain, April 26-28,2017.
4. JIB 2017 Bashar Al-Nuaimi, Roxane Mallouhi, Bassam AlKindy, Christophe Guyeux, Michel Salomon, and Jean-François Couchot. "Ancestral reconstruction and in-vestigations of genomic recombination on Campanulids chloroplasts". Integrative Bioinformatics (JIB). Date of submission : 7th of November, 2016.
5. BMC 2017 Régis Garnier, Christophe Guyeux, Jean-François Couchot, Michel Sa-lomon, Bashar Al-Nuaimi and Bassam AlKindy. "Comparison of Metaheuristics to Measure Gene Effects on Phylogenetic Supports and Topologies". Submitted to Special Issue on BMC Bioinformatics Supplement. Date of submission : 23th of May, 2017.
6. BMC 2017 Christophe Guyeux, Bashar Al-Nuaimi, Bassam Alkindy, Jean-François Couchot and Michel Salomon. "Investigating the ancestral reconstruction of bacterial genomes”. Submitted to Special Issue on BMC Bioinformatics Supplement. Date of submission : 22th of July, 2017.
1.5.2/ PUBLICATIONS IN NATIONAL SEMINARS AND WORKSHOPS
1. SeqBio’2015 Bashar Al-Nuaimi, Roxane Mallouhi, Bassam AlKindy, Christophe Guyeux, Michel Salomon, and Jean-François Couchot. "Ancestral reconstruction and investigations of genomic recombination on Campanulides chloroplasts". Workshop of SeqBio 2015, Orsay, November 2015.
2. Femto-st’2015 Bassam Alkindy, Bashar Al-Nuaimi, Huda Al’Nayyef, Panisa Tree-pong, Christophe Guyeux, Jean-François Couchot, Michel Salomon, and Jacques Bahi. "Bioinformatics Approaches on Genomic Evolution in Femto-ST (Core Genome, Phylogenetic Analysis, Transposable Elements, and Ancestral Reconstruction)". Workshop of Femto-ST, June 2015, Besancon, France. Note : Poster.
3. Femto-st’2016 Bashar Al-Nuaimi, Bassam Alkindy, Christophe Guyeux, Jean-François Couchot, and Michel Salomon. "Ancestral reconstruction and investigations of genomic recombination on Campanulids chloroplasts and Mycobacterium Genus". Workshop of Femto-ST, August 2016, Besancon, France.
S
CIENTIFIC
B
ACKGROUND
I
n this chapter, we introduce some notions of biology which are sufficient for the unders-tanding of problems addressed in this thesis. Indeed, the challenges of reconstructing chromosomal rearrangements and ancestral genomes requires to know the structure of genomes. Obviously, phylogenetic tree reconstruction is a first step in the understanding of the ancestral relationship among a set of biological sequences. It includes the construction of a tree, where the nodes indicate separate evolutionary paths, and the branch lengths give an approximation of how distant the sequences represented by those branches are. Additionally, in this chapter, we will present various sequence alignment algorithms, which are a fundamental step in molecular phylogenetics to explain the evolution of speciation, quantification of substitution patterns and gene duplication events, but also a useful tool for identifying mutations leading to genetic diseases. This chapter covers the pairwise global and local alignments by dynamic programming with various scoring schemes, multiple sequence alignments that are reduced to pair-wise alignment, and profile alignment by using a guide tree. This chapter presents also a brief information on how a phylogenetic tree can be constructed from a set of DNA sequences, and how to evaluate the generated tree. Finally, some concepts concerning phylogenetic analysis and algorithms used for phylogenetic reconstruction will be reported. Note that the state-of-the-art part related to multiple sequence alignment and their use for phylogenetic analysis has been studied in common with my colleague Panisa Treepong, and written "four hands" as our investigations in this field have been performed together, in team.2.1/
C
HROMOSOMES AND GENOMES2.1.1/ A SHORT OVERVIEW
Genomes contain the complete genetic material of an individual or a species, encoded in its DNA, except certain viruses whose genome is carried by RNA molecules. From one organism to another, the genome organization may differ. It can be composed of one or more DNA molecules, which will have a significant impact on the complexity of the problem of reconstructing chromosomal rearrangements and ancestral genomes. In prokaryotes (bacteria and archaea), the genome is located in the cytoplasm of the cells, which is usually contained in a circular DNA molecule. However, there are many exceptions : some species may have several circular chromosomes, or a single linear chromosome, or a linear chromosome and a circular one [19]. There may also be an extra-chromosomal component contained in plasmids and episomes.
In eukaryotes, we can distinguish the following :
1. Nuclear DNA composed of several linear chromosomes, contained in the nucleus of the cells (an element which indeed characterizes eukaryotic cells).
2. Non-nuclear DNA, contained in organelles, i.e., the chloroplastic chromosome contai-ned in the chloroplasts of photosynthetic organisms (algae and plants), or the mitochondrial chromosome contained in mitochondria of all the other eukaryotes. In eukaryotes, linear chromosomes are characterized by a centromere and two telomeres in most organisms. The centromere shares the chromosome in two arms (left and right) and is essential for the smooth unfolding of the cell divisions. The telomeres are the two ends of a chromosome [20]. The number of chromosomes contained in the cell of an organism varies according to the considered species1. The size of the genome is mainly
measured according to its number of nucleotides, or bases (in bp for base pair, since the majority of the genomes is made up of double strands of DNA). Multiples are also used, like kb for kilobase or Mb (megabase), which are respectively equal to 1,000 and 1,000,000 bases. Note that the size of a genome may vary from a few kb in viruses to several hundreds of thousands of Mb in some eukaryotes, as shown in Table 2.1.
The quantity of DNA is not proportional to the complexity of an organism. Some ferns, for example, have genomes more than ten times larger than the human one [21, 7, 22].
TABLE2.1 – Some examples of genome varieties
Species Kingdom Genomes size Number of genes
Mycobacterium tuberculosis Bacteria 4.41Mb 4,008
Brucella abortus(chromosome 2)
Brucella abortus(chromosome 1) Bacteria
2,12 Mb 1,16 Mb
2200 1156
Actinidia chinensis Plantae 616.1 Mb 39,040
Takifugu rubripes Animalia 390 Mb 22–29,000
Plasmodium falciparum Alveolata 22.9 Mb 5,268
Drosophila melanogaster Animalia 122.6 Mb 17,000
Homo sapiens Animalia 3.2 Gb 18,826
2.1.2/ GENOME AND DNAMUTATIONS
The cell is the ‘building block’ of life. It mainly performs functions for maintaining daily life and passing the genetic instructions to the next generation. The former function is particu-larly facilitated by proteins whereas the latter is mainly achieved through Deoxyribonucleic acids (DNA).
DNA is a polymer, where its monomer units are nucleotides. Each nucleotide in a DNA has three parts : a pentose sugar (desoxyribose), a phosphate, and one “base”. Indeed, nucleotides can be classified into four types corresponding to their distinct bases : Adenine (A), Cytosine (C), Guanine (G), and Thymine (T). A and G are called purines, having a two-ring structure, while C and T are called pyrimidines and they conversely have a
1. For example, man has 23 pairs of linear chromosomes whereas Escherichia coli, an intestinal bacterium, has only one circular chromosome.
one-ring structure (see Figure 2.1). For the sake of concision, DNA is simply represented as a sequence over the alphabet (A, C, G, T).
During organism evolution, its DNA is replicated and passed on to its offspring. And through DNA replication, changes can occur in the sequence, which is referred as mutation. These variations in the DNA sequences occur at the base level, as depicted in Figure 2.2. These modifications change the characteristics of the generations and eventually, may lead to the production of new species. This evolutionary manner of DNA mutations can be represented, in a certain way, by a phylogenetic tree, introduced later in this chapter.
DNA Double Helix
Fig. 2.1 – DNA has a double-helix shape. Bases are found in pairs inside the double helix. The bases in DNA are named A, T, G, and C. Pyrimidine T ( resp. C) forms pairs with purine A (resp. G), and vice versa, https://www.slideshare.net/AmyHollingsworth/ lab5dnaextractionfromstrawberriesandliverfall2014.
Fig. 2.2 – A mutation occurs when a DNA sequence is damaged or changed, which may for instance alter the genetic message carried by a gene.
These genomic mutations are now easily accessible via modern sequencing technologies, making it possible to discover single nucleotide polymorphisms2, short insertions and deletions (INDELs) as well as other genomic mutations like duplication and inversions.
2.1.3/ MODEL OF NUCLEOTIDE SUBSTITUTION
As previously stated, over time, nucleotide sequences can “evolve” through substitution. This process can cause a nucleotide (A, C, T or G) to change into another nucleotide, and this is one of the most central driving force behind evolution. This modification in a DNA sequence may lead to an inactivation of a gene or to a mutation in the protein that
2. Let us recall that a single nucleotide polymorphism, usually abbreviated to SNP, is a mutation in a single nucleotide (A, T, C, or G) that occurs at a particular position in the genome, as shown in Figure 2.3. Each mutation is present to some appreciable degree within a population. Each organism has several single nucleotide polymorphisms that together create a unique DNA pattern for that.
Fig. 2.3 – Single Nucleotide Polymorphism (SNP).
the sequence codes. As proteins are the building blocks of organic life, this may cause significant variations in an organism’s characteristics. Alternatively, this modification may have no effect at all, being silent.
Commonly, this type of mutation can take place once or twice each million years on a given sequence location. Estimating the evolution of organisms over hundreds of millions of years, models of nucleotide evolution are helpful in speculating how one sequence of nucleotides may have evolved from another. These models can be inferred by either assuming that two given sequences had shared a common DNA ancestor or by assuming that one sequence evolved into the other.
At the simplest level, the proportion can be used for defining such a matrix P of nucleotide substitution :
Pd =
nd
n (2.1)
where n indicates the total number of nucleotides in the sequence, and ndis the number
of base d, d = {A, C, G, T}. Other richer probabilistic models have been proposed in the literature, to provide a more accurate estimation of the mutation matrix P, like Jukes and Cantor [23], Kimura [24], and Tamura and Nei [25].
2.2/
S
EQUENCE ALIGNMENTOne of the principal problems in computational molecular biology is sequence alignment. A sequence alignment is a process of aligning blocks of provided sequences (of DNA, RNA, or protein) to recognize similar regions – that may be a consequence of functional or evolutionary relationships between the sequences. Aligned sequences of amino acids or nucleotides are reproduced as rows within a matrix. Gaps are inserted between the deposits so that residues with identical or similar sequences are arranged in successive columns.
Let us for instance consider two sequences which are homogeneous except that the first sequence contains one other residue (e.g., a given nucleotide). When we view the alignment of these two sequences, the other residue will be matched to a gap. This corresponds to an insertion event in the first sequence or a deletion event in the second. On the other hand, if we note that an insertion event has occurred in the first sequence (concerning the second) then we know how to match that residue to a gap in the second.
Thus one way to build a sequence alignment is to find a series of insertions, deletions, or replacements collectively called mutation events, which will transform one sequence into the other. The number of mutation events needed to transform one sequence into the other is called the edit distance.
Indeed, in sequence alignment, there are two broad categories, namely the local and the global one. A local alignment returns the best matching subsequence, while in a global alignment, we obtain the best match of both sequences in their totality. Local sequence alignments intend to reveal similar regions in a given pair of sequences. In other words, they find an optimal local alignment by searching for two segments with maximum similarity score by discarding weak initial and terminal fragments, see. Figure 2.4 for an illustrative example.
Many algorithms have been developed for these two kinds of alignments, some of the most popular ones being summarized in the next subsections.
Fig. 2.4 – Global alignments are applied for comparing homologous genes whereas local alignment can be used to locate homologous regions in otherwise non-homologous genes.
2.2.1/ BLAST
Basic Local Alignment Search Tool (BLAST) is a database sequence search engine pro-posed by the National Center for Biotechnology Information (NCBI). The first version of BLAST was published in 1990 and it supported only ungapped searches. The second version, releazed in 1997 [26], has been designed to determine high-scoring local ali-gnments between sequences, without discrediting the speed of such searches. BLAST addresses thus an essential problem in bioinformatics research. It uses a heuristic process that attempts local as crossed to global alignments and, therefore, it is suitable to identify relationships between sequences (amino-acid sequences of proteins or the nucleotides of DNA sequences) which share only isolated regions of similarity [27].
Table 2.2 displays the different BLAST programs available on the NCBI web server.
2.2.2/ LOCAL SEQUENCE ALIGNMENT : SMITH–WATERMAN ALGORITHM
The Smith-Waterman algorithm was developed by Temple F. Smith and Michael S. Wa-terman in 1981 [28]. Using a dynamic programming approach, it is able to provide the optimal local alignment between two strings. The algorithm estimates the alignment that
TABLE2.2 – BLAST programs. http://www.ncbi.nlm.nih.gov/BLAST/
Program Comparison Application
BLASTN
DNA vs. DNA. Compares a nucleotide query sequence against a nucleotide sequence database.
Find DNA sequences that match the query
BLASTP
Protein vs. Protein. Compares an amino acid query sequence against a protein sequence database.
Find identical (homologous) proteins
BLASTX
DNA vs. Protein. Compares a nucleotide query sequence translated in all reading frames against a protein sequence database.
Find protein databases using a translated nucleotide query
TBLASTN
Protein vs. DNA. Compares a protein query sequence against a nucleotide sequence database dynamically translated inall reading frames.
Find genes in unknown DNA sequences
TBLASTX
DNA vs. DNA. Compares the six-frame translations of a nucleotide query sequence against the six-frame translations of a nucleotide sequence database.
Find degree of homology
between the coding region of the query sequence and known genes in the database.
minimizes the costs provided by a certain distance function. It is used to produce conser-ved regions between the two sequences, and one can align two partially overlapping sequences. Also, it is able to align the subsequence of the sequence to itself. This powerful dynamic programming approach was designed to discover the highly preserved fragments by discarding poorly conserved initial and terminal segments.
In this algorithm, a two-dimensional scoring matrix D of size (m+ 1) × (n + 1) is formed from the two provided nucleotide, RNA, or protein sequences A and B of lengths n and mrespectively. One extra column and one row containing zeros are added to the matrix, for score computation. The score in each cell is computed based on the scoring function presented in Equation 2.2, D(i, j)= max D(i − 1, j − 1)+ S (Ai, Bj),
D(i, j − 1) − gap penalty, D(i − 1, j) − gap penalty, 0.
(2.2)
where D(i, j) is the value at line i and column j of the scoring matrix of Aiand Bj. The value
S(Ai, Bj) is provided by a standard substitution matrix, like those detailed in Section 2.1.3.
To sum up, the main algorithm steps are thus (the second step will consume the most significant part of the total calculation time) :
1. Initialize the matrix.
2. Being at position i in the first sequence A and at position j in the second one B, calculates the mutation score, and fill the matrix with the appropriate optimal value in D(i, j).
3. Once the matrix is filled, trace back the optimal path within this matrix, to find the proper alignment.
Smith-Waterman is a tad more useful for tasks such as locating the difference between DNA sequences, because usually, a researcher is more interested in the change in the sequence of the gene, allowing them to determine the variation over time. For more details on the Smith-Waterman algorithm, see [28], or [29] for an improved version.
2.2.3/ GLOBALSEQUENCE ALIGNMENT : THE NEEDLEMAN WUNSCH EXAMPLE
In global alignments, the alignment is carried out from the beginning until the end of the sequence to find out the best potential solution, which is more appropriate with
closely related sequences that have approximately the same length. S.A.Needleman and C.D.Wunsch [30] have developed the first method of this category, naturally called the Needleman-Wunsch algorithm. The objective of this latter is to maximize the number of matches between the sequences along the entire length of the sequences. The original Needleman-Wunsch algorithm computes the minimal edit distance of two sequences under a very general scoring scheme, taking O(n3) time and O(n2) space.
This algorithm is constituted by the following steps, similar to the Smith-Waterman ones :
— Initialization : A two-dimensional matrix D must be firstly initialized. The row vector
represents the first sequence A, while the column one corresponds to the second sequence B.
— Matrix scoring : We fill the matrix D in the same manner than in Smith-Waterman.
D(i, j) is computed recursively according to a dynamic programming approach. If S(i, j) is the substitution score for residues Ai and Bj and g is the gap penalty, then
we have : D(i, j)= max
D(i − 1, j − 1)+ S (Ai, Bj) match Ai with Bj
D(i − 1, j) − g(insertion in A) D(i, j − 1) − g(insertion in B)
(2.3)
— Traceback and alignment : Tracing back process starts from the lowest right
position in the scoring matrix. We then follow the maximum scores until reaching the upper left position. The path drawn in this matrix is considered to correspond to the most optimal global alignment for the two given sequences.
The main differences between Needleman-Wunsch and Smith-Waterman algorithms are : — The zero condition : in Smith-Waterman, we insert a 0 in the cell i, j if Di, j is negative,
which is not the case in the Needleman-Wunsch case.
— Sequences in scoring matrix are ordered in an opposite direction.
2.2.4/ MULTIPLE SEQUENCE ALIGNMENT (MSA)
Multiple sequence alignment is an expansion of pairwise alignment to combine more than two sequences at a time. They are implemented to identify conserved regions among a set of sequences, evaluating by doing so if they are evolutionarily related. Alignments are also used to help in building evolutionary relationships on phylogenetic trees construction, as described in the next section.
The goal of MSA is to align all of the sequences in a given set if possible. A MSA is thus a collection of three or more nucleotide or amino acid sequences that are aligned partially or entirely. Identical residues are aligned in columns across the length of the sequences. These aligned residues are homologous in a fundamental sense or even in an evolutionary sense : they are probably derived from a common ancestor.
Figure 2.5 is an example of the result of MSA applied on Apiales order. However, as soon as the sequences exhibit some divergence, the problem of multiple alignments becomes extraordinarily difficult to solve. And if exact approaches produce optimal alignments, they are not feasible in time or space for more than a few sequences. Let us finally notice that
the alignment accuracy can be hard to estimate and their actual biological significance can be ambiguous.
In practice, a very popular progressive sequence alignment tool is the Clustal family [31], in particular the weighted variant ClustalW that is incorporated in many web tools like GenomeNet3 or EBI4. Another important progressive alignment approach is called
T-Coffee [32], which operates as a post processing on various MSAs of the same set of sequences that are provided by other existing methods like Clustal. Due to its principle of conception, T-Coffee is slower than Clustal and its derivatives but, in general, it yields more accurate alignments for distantly related sequence sets.
Fig. 2.5 – Multiple sequence alignment of various sequences of Apiales order.
2.3/
A
BOUT PHYLOGENETIC TREESAn evolutionary or phylogenetic tree is an acyclic graph (or branching diagram, see Figure 2.6) that is used to emphasize evolutionary relationships among groups of biological species, that is, their phylogeny based upon similarities and variations in their genetic or physical characteristics. The nodes are connected in the tree by branches. The latter highlight the relationship between taxonomic units (TU) at the leaves of the tree and their ancestors, corresponding to the internal nodes of the graph. Each branch has a length that represents, for example, the number of expected mutations per site (in amino-acids or nucleotide sequences) that have probably happened in these branches, in a sequence based phylogeny. Thus, branch lengths provide the time of variation between two organisms and their common ancestor. There are basically two kinds of phylogenetic trees :
— The unrooted Phylogenetic Trees : evaluate the relationships between all the
given TUs. However, they usually do not provide sufficient information to deduce the evolution from the last common ancestors.
— The rooted Phylogenetic Trees : embed a root node that represents the last
common ancestor of all TUs in the tree. The main way to root a tree is to specify an outgroup, which is a TU known to be outside the group of TUs under consideration. This latter can be a species known to have diverged before the divergence of the considered TUs.
It can be noticed that the time of evolution of a rooted species represented by a rooted phylogenetic tree can be computed from each sub-ancestor to the last common one when either the date of divergence or the divergence rate are known. Until now, however, this question is still an intensive subject of research.
3. http://align.genome.jp/ 4. http://www.ebi.ac.uk/clustalw
Fig. 2.6 – Example of a phylogenetic tree structure.
2.4/
P
HYLOGENY CONSTRUCTION METHODSThe most known and commonly used methods of tree construction can be classified into two central divisions : distance-based and character-based methods.
Distance-based methods begin by transforming the original data into a matrix of pairwise distance values. The next stage is to infer a tree either by sequential joining approaches, or by estimating a set of candidate trees and applying a type of optimality criterion technique to select the best one. Under the minimum evolution criterion, the tree that has a minimum sum of branch lengths is selected as the best estimate. Distance-based algorithms encompass UPGMA and Neighbor-Joining, this latter being explained in the next subsection.
Character-based methods can depend on a divergence of phylogenetic characters such as genetic and molecular attributes to construct phylogenetic trees. As long as that there is divergence among taxa in the characteristic and that the characteristic is heritable, it could probably be accepted as a phylogenetic character. In this context, molecular phylogenetics, attempt to estimate the modification rates and patterns occurring in the sequences (protein, DNA, or RNA) and to reconstruct the evolutionary history of organisms using such characters.
Algorithms used to create phylogenetic trees using characters are more complicated than distance-based methods [33]. The algorithms are based on an optimization criterion such as Maximum Likelihood, Maximum Parsimony, or Bayesian methods in order to find the best tree according to the considered characters. For the sake of illustrations, we will detail such methods at the end of this chapter.
2.4.1/ NEIGHBOR-JOINING ALGORITHM
As previously said, the neighbor-joining algorithm constructs unrooted phylogenetic trees using distance methods. Both topology and branch lengths are computed by iteratively specifying (based on a distance matrix) a neighbor as a pair of TUs that are joined in a single internal node X in an unrooted tree, depending on the previously computed distance
matrix. An iteration of the neighbor-joining algorithm consists of the following steps : 1. Construct an unresolved tree with all TUs in a starlike structure with no hierarchy. 2. Construct a distance matrix by pairwise comparison and calculate the value of branch
lengths, to identify the two most related sequences (TUs) : NJ seeks to build a tree which minimizes the sum of all branch lengths.
3. Determine which TUs are connected to an internal node X. They are treated now as one TU.
4. Join the closest neighbors (TUs with similar characters), the base pair that has the smallest sum-of-branch-lengths.
5. The algorithm is repeated until the topology of the tree is obtained.
The neighbor-joining method produces an unrooted tree. The sum of the branch lengths of N TUs in the tree is calculated as follows. Let us define Di j and LAB as the distance
between TUs i and j and the branch length between nodes a and b respectively. The sum of branch lengths of the tree is defined based on the following formula :
S = N X i=1 LiX = 1 N −1 X i< j Di j/
The distance between nodes X and Y is calculated as follows : LXY = 1 2(N − 2) N X k=3 (D1k+ D2k) − (N − 2)(L1X+ L2X) − 2 N X i=3 LiY
The term inside the brackets is the sum of all distances including LXY, and the outer term 1
2(N−2) is to eliminate unrelated branch lengths.
Neighbor-joining [34] is a method which is especially suited for datasets comprising lineages with broadly varying rates of evolution. It can be used in combination with techniques that allow correction for superimposed substitutions.
2.4.2/ MAXIMUMPARSIMONY
The Maximum parsimony method [35] aims at minimizing branch lengths by reducing the number of mutations. This approach predicts the evolutionary tree that minimizes the number of actions needed to generate the marked variation in the sequences from common ancestral sequences. In a maximum parsimony phylogenetic study, the best tree is specified as the tree with the lowest branch lengths. More precisely, for given sequences, a MSA algorithm is used to align the sequences, and to identify the informative positions, that is, columns in the multiple sequence alignment with no gap and at least two characters.
The next step is to count the number of changes and assign this cost to each generated phylogenetic tree. The method then computes the total length L for each tree, which is calculated according to the following formula :
L=
C
X
j=1
where lj is the cost for character j, C is the total number of characters, and wi is the
assigned weight for each character, which is set to 1 in most cases. The tree that maximizes this L value is finally selected.
2.4.3/ BAYESIAN METHODS
For the sake of completeness, we evoke here the well-known and frequently used Bayesian methods [36], which estimate the phylogeny by calculating the conditional probability given the model, based on the following formula :
Pr[Tree|Data]= Pr[Data|Tree] × Pr[Tree] Pr[Data]
where Pr[Tree|Data] is called a posterior probability distribution5.
Bayesian methods can thus apply a model of sequence evolution and are ideal for building a phylogeny using sequence data.
2.4.4/ MAXIMUM LIKELIHOOD
The Maximum Likelihood (ML) criteria requires a probabilistic model for the evolutionary process and finds the most likely tree, given the probabilistic model and the known sequences at the leaves. In other words, ML techniques are used to determine the topology and branch lengths that have the largest likelihood to produce the aligned data, providing the substitution model and the tree. The likelihood value is computed after the alignment stage and by considering some DNA or amino acids substitution models. In ML method, the searching space is fulfill using a quartet program. This latter finds all possible sequence combinations for tree reconstruction, while the Maximum Parsimony criteria prefers solutions that minimize the number of mutations along the tree edges [37]. Bayesian methods and Maximum likelihood can apply a model of sequence evolution and are ideal to construct a phylogeny using data sequences. The main drawback of these methods is that they are computationally expensive. However, with today’s computers, this is not too much a problem.
One of the most common tests used to evaluate the reliability of a deduced tree is the so-called Felsenstein’s bootstrap test [38], which is usually estimated using Efron’s bootstrap resampling technique [39]. It is accomplished in practice by sampling the input data [40] and measuring the proportion of deduced trees that support each branch of the best tree previously obtained. As a global rule, if the bootstrap value for a given internal branch is 95% or higher, the topology will be considered "valid" at that branch6.
2.4.5/ ANCESTRAL GENOME RECONSTRUCTION
Ancestral reconstruction may focus at sequence level or at gene order level, the former being quite resolved [41, 8, 42, 43, 6, 13, 10, 44, 45], at least if we do not consider
5. A posterior probability is the probability that the tree is considered to be correct, if it has the maximum probability.
6. In Bayesian approaches, this is the posterior probability itself that gives an evaluation of robustness : the support of a branch increases with its probability.