HAL Id: hal-01760249
https://hal-insep.archives-ouvertes.fr/hal-01760249
Submitted on 6 Apr 2018
HAL is a multi-disciplinary open access
archive for the deposit and dissemination of
sci-entific research documents, whether they are
pub-lished or not. The documents may come from
teaching and research institutions in France or
abroad, or from public or private research centers.
L’archive ouverte pluridisciplinaire HAL, est
destinée au dépôt et à la diffusion de documents
scientifiques de niveau recherche, publiés ou non,
émanant des établissements d’enseignement et de
recherche français ou étrangers, des laboratoires
publics ou privés.
Cadence selection affects metabolic responses during
cycling and subsequent running time to fatigue
Fabrice Vercruyssen, R Suriano, David Bishop, Christophe Hausswirth,
Jeanick Brisswalter
To cite this version:
Fabrice Vercruyssen, R Suriano, David Bishop, Christophe Hausswirth, Jeanick Brisswalter.
Ca-dence selection affects metabolic responses during cycling and subsequent running time to
fa-tigue.
British Journal of Sports Medicine, BMJ Publishing Group, 2005, 39 (5), pp.267-272.
D
Cadence selection affects metabolic responses during
cycling and subsequent running time to fatigue
F Vercruyssen, R Suriano, D Bishop, C Hausswirth, J Brisswalter
. . .
See end of article for authors’ affiliations . . . Correspondence to: Dr Vercruyssen, Department of Sport Ergonomics and Performance, University of Toulon-Var, BP 132, 83957 La Garde cedex, France; vercruyssen@ univ-tln.fr . . .
Objectives: To investigate the effect of cadence selection during the final minutes of cycling on metabolic responses, stride pattern, and subsequent running time to fatigue.
Methods: Eight triathletes performed, in a laboratory setting, two incremental tests (running and cycling) to
determine peak oxygen uptake (VO2PEAK) and the lactate threshold (LT), and three cycle-run combinations.
During the cycle-run sessions, subjects completed a 30 minute cycling bout (90% of LT) at (a) the freely chosen cadence (FCC, 94 (5) rpm), (b) the FCC during the first 20 minutes and FCC220% during the last 10 minutes (FCC220%, 74 (3) rpm), or (c) the FCC during the first 20 minutes and FCC+20% during the
last 10 minutes (FCC+20%, 109 (5) rpm). After each cycling bout, running time to fatigue (Tmax) was
determined at 85% of maximal velocity.
Results: A significant increase in Tmax was found after FCC220% (894 (199) seconds) compared with FCC
and FCC+20% (651 (212) and 624 (214) seconds respectively). VO2, ventilation, heart rate, and blood
lactate concentrations were significantly reduced after 30 minutes of cycling at FCC220% compared with
FCC+20%. A significant increase in VO2 was reported between the 3rd and 10th minute of all Tmax
sessions, without any significant differences between sessions. Stride pattern and metabolic variables were
not significantly different between Tmax sessions.
Conclusions: The increase in Tmax after FCC220% may be associated with the lower metabolic load during
the final minutes of cycling compared with the other sessions. However, the lack of significant differences in metabolic responses and stride pattern between the run sessions suggests that other mechanisms, such as
changes in muscular activity, probably contribute to the effects of cadence variation on Tmax.
uring triathlon racing (swim/cycle/run), the most critical and strategic aspect affecting overall perfor-
mance is the change from cycling to running.1–6
These studies have attempted to identify aspects of cycling that may improve running performance in triathletes. Drafting has been shown to be a beneficial cycling strategy which results in an improved subsequent running performance in elite
triathletes.4 More recently, the selection of cycling cadence
during a cycle-run combination has been identified by researchers as an important variable that may affect overall
performance.1 2 5 6 Cadence selection has been reported to
influence metabolic responses, kinematic variables, and performance during a cycle-run session. However, the extent to which the cadence selection affects subsequent maximal running performance during a cycle-run combination remains unclear.
In a laboratory setting, Vercruyssen et al5 have shown that
the adoption of a low cadence (73 rpm), corresponding to the
energetically optimal cadence, reduced oxygen uptake (VO2)
during a cycle-run session, compared with the selection of higher cadences (80–90 rpm). These authors suggested that the choice of a low cadence (,80 rpm) before the cycle-run transition may be advantageous for the subsequent run. However, during field based investigations, Gottshall and
Palmer2 found an improved 3200 m track running perfor-
mance after 30 minutes of cycling conducted at a high cadence (.100 rpm) compared with lower cadences (70–90 rpm) for a group of triathletes. It was suggested that the selection of a high cadence improved running performance through increased stride rate and running speed during the subsequent
run. In contrast, Bernard et al6 showed no effect of cycling
cadence (60–100 rpm) and stride rate on a subsequent 3000 m running performance. These conflicting results indicate the difficulty of predicting the optimal cadence selection for a cycle-run session in trained triathletes.
In most of the above experiments, the triathletes were required to cycle at either an imposed cadence (range 60– 110 rpm) or a freely chosen cadence (range 80–90 rpm) which remained constant for the entire 30 minutes of the cycle bout. This lack of cadence variation does not reproduce race situations, during which the cadence may vary
considerably especially before the cycle-run transition.1
Many triathletes attempt to optimise the change from cycling to running by selecting high cadences (.100 rpm) during the
final kilometres of cycling.1 2 6 Another strategy, however,
may be the selection of a low cadence (,75 rpm) before the cycle-run transition, in order to conserve energy for the
subsequent run.4 5
To our knowledge, no data are available on cadence changes during the last few minutes before the cycle-run transition and its effects on subsequent running performance.
Therefore the aim of this investigation was to examine, in a laboratory setting, the effect of cadence variations during the final 10 minutes of cycling on metabolic responses, stride pat- tern, and subsequent running time to fatigue in triathletes.
METHODS
Participants
Eight experienced male triathletes currently in training volunteered to take part in this experiment. All had regularly competed in triathlon racing at either sprint (0.750 km swim/ 20 km cycle/5 km run) or Olympic distances (1.5 km swim/ 40 km cycle/10 km run) for at least five years. Mean (SD) training distances a week were 11.1 (2.2) km in swimming, 285.7 (90.0) km in cycling, and 42.1 (12.9) km in running.
Abbreviations: FCC, freely chosen cadence; HR, heart rate; [La2], lactate concentration; LT, lactate threshold; Pmax, maximal power output;
Vmax, maximal running speed; VE, minute ventilation; VO2, oxygen
Variable Cycling Running
Table 1 Peak exercise responses of triathletes
VO2PEAK (ml/min/kg) VO2PEAK (l/min) 67.6 (3.6) 4.9 (0.4) 68.9 (4.6) 5.0 (0.5)
[La2] peak (mmol/l) 14.2 (2.1) 10.4 (3.1)*
Pmax (W)/Vmax (km/h) 39 5 (34) 19.5 (0.9)
Values are mean (SD).
*Significantly different from running (p,0.05).
VO2PEAK, peak oxygen uptake; LT, lactate threshold; HRpeak, peak heart
rate; [La2]peak, peak blood lactate concentration; Pmax, maximal power
output; Vmax, maximal running speed.
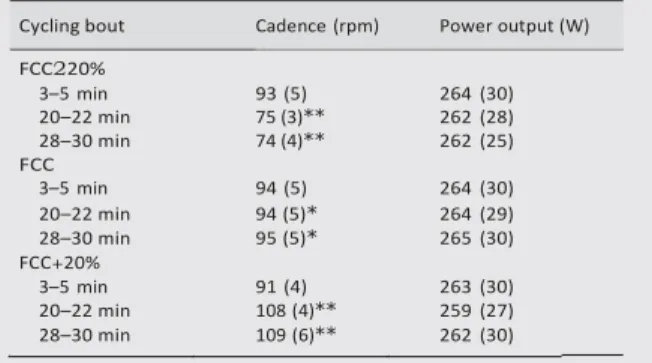
Table 2 Cadence and power output values during the three cycling bouts at different time periods: 3–5, 20–22, 28–30 min
Cycling bout Cadence (rpm) Power output (W)
FCC220%
Values are mean (SD).
*Significantly different from the first 20 minutes, p,0.05.
*Significantly different from the other conditions at the same time period, p,0.05.
VO2 at LT (l/min) 3.8 (0.4) 4.4 (0.5)*
HRpeak (beats/min) 176 (8) 182 (10)*
Mean (SD) age of the subjects was 28.9 (7.4) years. Their mean (SD) height and body mass were 178.3 (5.7) cm and 73.3 (6.0) kg respectively. The test procedures were approved by the Human Rights Committee of the University of Western Australia. Each triathlete carried out, in a laboratory setting
(20–22
˚
C, 40–60% relative humidity, 740–760 mm Hg pres-sure), five test sessions at the same time of day separated by a rest period of at least 48 hours.
Maximal tests
Two incremental tests were used to determine peak oxygen
uptake (VO2PEAK), maximal power output (Pmax), maximal
running speed (Vmax), and lactate threshold (LT). Subjects
performed cycling bouts on a racing bicycle mounted on a stationary turbo-trainer system. Variations in power output were measured using a ‘‘professional’’ SRM crankset system (Schoberer Rad Messtechnick, Fuchsend, Germany) pre- viously validated in a protocol comparison using a motor
driven friction brake.7 Running bouts were performed on a
motorised treadmill situated next to the cycle turbo-trainer. For cycling, the test bout began at an initial workload of 100 W for three minutes, after which the power output was increased by 40 W every three minutes until exhaustion. For the treadmill test, the initial running speed was fixed at 9 kph, with an increase in velocity of 1.5 kph every three minutes. For both cycling and running tests, there was a one minute rest period between each increment for the sampling of capillary blood (35 ml) from a hyperaemic earlobe. Blood samples were collected to determine plasma
lactate concentration ([La2]) using a blood gas analyser
(ABL 625; Radiometer Medical A/S, Copenhagen, Denmark).
performed 15 minutes of warm up comprising 13 minutes at a low power output (100–130 W) and the last two minutes at the individual workload required during the cycle bout of cycle-run sessions. After two minutes of rest, each triathlete completed a cycle bout at (a) the freely chosen cadence (FCC), (b) the FCC during the first 20 minutes and FCC220% during the last 10 minutes (FCC220%), or (c) the FCC during the first 20 minutes and FCC+20% during the last 10 minutes (FCC+20%). The FCC¡20% range has previously been used during a 30 minute cycling exercise in
triathletes.9 10 Cycling bouts were performed at a power
output corresponding to 90 % of LT (266 (28) W) and represented an intensity close to that reported in previous studies of the relation between cycling cadence and running
performance.5 6 FCC220% was chosen to replicate cadence
values close to the energetically optimal cadence previously
noted in triathletes,5
and FCC+20% allowed us to reproduce cadence values close to those reported during cycling
strategies before running.1 2 6 Cadence and power output
were monitored using the SRM power meter during all cycling bouts. No feedback was given to the subjects on their FCC over the three conditions.
After each cycling bout, running time to fatigue (Tmax) was
determined on the treadmill at a running speed correspond-
ing to 85% of Vmax (.LT) for each athlete (16.7 (0.7) kph).11 12
During these tests, VO2, minute ventilation (VE), and On the basis of previous experiments and the completion
respiratory exchange ratio were continuously recorded every 15 seconds using Ametek gas analysers (SOV S-3A and COV CD3A; Pittsburgh, Pennsylvania, USA). The four highest
consecutive VO2 values were summed to determine VO2PEAK.8
Pmax and Vmax were calculated as the average power output
and running speed in the last three minutes completed before exhaustion. Heart rate (HR) was monitored every 10 seconds during each experimental session using an electronic HR device with a chest electrode (Polar Vantage NV; Polar Electro Oy, Kempele, Finland). The LT calculated
by the modified Dmax method was determined by the point
on the polynomial regression curve that yielded the maximal perpendicular distance to the straight line formed by the lactate inflection point (first increase in lactate concentration
above the resting level) and the final lactate point.8
Cycle-run combinations
All triathletes completed, in random order, three cycle-run sessions each composed of 30 minutes of cycling, on a cycle turbo-trainer, and a subsequent run to fatigue. A fan was used in front of the subject during these experimental sessions. Before each experimental condition, subjects
of pilots tests, this running intensity was chosen to induce fatigue in less than 20 minutes. All subjects were given verbal
encouragement throughout each trial. The Tmax was taken as
the time at which the subject’s feet left the treadmill as he placed his hands on the guardrails. The transition time between running and cycling was fixed at 45 seconds to
reproduce the racing context.1 6
Measurement of metabolic variables
VO2, VE, and HR were monitored and analysed during the
following intervals: 3rd–5th minute of cycling bout (3– 5 min), 20th–22nd minute (20–22 min), 28th–30th minute (28–30 min) and every minute during the running sessions. Five blood samples were collected at the following intervals: before the warm up, at 5, 20, and 30 minutes during cycling,
and at the end of Tmax.
Measurement of kinematic variables
Power output and cycling cadence were continuously recorded during the cycling bouts. For each running session, a 50 Hz digital camera was mounted on a tripod 4 m away from the motorised treadmill. Subsequently, the treadmill
3–5 min 93 (5) 264 (30) 20–22 min 75 (3)** 262 (28) 28–30 min 74 (4)** 262 (25) FCC 3–5 min 94 (5) 264 (30) 20–22 min 94 (5)* 264 (29) 28–30 min 95 (5)* 265 (30) FCC+20% 3–5 min 91 (4) 263 (30) 20–22 min 108 (4)** 259 (27) 28–30 min 109 (6)** 262 (30)
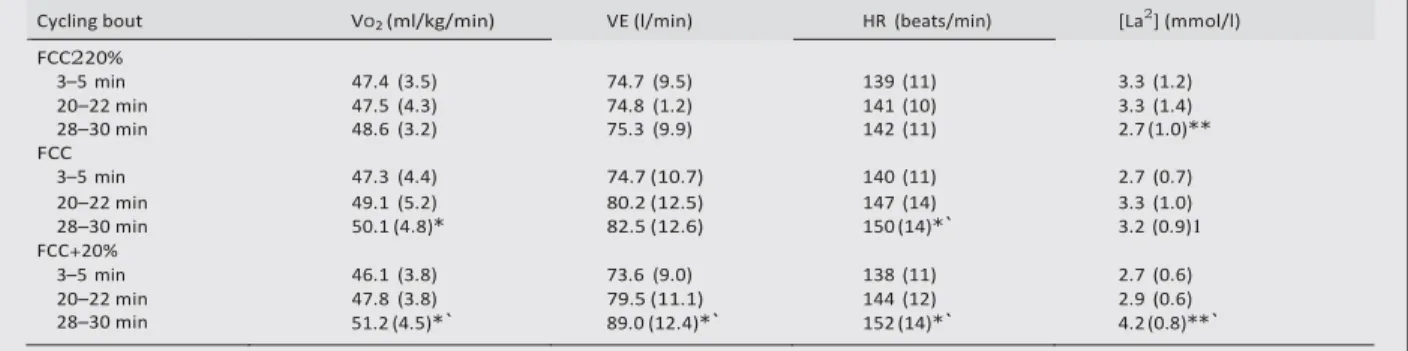
Table 3 Variations in mean oxygen uptake (VO2), minute ventilation (VE), heart rate (HR), and blood lactate concentration
([La2]), during the three cycling bouts, at different time periods: 3–5, 20–22, 28–30 min
Values are expressed as mean (SD).
*Significantly different from the 3–5 min interval, p,0.05. *Significantly different from the 20–22 min interval, p,0.05. `Significantly different from FCC220% at the same period, p,0.05. 1Significantly different from FCC+20% at the same period, p,0.05.
269 1200 1000 800 600 400 200 0
Figure 1 Running time to fatigue after the selection of various cycling cadences. Values are expressed as mean (SD). *Significantly different from the other sessions, p,0.05.
speed and period between two ground contacts for the same foot were determined using a kinematic video analysis system (SiliconCoach Pro Version 6, Dunedin, New Zealand). From these values, stride pattern characteristics— that is, stride rate (Hz) and stride length (m)—were calculated every 30 seconds during the first five minutes
and the last two minutes of the Tmax sessions.
Statistical analysis
All data are expressed as mean (SD). A two way variance analysis plan with repeated measures was performed to analyse the effects of cadence selection (FCC, FCC220%,
FCC+20%) and time during the cycle-run sessions using VO2,
VE, HR, [La2], stride rate, stride length, cadence and power
Cycling bouts of cycle-run sessions
No significant variation in FCC was observed during the first 20 minutes of the three cycling bouts (table 2). In addition, mean power output values were not significantly different between the cycling bouts (264 (30), 263 (28), and 261 (29) W respectively for FCC, FCC220%, and FCC+20%). These data show that subjects adhered to the experimental design with respect to the required power output-cadence combination.
A significant effect of exercise duration (between 3–5 and
28–30 min intervals) was observed on VO2, VE, and HR
during the FCC and FCC+20% bouts whereas no significant variation in these metabolic variables was identified with exercise duration during the FCC220% condition (table 3).
Moreover, mean VO2, VE, and HR were significantly lower at
FCC220% compared with FCC+20% during the 28–30 min
interval (respectively, 25.3%, 218.2%, and 26.8%). [La2]
was significantly higher during the 28–30 min interval at FCC+20% compared with FCC (+31.2%) or FCC220% (+55.5%).
Running bouts of cycle-run sessions
A significant increase in Tmax was observed only after the
FCC220% modality when compared with both the FCC+20% and FCC conditions (+43.3% and +37.3% respectively; fig 1).
Tmax values were 624 (214), 651 (212) and 894 (199) seconds
after the FCC+20%, FCC and FCC220% modalities respec-
tively. A significant increase in DVO2—that is, between the
3rd and 10th minute—was found during the Tmax completed
after FCC (+6.1%), FCC+20% (+6.7%), and FCC220%
(+6.5%) (table 4). However, mean VO2, VE, HR, and [La2]
were not significantly different between the three T
output, as dependent variables. A Tukey post hoc test was sessions (table 4). max
used to determine any differences between the cycle-run
combinations. Differences in Tmax obtained between the three
experimental conditions were analysed by one way analysis of variance. A paired t test was used to analyse differences in
VO2PEAK, HRpeak, and VO2 at LT between the two maximal
tests. Statistical significance was set at p,0.05.
RESULTS
Maximal tests
No significant differences in VO2PEAK were observed between
the sessions (table 1). However, HRpeak and VO2 at LT were
significantly higher during running than during the maximal cycling bout (+2.9% and +15.8% respectively).
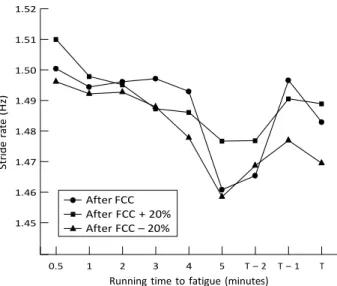
No significant difference in stride pattern was observed
during the Tmax sessions whatever the prior cadence selection
(fig 2). Mean stride rate (Hz) and stride length (m) were 1.49 (0.01) and 3.13 (0.02), 1.48 (0.01) and 3.13 (0.03), 1.49
(0.01) and 3.15 (0.02), during the Tmax sessions subsequent
to the FCC, FCC220% and FCC+20% bouts respectively.
DISCUSSION
The main findings of this investigation show a significant
increase in Tmax when the final 10 minutes of cycling is
performed at FCC220% (894 seconds) compared with FCC (651 seconds) and FCC+20% (624 seconds). Several hypoth-
eses are proposed to explain the differences in Tmax reported
Cycling bout VO2 (ml/kg/min) VE (l/min) HR (beats/min) [La2] (mmol/l)
FCC220% 3–5 min 47.4 (3.5) 74.7 (9.5) 139 (11) 3.3 (1.2) 20–22 min 47.5 (4.3) 74.8 (1.2) 141 (10) 3.3 (1.4) 28–30 min 48.6 (3.2) 75.3 (9.9) 142 (11) 2.7 (1.0)** FCC 3–5 min 47.3 (4.4) 74.7 (10.7) 140 (11) 2.7 (0.7) 20–22 min 49.1 (5.2) 80.2 (12.5) 147 (14) 3.3 (1.0) 28–30 min 50.1 (4.8)* 82.5 (12.6) 150 (14)*` 3.2 (0.9)1 FCC+20% 3–5 min 46.1 (3.8) 73.6 (9.0) 138 (11) 2.7 (0.6) 20–22 min 28–30 min 47.8 (3.8) 51.2 (4.5)*` 79.5 (11.1) 89.0 (12.4)*` 144 (12) 152 (14)*` 2.9 (0.6) 4.2 (0.8)**` R u nning t im e to f ati gue ( se co nds )
After FCC After After
Table 4 Variations in mean oxygen uptake (VO2), DVO2 (10–3 min), minute ventilation
(VE), heart rate (HR), and blood lactate concentration ([La2]) during the three running
sessions performed after cycling
Values are expressed as mean (SD).
*Significantly different between the 3rd and 10th minute of exercise, p,0.05.
After FCC After FCC + 20% After FCC – 20%
Variable Run after FCC220% Run after FCC Run after FCC+20%
VO2 (ml/min/kg) 63.9 (2.7) 62.0 (2.8) 61.8 (1.4) VO2 (l/min) 4.72 (0.4) 4.59 (0.4) 4.56 (0.3) VO2 (10–3 min)(ml/min)* 291.3 (126.5) 269.9 (123.5) 291.3 (114.5) VE (l/min) 122.5 (15.8) 122.0 (13.3) 122.8 (10.8) HR (beats/min) 169 (8) 169 (10) 168 (10) [La2] (mmol/l) 6.8 (1.7) 7.4 (2.1) 7.2 (2.2)
during the various cycle-run combinations for the group of triathletes.
A number of studies have analysed characteristics of cycle- run sessions in triathletes, with particular focus on physio- logical and biomechanical aspects during the subsequent
run.1 For instance, during a running session after cycling, a
substantial increase in energy cost, VE, and HR, and differences in muscle blood flow have been observed
compared with an isolated run.1 3 5 6
Moreover, variations in running kinematics such as stride rate, segmental angular position, and joint angle have been shown after a cycle
bout.3 5
These running alterations, which have been linked to the effects of exercise duration and cycle-run transition, were reported during treadmill sessions conducted at a submax- imal intensity and not during a high intensity running bout. In this study we investigated these effects at a high intensity close to a running speed previously observed during a short
cycle-run combination in triathletes.6
Metabolic hypotheses
The Tmax values of this investigation are comparable to those
previously reported during an exhaustive isolated run performed at an intensity corresponding to 85–90%
VO2MAX.11–13 It has previously been reported that metabolic
and muscular factors are potential determinants of middle distance running performance and/or exhaustive treadmill
sessions in trained subjects.14–18 With respect to metabolic
factors, the improvement in Tmax observed after FCC220%
may be related to changes in energy contribution. In support
1.52 1.51 1.50 1.49 1.48 1.47 1.46 1.45
of this hypothesis, it has been reported that the determinants of maximal performances in middle distance running may be linked to the energy requirement for a given distance and the maximal rate of metabolic energy output from the integrative
contribution of aerobic and anaerobic systems.15 18
During
submaximal and maximal running, the VO2 variation has
been reported to reflect the relative contribution from the
aerobic and anaerobic sources.15 In the context of a cycle-run
session, Bernard et al6
have reported that triathletes were able
to sustain a higher fraction of VO2MAX during a 3000 m track
run performed after cycling at 60 rpm than during cycling at 80 and 100 rpm. These authors suggested that a greater contribution of the aerobic component, during running after the choice of a low cadence, may delay fatigue for longer
running distances. In this investigation, the analysis of VO2
may also provide information on possible changes in aerobic contribution during high intensity running. Given the range
of Tmax values, the metabolic variables were analysed during
the first 10 minutes of each running session, corresponding
approximately to the mean Tmax values reported after the
FCC and FCC+20% modalities (fig 1). The evaluation of this
time interval indicates no significant differences in VO2
between the Tmax sessions, suggesting that the determination
of Tmax in this study was not affected by changes in metabolic
energy from the aerobic or anaerobic systems.
There was, however, a significant increase in VO2 between
the 3rd and 10th minute (6.1–6.7%) during the three Tmax
sessions, regardless of the prior experimental condition (table 4). During exercise lasting less than 15 minutes, the
continual rise in VO2 beyond the 3rd minute has been termed
the VO2 slow component (VO2SC).5 11 19 20 The occurrence of a
VO2SC is classically observed during heavy running and
cycling exercises associated with a sustained lactic acido-
sis—that is, above the LT.19 21 22 Postulated mechanisms
responsible for this VO2SC include rising muscle temperature
(Q10 effect), cardiac and ventilatory muscle work, lactate
kinetics, catecholamines, and recruitment of less efficient
type II muscle fibres.20 Within this framework, Yano et al23
suggested that muscular fatigue may be one of the factors
that produce the development of a VO2SC during high
intensity cycling exercise.
However, several investigators have examined the influ-
ence of prior exercise on the VO2 response during subsequent
exercise.24–26 Burnley et al24 showed that the magnitude of V
O2
kinetics during heavy exercise was affected only by a prior bout of heavy exercise. On the basis of similar results, it has been suggested that, during successive bouts of heavy
exercise, muscle perfusion and/or O2 off loading at the
0.5 1 2 3 4 5 T – 2 T – 1 T muscle may be improved, resulting in changes in VO
2 kinetics
Running time to fatigue (minutes)
Figure 2 Variations in stride rate during the running time to fatigue after the selection of various cycling cadences. T, Stride rate obtained at Tmax; T21, stride rate obtained at Tmax – 1 min; T22, stride rate
obtained at Tmax – 2 min.
during the second bout of exercise.25 26 In addition, changes
in the VO2 response may be accentuated by the manipulation
of cadence during an isolated cycling bout.27
Gotshall et al27
showed an increase in muscle blood flow and a decrease in systemic vascular resistance with increasing cadence (from
St ride rat e (H z)
271
70 to 110 rpm). These previous experimental designs, based on the characteristics of combined and isolated exercises, are similar to the current one and suggest that cadence selection
may affect blood flow and hence the VO2 response during a
subsequent run. For instance, the increased muscle blood
flow at high cycling cadence27 during a prior cycle bout could
attenuate the magnitude of VO2SC during subsequent
running.
In contrast with these earlier studies, the VO2SC values of
this investigation were not significantly different between
trials during the first 10 minutes of exercise between the Tmax
sessions. This was observed despite differences in metabolic load and cadence selection during the previous cycling bouts. These results indicate that the adoption of FCC220% is associated with a reduction in metabolic load with exercise
duration, but does not affect the VO2SC during the subsequent
run. For instance, the selection of FCC220% is associated
with a significant reduction in VO2 (25.3%), VE (218.2%),
HR (26.8%), and [La2] (255.5 %) during the final
10 minutes of cycling compared with FCC+20%, without
any significant changes in VO2SC during subsequent running
between the two conditions. This suggests that the chosen
cadences do not affect the VO2 responses during the
subsequent run and also that the occurrence of a VO2SC does
not contribute to the differences in Tmax found in this study.
This is consistent with previous research on trained sub-
jects.12
Muscular and stride pattern hypotheses
Although we conducted no specific analysis of muscular parameters, an attractive hypothesis to explain the differ-
ences in Tmax between conditions is that they are due to
differences in the muscular activity or fatigue state during cycle-run sessions. Muscular contractions differ during cycling and running. Cycling is characterised by longer phases of concentric muscular contraction, whereas running involves successive phases of eccentric-concentric muscular
action.28 Muscle activity during different modes of contrac-
tion can be assessed from the variation in the electromyo- graphic signal. In integrated electromyography based investigations, it has been shown that muscles such as the gastrocnemius, soleus, and vastus lateralis are substantially
activated during running.14 17 28 Any alterations in the
contractile capability of these muscles may have affected
the ability to complete a longer Tmax during the cycle-run
sessions in this study.
Furthermore, many studies have reported substantial changes in muscular activity during isolated cycling exer-
cises, especially when cadence is increased or decreased.29–32
With respect to the cycle-run combination, the manipulation of cadence may accentuate modifications in muscular activity during cycling and influence the level of fatigue during a
subsequent run. Marsh and Martin30
showed a linear increase in electromyographic activity of the gastrocnemius and vastus lateralis muscles when cadences increased from 50
What this study adds
This study shows that the choice of a low cadence during the final minutes of cycling improves subsequent running time to fatigue.
to 110 rpm. Although activity of the gastrocnemius muscle has been shown to increase considerably more than the
soleus muscle as cadence is increased,30 31
Ericson et al29
have also reported a significant increase in soleus muscle activity with the selection of high cadences. These results from isolated cycling exercises conducted in a state of non-fatigue suggest that, during the last 10 minutes of the cycling bout of our study, there was greater recruitment of the vastus lateralis, gastrocnemius, and soleus muscles after cycling at higher cadences. This may have resulted in an increase in fatigue of these muscles, which are substantially activated during subsequent running. In contrast, the lower activity of the vastus lateralis, gastrocnemius, and soleus muscles after the FCC220% condition may have reduced the fatigue experienced during cycling and resulted in improved utilisa- tion of these muscles during the subsequent run. This may
have contributed to the observed increase in Tmax for this
condition. Nevertheless, Lepers et al10 suggested that the
neuromuscular fatigue observed after 30 minutes of cycling was attributable to both central and peripheral factors but was not influenced by the pedalling rate in the range FCC¡20%. In this earlier study, the selected power outputs (.300 W) for all cadence conditions were significantly higher than those used in our experiment (260–265 W).
The choice of high power outputs during cycling10
may result in attenuation of the differentiated effects of extreme pedalling cadences on the development of specific neuro- muscular fatigue. Further research is required to analyse the relation between various pedalling strategies and muscular recruitment patterns specific to a short cycle-run session (,1 hour).
The analysis of movement patterns during the cycle-run sessions also indicates that possible changes in muscle activity may be associated with modifications in kinematic
variables.3 Hausswirth et al3 reported significant variations in
stride rate-stride length combination during a run session subsequent to a cycling bout compared with an isolated run. These modifications were attributed to local muscle fatigue from the preceding cycle. In the present study, the absence of significant differences in stride pattern during running (fig 2), regardless of the prior cadence selection, indicates that there is no relation between stride pattern and running time to fatigue. These results are consistent with previous results from a laboratory setting where the running speed was fixed
on a treadmill after various cadence selections.5 In contrast,
in field based investigations, in which the running speed and stride pattern were freely selected by the athletes, Gottshall
and Palmer2 found that cycling at 109 rpm, compared with 71
and 90 rpm, during a 30 minute cycle session resulted in an increased stride rate and running speed during a 3200 m track session. However, these results are in contrast with
those of Bernard et al6
indicating an effect of the prior cadence on stride pattern only during the first 500 m and not during the overall 3000 m run. The relation between stride pattern, cycling cadence, and running performance is not clear. Further investigation is required to elucidate the mechanisms that affect running performance during a cycle-run session.
In conclusion, this study shows that the choice of a low cadence during the final minutes of cycling improves subsequent running time to fatigue. The findings suggest
What is already known on this topic
Various characteristics of cycle-run sessions in triathletes have been studied, with particular focus on physiological and biomechanical aspects during the subsequent run. During a running session after cycling, a substantial increase in energy cost, minute ventilation, and heart rate, and differences in muscle blood flow have been observed compared with an isolated run. Moreover, variations in running kinematics such as stride rate, segmental angular position, and joint angle have been shown after a cycle bout.
that metabolic responses related to VO2 do not explain the
differences in running time to fatigue. However, the effect of cadence selection during the final minutes of cycling on muscular activity requires further investigation. From a practical standpoint, the strategy to adopt a low cadence before running, resulting in a lower metabolic load, may be beneficial during a sprint distance triathlon.
ACKNOWLEDGEMENTS
We gratefully acknowledge all the triathletes who took part in the experiment for their great cooperation and motivation.
. . . Authors’ affiliations
F Vercruyssen, J Brisswalter, Department of Sport Ergonomics and Performance, University of Toulon-Var, BP 132, 83957 La Garde cedex, France
R Suriano, D Bishop, School of Human Movement and Exercise Science, University of Western Australia, Crawley, WA 6009, Australia C Hausswirth, Laboratory of Physiology and Biomechanics, Nationale Institute of Sport and Physical Education, 11, avenue du Tremblay, 75 012 Paris, France
Competing interests: none declared REFERENCES
1 Bentley DJ, Millet GP, Vleck VE, et al. Specific aspects of contemporary triathlon: implications for physiological analysis and performance. Sports Med 2002;32:345–59.
2 Gottshall JS, Palmer BM. The acute effects of prior cycling cadence on running performance and kinematics. Med Sci Sports Exerc 2002;34:1518–22. 3 Hausswirth C, Bigard AX, Guezennec CY. Relationships between mechanics
and energy cost of running at the end of a triathlon and a marathon. Int J Sports
Med 1997;18:330–9.
4 Hausswirth C, Lehe´naff D, Dre´ano P, et al. Effects of cycling alone or in a sheltered position on subsequent running performance during a triathlon. Med
Sci Sports Exerc 1999;31:599–604.
5 Vercruyssen F, Brisswalter J, Hausswirth C, et al. Influence of cycling cadence on subsequent running performance in triathletes. Med Sci Sports Exerc 2002;34:530–6.
6 Bernard T, Vercruyssen F, Grego F, et al. Effect of cycling cadence on subsequent 3-km running performance in well-trained triathletes. Br J Sports
Med 2003;37:154–8.
7 Jones SM, Passfield L. The dynamic calibration of bicycle power measuring cranks. In: Haake Sj, eds. The engineering of sport. Oxford: Blackwell Science, 1998:265–74.
8 Bishop D, Jenkins DG, Mackinnon LT. The relationship between plasma lactate parameters, Wpeak and endurance cycling performance. Med Sci Sports Exerc
1998;30:1270–5.
9 Lepers R, Millet GY, Maffiuletti NA, et al. Effect of pedalling rates on physiological response during endurance cycling. Eur J Appl Physiol 2001;85:392–5.
10 Lepers R, Millet GY, Maffiuletti NA. Effect of cycling cadence on contractile and neural properties of knee extensors. Med Sci Sports Exerc
2001;33:1882–8.
11 Avogadro P, Dolenec A, Belli A. Changes in mechanical work during severe exhausting running. Eur J Appl Physiol 2003;90:165–70.
12 Billat VL, Richard R, Binsse VM, et al. The VO2 slow component for severe
exercise depends on type of exercise and is not correlated with time to fatigue.
J Appl Physiol 1998;85:2118–24.
13 Candau R, Belli A, Millet GY, et al. Energy cost and running mechanics during a treadmill run to voluntary exhaustion in humans. Eur J Appl Physiol 1998;77:479–85.
14 Borrani F, Candau R, Millet GY, et al. Is the VO2 slow component dependent
on progressive recruitment of fast-twitch fibers in trained runners? J Appl
Physiol 2001;90:2212–20.
15 Brandon LJ. Physiological factors associated with middle distance running performance. Sports Med 1995;19:268–77.
16 Paavolainen L, Ha¨kkinen K, Nummela A. Neuromuscular characteristics and muscle power as determinants of 5-km running performance. Med Sci Sports
Exerc 1999;31:124–30.
17 Paavolainen L, Nummela A, Rusko H, et al. Neuromuscular characteristics and fatigue during 10 km running. Int J Sports Med 1999;20:516–21.
18 Di Prampero PE. Factors limiting maximal performance in humans. Eur J Appl
Physiol 2003;90:420–9.
19 Jones AM, McConnell AM. Effect of exercise modality on oxygen uptake kinetics during heavy exercise. Eur J Appl Physiol 1999;80:213–19. 20 Poole DC, Richardson RS. Determinants of oxygen uptake. Sports Med
1997;24:308–20.
21 Whipp BJ. The slow component of O2 uptake kinetics during heavy exercise.
Med Sci Sports Exerc 1994;26:1319–26.
22 Barstow TJ. Jones AM, Nguyen PH, et al. Influence of muscle fiber type and pedal frequency on oxygen uptake kinetics of heavy exercise. J Appl Physiol 1996;81:1642–50.
23 Yano T, Yunoki T, Ogata H. Relationship between the slow component of oxygen uptake and the potential reduction in maximal power output during constant-load exercise. J Sports Med Phys Fitness, 2001;41, 165–9.
24 Burnley M, Jones AM, Carter H, et al. Effects of prior heavy exercise on phase II pulmonary oxygen uptake kinetics during heavy exercise. J Appl Physiol 2000;89:1387–96.
25 Gerbino A, Ward SA, Whipp BJ. Effects of prior exercise on pulmonary gas- exchange kinetics during high-intensity exercise in humans. J Appl Physiol 1996;80:99–107.
26 Scheuermann BW, Hoelting BD, Noble ML, et al. The slow component of O2
uptake is not accompanied by changes in muscle EMG during repeated bouts of heavy exercise in humans. J Physiol 2001;531:245–56.
27 Gotshall RW, Bauer TA, Fahmer SL. Cycling cadence alters exercise hemodynamics. Int J Sports Med 1996;17:17–21.
28 Bijker KE, De Groot G, Hollander AP. Differences in leg muscle activity during running and cycling in humans. Eur J Appl Physiol 2002;87:165–70. 29 Ericson MO, Nisell R, Arborelius UP, et al. Muscular activity during ergometer
cycling. Scand J Rehabil Med 1985;17:53–61.
30 Marsh AP, Martin PE. The relationship between cadence and lower extremity EMG in cyclists and noncyclists. Med Sci Sports Exerc 1995;27:217–25. 31 Neptune RR, Kautz SA, Hull ML. The effect of pedaling rate on coordination in
cycling. J Biomech 1997;30:1051–8.
32 Takaishi T, Yamamoto T, Ono TY, et al. Optimal pedaling rate estimated from neuromuscular fatigue for cyclists. Med Sci Sports Exerc 1996;28:1492–7.