R E S E A R C H A R T I C L E
Open Access
Effects of spinal manipulative therapy
biomechanical parameters on clinical and
biomechanical outcomes of participants
with chronic thoracic pain: a randomized
controlled experimental trial
Isabelle Pagé
1,2,4*and Martin Descarreaux
2,3Abstract
Background: Spinal manipulative therapy (SMT) includes biomechanical parameters that vary between clinicians, but for which the influence on the therapy clinical effects is unknown. This parallel-randomized controlled trial aimed to investigate the effect of SMT biomechanical parameters on the outcomes of participants with chronic thoracic pain (CTP) following three treatment sessions (follow-up at one week).
Methods: Adults reporting CTP (pain within the evaluated region [T6 to T8] for≥3 months) were asked to participate in a four-session trial. At the first session, participants were randomly assigned to one of three
experimental groups (different SMT doses) or the control group (no SMT). During the first three sessions, one SMT was executed at T7 for the experimental groups, while a 5-min rest was provided to the control group. SMT were delivered through an apparatus using a servo-controlled linear actuator motor and doses consisted of peak forces, impulse durations, and rates of force application set at 135 N, 125 ms and 920 N/s (group 1), at 250 N, 125 ms and 1840 N/s (group 2), and at 250 N, 250 ms, 920 N/s (group 3). Disability and pain intensity were evaluated at each session (primary outcomes). Spinal stiffness was assessed before-and-after each SMT/rest and at follow-up. Tenderness and muscle activity were evaluated during each spinal stiffness trial. Improvement was evaluated at follow-up. Differences in outcomes between groups and sessions were evaluated as well as factors associated with clinical improvement.
Results: Eighty-one participants were recruited and 17, 20, 20 participants of the three experimental groups and 18 of the control group completed the protocol. In exception of higher pain intensity at baseline in the control group, no between-group differences were found for any of the outcomes. A decrease in pain intensity, disability, spinal stiffness, and tenderness during spinal stiffness were observed (p-values< 0.05). At follow-up, 24% of participants were classified as‘improved’. Predictors of improvement were a greater decrease in pain intensity and in tenderness (p-values< 0.05).
(Continued on next page)
* Correspondence:isabelle.page1@uqtr.ca
1
Department of Anatomy, Université du Québec à Trois-Rivières, Trois-Rivières, Québec, Canada
2Neuromusculoskeletal Research Group, Université du Québec à
Trois-Rivières, Trois-Rivières, Québec, Canada
Full list of author information is available at the end of the article
© The Author(s). 2019 Open Access This article is distributed under the terms of the Creative Commons Attribution 4.0 International License (http://creativecommons.org/licenses/by/4.0/), which permits unrestricted use, distribution, and reproduction in any medium, provided you give appropriate credit to the original author(s) and the source, provide a link to the Creative Commons license, and indicate if changes were made. The Creative Commons Public Domain Dedication waiver (http://creativecommons.org/publicdomain/zero/1.0/) applies to the data made available in this article, unless otherwise stated.
(Continued from previous page)
Conclusions: In an experimental setting, the delivery of a SMT does not lead to significantly different outcomes in participants with CTP than a control condition (spinal stiffness assessment). Studies are still required to explore the mechanisms underlying SMT effects.
Trial registration: ClinicalTrials.govNCT03063177, registered 24 February 2017).
Keywords: Spinal stiffness, Thoracic spine, Chronic pain, Electromyography, Spinal manipulation, Manual therapy, Biomechanics, Musculoskeletal manipulation, Back pain, Spine, Dose
Background
Back pain is highly prevalent in the general population and can lead to important individual and socioeconomic conse-quences [1]. The annual prevalence of low back pain (LBP) and middle back pain is respectively estimated at around 43 and 35% [2]. Complementary and alternative medicine is widely used by patients with back pain, with about 75% of patients consulting either in chiropractic, physical therapy or osteopathy [3]. Spinal manipulative therapy (SMT) and spinal mobilization constitute treatment options commonly offered by these clinicians and are now recommended in several clinical practice guidelines for the management of spinal pain [4–6]. Overall, these therapies are characterized by the delivery of a force using specific parameters of angu-lation, amplitude and speed to an intervertebral articuangu-lation, which results in specific biomechanical and/or neurophysio-logical effects [7]. Although SMT targets an intervertebral joint, the manual force is transmitted to the contiguous ar-ticulations and surrounding soft tissues. Previous studies have shown the presence of a dose-response relationship be-tween the therapy characteristics and individuals’ neurome-chanical responses (i.e. the targeted vertebra displacement, the relative displacement with its adjacent vertebrae and the response amplitude of surrounding muscles) [8–11]. Specif-ically, the muscle response amplitude increases with the in-crease in peak force [10], while it decreases when preload forces [9] and the impulse duration increase [8]. Regarding the absolute movement of the contacted vertebra, it in-creases with increasing peak forces [11] and with the de-crease in the preload force [9]. Although SMT yields neuromechanical responses that are believed to be linked to clinical effects, the effect of different SMT doses have been investigated in only one previous randomized controlled trial [12] highlighting the need for further investigations.
Nonspecific back pain regroups heterogenous patients that might not respond similarly to a given treatment. The identification of patient profiles that could help guide treat-ment options is now recognized as a key issue in back pain research [13]. Recently, monitoring of spinal stiffness mea-sured using a mechanical device has shown to effectively identify patients with LBP who are more susceptible to im-prove following few SMT sessions [14, 15]. Specifically, Fritz et al. (2011) showed that a decrease in lumbar spinal stiffness following the first treatment is an independent
predictor of improved disability at one week after two ses-sions of lumbopelvic SMT [14]. Using a similar protocol, Wong et al. (2015) observed, in participants with acute and chronic LBP, a significant decrease in L3 spinal stiff-ness following the first treatment, but only among those who reported a clinically significant improvement in dis-ability following the two treatments [15]. None of these studies have recorded the SMT dose delivered by clini-cians nor attempted to standardize the treatment using a mechanical device.
It is therefore unknown if triggering neuromechanical responses of greater magnitude influences SMT clinical, such as pain and disability, and biomechanical, such as spinal stiffness, outcomes in participants with spinal pain. Identifying a dose optimizing these outcomes could have important educational implications and ultimately lead to the improvement of patient care. The overall goal of this study was therefore to increase the understanding of the mechanisms underlying the clinical effects of SMT through an apparatus using a servo-controlled lin-ear actuator motor. Within an experimental paradigm, a modified parallel-randomized controlled trial was de-signed to investigate the effect of different SMT doses (i.e. including different peak forces and rates of force ap-plication) on the clinical and biomechanical outcomes of participants with chronic thoracic pain following three treatment sessions (follow-up one week after the last treatment). It was hypothesized that the SMT peak force and rate of force application would influence the pri-mary (pain intensity and disability) and secondary (spinal stiffness, and tenderness and muscle activity during the assessment of spinal stiffness) outcomes. It was also hy-pothesized that participants receiving SMT would show a greater improvement in the primary outcomes than those not receiving SMT. Moreover, since this study was exploratory, an analysis of factors associated with clinical improvement was also conducted.
Methods
Trial design
This controlled trial used a parallel design where partici-pants were allocated using a 1:1 ratio between the four groups (three experimental groups and one control group).
The trial is reported according to the CONSORT 2010 statement [16].
Participants
Adults with chronic thoracic pain were recruited through advertisements in the Trois-Rivières (Québec, Canada) local newspaper and social media. Inclusion and exclusion criteria are presented in Table1.
Procedures and intervention
Participants took part in four experimental sessions over a period of 2 to 3 weeks. The first three sessions, that were scheduled two to four days apart, were labeled as the treatment sessions, while the fourth session constituted the follow-up and occurred six to eight days following the last treatment session. A complete description of each procedure is presented below but, briefly, participants first completed a series of questionnaire and were evaluated for inclusion and exclusion criteria (including a physical examination). Following a demonstration of the SMT and spinal stiffness assessment procedures using the apparatus and explanation of its main safety features, participants laid face down on a treatment table (Techniques Tables Ltd., model TT5001029, Ontario, Canada). Identification of T6, T7 and T8 spinous processes and of T7 transverse processes was then performed by the investigator (IP) using a standardized procedure [18,19] and surface elec-tromyography (sEMG) electrodes were positioned over the thoracic erector spinae just below and over the T7 transverse processes area. A sEMG normalization trial was completed, followed by the assessment of spinal stiff-ness and SMT (experimental groups) or rest (control group) procedure. Spinal stiffness was reassessed immedi-ately following SMT/rest. These procedures were repli-cated during the second and third sessions, while the follow-up only included the completion of clinical ques-tionnaires and the assessment of spinal stiffness. Figure1
shows the experimental setup including the sEMG elec-trodes localization and contact areas for the assessment of spinal stiffness and SMT delivery.
Questionnaires at baseline
At the beginning of the first session, participants’ sex, age, weight and height, in addition to information regarding pain patterns (constant pain about every other day; or re-current pain less than every other day), sick leave due to thoracic pain and mean pain intensity in the past three months (0–100 visual analog scale with 0 - no pain and 100– extreme pain; VAS [20]) were gathered. Actual pain intensity (VAS), disability (Quebec Back Pain Disability Questionnaire – QBPDQ, /100) [21], Kinesiophobia (Tampa Scale of Kinesiophobia– TSK, score > 40/68 sug-gesting kinesiophobia) [22] and risk of symptoms persist-ence (STarT Back Screening Tool – SBST, score ≥ 5/9 suggesting physical findings accompanied or not by psy-chosocial barriers to recovery) [23] were also evaluated. Additionally, participants were asked to evaluate their ex-pectation towards their improvement at the fourth ses-sion. Participants were considered presenting a positive expectation if they expected that their condition“will im-prove” or a negative expectation if they expected that their condition“will deteriorate” or “will not change”.
Spinal manipulative therapy procedure
The intervention consisted of a single SMT delivered through an apparatus using a servo-controlled linear ac-tuator motor (Linear Motor Series P01-48 × 360, LinMot Inc., Zurich, Switzerland) [24]. The indenter device con-sisted of a twin-tip padded rod (θ tip = 10 mm; distance between the center of the tips = 56 mm) contacting the skin overlying T7 transverse processes (Fig. 2). This spinal level was targeted for all participants considering technical limitation with the apparatus and the lack of a current gold standard to determine a spinal level that would benefit the most of a SMT. However, participants had to report pain in the targeted area (T6-T8) to be in-cluded in the study (see Table 1). SMT were character-ized by a preload force of 20 N maintained during 1 s followed by the application of a specific force. The mag-nitude of the applied force, the impulse duration and the rate of the force application varied between groups (ex-perimental groups) and were within the range of doses
Table 1 Inclusion and exclusion criteria
Criteria Participants with chronic thoracic pain Inclusion criteria ▪ 18 and 60 years old.
▪ Thoracic pain * for at least 3 months (constant or recurrent).
▪ Pain within T6 to T8 region indicated on the pain diagram and/or during physical examination at the start of the first session. ▪ Pain intensity at the start of the first session ≥5/100.
Exclusion criteria ▪ Having a history of thoracic surgery or fracture.
▪ Diagnosed with a non-spine-related condition that might refers pain to the chest wall (e.g. heart, lung or oesophagus conditions). ▪ Diagnosed or suspected with one of the following conditions: spine-related inflammatory arthritis, aorta aneurism, advanced
osteoporosis, neuromuscular disease, myelopathy, malignant tumors, uncontrolled hypertension, radiculopathy, neurologic deficit, thoracic herniated disc, current infection, thoracic scoliosis (Cobb’s angle > 20°).
▪ Being a pregnant woman.
* Thoracic pain was defined as pain in the region bounded superiorly by the T1 spinous process, inferiorly by the T12 spinous process and laterally by the lateral margins of the erector spinae muscles [17]
used by manual therapists [25]. The Dose 1 group con-sisted of a peak force of 135 N applied in 125 ms and resulting in a rate of 920 N/s. These parameters were re-spectively set at 250 N, 125 ms and 1840 N/s for the Dose 2 group. The Dose 3 group consisted of the same peak force as the second group (250 N) applied in 250 ms and resulting in the same rate of force application as the Dose 1 group (920 N/s). Participants of the fourth group (the control group) rested quietly for 5 min in-stead of receiving a SMT. For each SMT, the preload force (N), peak force (N), impulse duration (ms), rate of force application (N/s), velocity (mm/s) and indenter displacement during the impulse phase were computed using the mechanical device displacement (mm), force (N) and time (ms) data recorded at 204.8 Hz.
Spinal stiffness procedure
Immediately before and after the intervention (SMT/ rest), spinal stiffness was assessed four times at T6, T7 and T8 spinous processes by the same apparatus used to deliver the SMT. The measurement of spinal stiffness using this device has been shown to be reliable at T6, T7 and T8 [26]. The indenter head (18 mm × 25 mm) was covered by high-density silicone padding and was posi-tioned over the targeted spinous process (Fig. 2). A randomization scheme [27] was used to determine in which order the spinal levels would be assessed for each participant. For every spinal stiffness trial, the investiga-tor instructed the participant to inhale, exhale, and then hold his breath during measurement (~ 5 s). During ex-halations, the linear motor displaced the indenter until applying a 5 N load on the spinous process. While the participant held his breath, a total load of 45 N was gradually applied using an 18 N/s rate of the force appli-cation. This load was maintained for 1 s before being withdrawn. LinMot-Talk 5.1 (LinMot Inc., Elkhorn, Wis-consin, USA) was used to sample the applied force and resulting indenter displacement at a frequency of 135 Hz. After each trial, participants rated their tenderness during the procedure (0–100 VAS) and the sEMG activ-ity was recorded during each trial.
sEMG procedure
At the beginning of each session, four sEMG electrodes were positioned bilaterally at approximately 2 cm from the spine (over the thoracic erector spinae muscle belly) just above and below the T7 transverse processes. To de-crease skin impedance, the skin was shaved, gently abraded with fine-grade sandpaper (Red Dot Trace Prep, 3 M; St. Paul, MN, USA) and cleaned with alcohol swabs. sEMG data were recorded at 2000 Hz using Trigno™ Wireless EMG sensors (Delsys Inc., Natick, Massachusetts, USA). Following instrumentation, partic-ipants were asked to perform a normalization trial. This Fig. 1 Experimental setup. sEMG electrodes, contact areas during
the spinal manipulative therapy (T7 transverse processes; circles) and contact areas during spinal stiffness assessment (T6, T7 and T8 spinous processes; triangles) are visualized
Fig. 2 The mechanical device used to deliver the spinal manipulative therapy and to assess spinal stiffness. A twin tip was used during spinal manipulative therapy delivery, while a single tip was used during the assessment of spinal stiffness
trial consisted in maintaining, without support, the upper trunk in line with the lower body for 5 s. sEMG was recorded during each measurement of spinal stiff-ness as well as during the impulse phase of each SMT.
Outcomes
The primary outcomes of this study were pain intensity (VAS) and disability (Quebec Back Pain Disability Ques-tionnaire - QBPDQ), while secondary outcomes were spinal stiffness and both muscle activity and tenderness during the assessment of this parameter. Time points at which outcomes were evaluated are presented in Table2. The outcome for the exploratory analysis only included the subjective improvement (“improved” or “not im-proved”) at the follow-up. Indeed, at follow-up, partici-pants completed a subjective overall improvement scale (7-point Likert scale: strongly improved; moderately im-proved; slightly imim-proved; no change; slightly deterio-rated; moderately deteriodeterio-rated; or strongly deteriorated) [28]. This outcome was further dichotomized in “proved” (moderately or strongly improved) or “not im-proved” (slightly improved to strongly deteriorated). The outcomes were not modified following the start of the recruitment process and were evaluated by the principal investigator (IP).
Sample size
The required sample size was estimated using G*Power software (G*Power 3.1) based on the results of Haas et al. (2014) that showed an average decrease in pain inten-sity of 17.70% (SD = 17.35%) in participants with low back pain following 6 weeks of manual therapy [29]. A minimum sample size of 13 participants was determined to detect a statistically significant difference with a power of 0.80, effects size of 0.5 and an alpha value of 0.05. Considering the attrition risk and the comparisons
between four groups, a sample size between 15 and 25 participants per group was targeted.
Randomization
One randomization scheme for males and one for fe-males were generated using an online software [27] by an independent investigator. This investigator subse-quently wrote each allocation (either one of the three ex-perimental groups or the control group) in a sealed envelope identified with the participant’s sex (male or fe-male) and a sequential number (1, 2, 3 …). Once a par-ticipant provided informed consent, the lead investigator (IP) opened the following envelope of the males’ or fe-males’ pile.
Blinding
Due to the nature of the intervention, the investigator (IP) and the participants of the control group were not blinded, while participants of the experimental groups were blinded to the specific SMT dose (i.e. the peak force and rate of force application) they received.
Data analysis
Spinal stiffness calculation
To calculate spinal stiffness coefficients, a MATLAB script was developed. Terminal and global spinal stiff-ness coefficients were calculated using the force and dis-placement data recorded during each spinal stiffness trial. As previously suggested [30], the first trial of each series of four measurements was excluded. The spinal stiffness value obtained for the second, third and fourth trials were therefore averaged to obtain one terminal and global coefficient for each series of measurement. The terminal coefficient was defined as the ratio of the load divided by the displacement between 10 and 45 N, while the global coefficient was defined as the slope of
Table 2 Primary and secondary outcomes evaluated, and time points used for analyses
Outcome Session 1 Session 2 Session 3 Session 4 (follow-up)
Primary outcomes
Pain intensity (VAS) at the session beginning X X X X
Back disability (QBPDQ) at the session beginning X X X X
Secondary outcomes
Spinal stiffness at T6, T7 and T8 (N/mm) Before SMT/rest X
Muscle activity during spinal stiffness at T6, T7 and T8 (nRMS)
During spinal stiffness procedure before SMT/rest X
Tenderness during spinal stiffness at T6, T7 and T8 (VAS)
During spinal stiffness procedure before SMT/rest X
Outcome for the exploratory analysis
Subjective improvement X
VAS Visual analog scale (0–100); QBPDQ Quebec Back Pain Disability Questionnaire (0–100 score); nRMS normalized root mean square (i.e. amplitude of the muscle activity)
the straight-line best fitting the data over the same load interval.
sEMG data processing
sEMG signals were processed using a custom MATLAB (MathWorks®, Natick, Massachusetts, USA) script. Bipo-lar sEMG data acquired during normalization trials were first digitally band pass filtered using a 40 Hz low cut-off frequency to filter the electrocardiogram signal contam-inating the sEMG signal and a 400 Hz high cut-off fre-quency (2nd order Butterworth filter). The root mean square (RMS) value was then computed for each elec-trode during a 2 s time-window, during which the signal was visually stable.
To assess muscle activity during spinal stiffness trials, the sEMG signals were submitted to the same filtering than sEMG signals acquired during the normalization trial. The RMS value was then computed for each elec-trode between 10 and 45 N application and was normal-ized (later referred to as nRMS) by dividing it by the respective RMS value obtained during the normalization trial. The average value from the four electrodes was used for subsequent analyzes. The muscle response amplitude during the impulse phase of each SMT was similarly computed.
Statistical analysis
Baseline descriptive and comparative analysis
Mean (with SD) or median (with IQR = Q3-Q1) was computed for the demographic characteristics and clin-ical questionnaire scores at baseline as well as for spinal stiffness (T6, T7 and T8), muscle activity during spinal stiffness assessment and tenderness during spinal stiffness assessments. Between-group differences were tested using either analysis of variances (ANOVAs) or Kruskal-Wallis tests (for non-parametric data). The neuromechanical re-sponses (displacement and muscle activity) recorded dur-ing the first session SMT were also compared between the three experimental groups. The number of participants initially presenting a positive expectation and of those pre-senting a negative expectation towards their improvement was calculated for each group. Statistics were computed using SPSS Statistics 21 (IBM®, Armonk, New York, USA) and statistical significance was set atp ≤ 0.05.
Primary outcomes analysis
Since pain intensity (VAS) and disability (QBODQ) were non-normally distributed, they were respectively trans-formed using the cubic root (VAStransf) and the square
root (QBPDQtransf) to restore quasi-normality. Repeated
measures ANOVAs was computed to evaluate if pain intensity (VAStransf) and disability (QBPDQtransf) at the
session beginning differed between sessions and groups, and if an interaction between these variables was
present. The presence of a monotonic trend of improve-ment was determined by computing E2 statistics [31] and Tukey post-hoc tests were computed for significant effects/interactions.
Secondary outcomes analysis
Spinal stiffness (terminal and global coefficients), and tenderness (VAS) and muscle activity (nRMS) during the assessment of spinal stiffness were identified as the sec-ondary outcomes of this study. Each coefficient of spinal stiffness was submitted to a 4 × 4 × 3 mixed-model ANOVAs with Tukey post-hoc tests to evaluate if the parameter differed between groups, sessions and spinal levels as well as the presence of interactions between these variables. Since tenderness and muscle activity could not be transformed to meet the distribution re-quirements of ANOVA, between-group differences were assessed on changes in these variables between the first and fourth sessions using Kruskal-Wallis nonparametric procedure. Moreover, regardless of the group, differences in these variables between the first assessment (pre SMT/rest at the first session) and follow-up (fourth ses-sion) were assessed using Wilcoxon Matched-Pairs test.
Exploratory analysis of factors associated with clinical improvement
To conduct the exploratory analysis, participants were divided between those “improved” and “not improved” at follow-up. A logistic regression was computed to ex-plore the role of the clinical and biomechanical out-comes in the prediction of“improved” participants. First, differences in the demographic (age, weight, height and BMI), baseline clinical (mean pain intensity in the past 3 months, pain intensity, disability, TSK score, SBST score, and tenderness during spinal stiffness) and bio-mechanical (muscle activity during spinal stiffness and spinal stiffness) variables were determined between “im-proved” and “not im“im-proved” participants using t-test for independent samples (parametric data) or Mann-Whitney U test (nonparametric data). Other potential variables to include in the logistic regression were determined by com-puting these tests between“improved” and “not improved” participants on the ‘slopes of change’ in VAStransf,
QBPDQtransf, global and terminal spinal stiffness, and
ten-derness and muscle activity during T6 to T8 spinal stiff-ness assessment. For each variable, the ‘slope of change’ was calculated between values of the first two sessions and between values of all sessions. The‘slope of change’ of a specific variable was defined by the coefficient of the straight-line best fitting the values over time for a partici-pant (e.g. pain intensity at session 1, 2, 3 and 4).‘Slopes of change’ in tenderness, muscle activity and spinal stiffness were also computed between values of before and after
the first SMT/rest. All variables presenting significant dif-ference between “improved” and “not improved” partici-pants were included in the logistic regression model. Besides the logistic regression, the positive predictive value of an initial positive expectation and the negative predict-ive value of an initial negatpredict-ive expectation were computed to explore the role of expectation towards the improve-ment at follow-up.
Results
Recruitment
The recruitment started on May 1st, 2017 and the last follow-up occurred on December 22nd,2017. The trial ended considering that the number of participants within each group laid within the range estimated (15 to 25 per group).
Participant flow
A total of 81 participants were randomly assigned in ei-ther one of the three experimental groups (Dose 1 group = 21 participants; Dose 2 group = 22 participants; Dose 3 group = 21 participants) or the control group (18 participants). All participants received the intended intervention. Data of 18 participants of the control group, 17 of the Dose 1 group, 19 of the Dose 2 group and 20 of the Dose 3 group were included for analysis. The experimental flow is shown in Fig.3.
Baseline data
Baseline characteristics are reported in Table 3. Groups were similar at baseline with the exception of pain inten-sity: despite the randomization procedure, participants in the control group presented significantly higher pain
intensity at baseline than participants in Dose 2 group (p = 0.01). Initially, 65.0, 81.8, 85.7 and 56.0% of partici-pants in Dose 1, Dose 2, Dose 3 and control groups re-spectively presented a positive expectation towards their improvement at the fourth session.
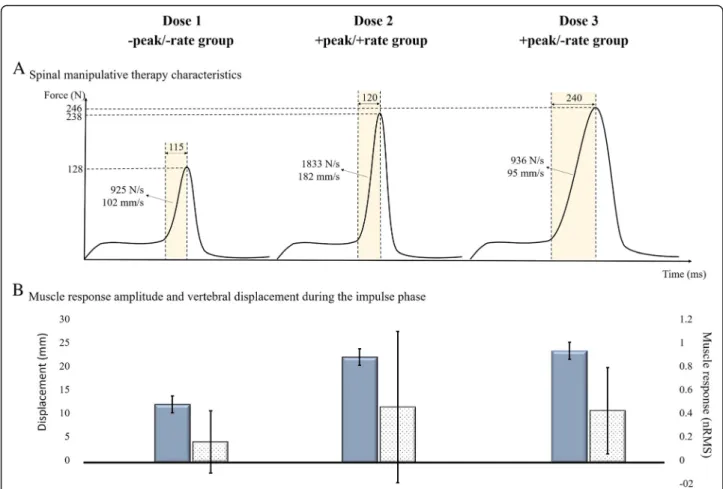
Comparison of the neuromechanical responses during SMT between the three experimental groups revealed less displacement in theDose 1 group (11.82 ± 1.70 mm) than in the Dose 2 group (21.49 ± 1.69 mm; p < 0.001) and the Dose 3 group (22.70 ± 1.70 mm; p < 0.001): F2, 60= 197.30,
p < 0.001, η2
p = 0.87). Muscle activity during the impulse
phase was significantly greater in theDose 2 group (me-dian ± IQR = 0.46 ± 0.70) compared to the Dose 1 group (0.17 ± 0.26;p = 0.01): H2= 11.25, p = 0.003. Muscle activity
during the impulse phase in the Dose 3 group (0.43 ± 0.36) was non-significantly different than the muscle activity in Dose 1 (p = 0.10) and Dose 2 (p = 0.71) groups. These results suggest that the SMT doses generated significantly different neuromechanical responses (displacement and muscle activ-ity). The average value of SMT biomechanical parameters and resulting displacements and muscle activity received by each experimental group may be visualized in the Fig.4.
Results for the primary outcomes
Primary and secondary outcomes at each time point are reported in the additional Table (see Additional file 1: Table S1). The analysis revealed no significant between-group differences in disability across the four sessions (F3, 71= 0.43, p = 0.73), but confirmed the presence of
higher pain intensity at baseline within the control group compared to theDose 2 group (F3, 71= 3.61,p = 0.02,
η2
p = 0.13). Both pain intensity and disability were
significantly different between sessions: F3, 213= 18.92,
p < 0.001, η2
p= 0.21 and F3, 71= 0.43,p = 0.73 respectively. E2
statistics confirmed the presence of a gradual improvement across sessions, regardless of group allocation, in regards of pain intensity (E24,213= 0.21, p < 0.01) and disability
(E24,210= 0.33, p < 0.01). Pain intensity decreased by an
average of − 11.70% (95%CI = − 15.37 to − 7.94) between the first and the fourth session, while disability decreased by an average of− 4.79% (95%CI = − 5.87 to − 3.70). Pain intensity at baseline was also included as a covariable in a repeated-measures ANCOVA for disability but it didn’t impact the results (i.e. no between-group differences but improvement across the sessions).
Results for the secondary outcomes
Analyses revealed no statistically significant difference in any of the secondary outcomes (spinal stiffness, tenderness and muscle activity during spinal stiffness) between the four
groups (all p values > 0.05). However, changes over time were observed (including in the control group). Indeed, spinal stiffness was similar at T6 between all sessions (p values ≥ 0.05), while, at T7 and T8, spinal stiffness at the first session was significantly higher than at the other sessions (except between the first and third sessions for T7 global stiffness) (p values < 0.05). The global stiff-ness showed a mean decrease of− 0.01 (95%CI = − 0.20 to 0.17) N/mm at T6,− 0.25 (− 0.43 to − 0.07) N/mm at T7 and of − 0.32 (− 0.51 to − 0.13) N/mm at T8. These changes were respectively − 0.04 (− 0.22 to 0.15), − 0.25 (− 0.43 to − 0.08) and − 0.33 (− 0.53 to − 0.14) N/mm for the terminal stiffness. Moreover, a significant de-crease in tenderness between the first and the fourth session was observed at T6 (− 3.83, 95%CI = − 6.49 to − 1.17; z = 3.18, p = 0.001), T7 (− 2.41, 95%CI = − 4.75 to − 0.08; z = 2.13, p = 0.03) and T8 (− 2.48, 95%CI = − 4.65 to − 0.30; z = 2.40, p = 0.02). No significant between-session differences were revealed for muscle
Table 3 Participants’ characteristics at baseline for the experimental groups and the control group
Characteristic Dose1
−peak/−rate Dose 2+peak/+rate
Dose 3
+peak/−rate Control Fand3,77p valueor H3value
Males: Females 6: 14 8: 14 8: 13 6: 12 –
Age (years) 41.50 (13.79) 37.45 (13.48) 37.19 (11.14) 35.83 (13.68) F = 0.57; p = 0.64
Weight (kg) 70.88 (12.66) 72.21 (18.80) 74.66 (18.90) 68.85 (13.15) F = 2.03; p = 0.12
Height (m) 1.65 (0.08) 1.67 (0.07) 1.68 (0.10) 1.68 (0.07) F = 0.69; p = 0.56
Body mass index (kg/m2) 26.12 (4.62) 28.91 (7.15) 26.09 (4.51) 24.48 (4.27) F = 2.43; p = 0.07
Average pain intensity in the past three months
(0–100, median, IQR) 30.00 (20.00) 27.50 (10.00) 30.00 (26.00) 50.00 (40.00) H = 7.51;p = 0.06
Pain intensity at the start of the first session
(0–100, median, IQR) 20.00 (10.00) 20.00 (15.00) 30.00 (29.97) 50.00 (44.00) H = 12.06,p = 0.01*
TSK score (/68) 30.45 (7.26) 31.64 (6.89) 31.71 (8.23) 33.39 (6.17) F = 0.53; p = 0.66
QBPDQ score (%, median, IQR) 9.00 (15.00) 16.31 (18.09) 12.92 (11.51) 12.50 (15.00) H = 1.47p = 0.69
SBST score (/9, median, IQR) 2.00 (3.00) 2.00 (3.00) 3.00 (3.00) 3.50 (2.00) H = 6.73;p = 0.08
Global spinal stiffness at the first session before SMT/rest (N/mm)
T6 8.02 (1.20) 7.49 (1.62) 7.70 (1.62) 8.14 (1.43) F = 0.81; p = 0.49 T7 7.96 (1.05) 7.38 (1.80) 7.72 (1.83) 8.03 (1.18) F = 0.75; p = 0.52 T8 7.73 (1.18) 7.39 (1.87) 7.62 (1.98) 7.80 (1.63) F = 0.23; p = 0.87 Terminal spinal stiffness at the first session before
SMT/rest (N/mm)
T6 8.06 (1.26) 7.50 (1.65) 7.73 (1.64) 8.20 (1.44) F = 0.88; p = 0.46 T7 7.98 (1.07) 7.41 (1.88) 7.75 (1.95) 8.06 (1.21) F = 0.69; p = 0.56 T8 7.77 (1.24) 7.39 (1.90) 7.64 (2.07) 7.86 (1.66) F = 0.27; p = 0.84 Tenderness during spinal stiffness assessment
(%, median, IQR)
T6 18.83 (22.50) 13.33 (23.33) 16.67 (18.67) 19.17 (23.33) H = 2.42;p = 0.49 T7 13.33 (24.33) 5.00 (16.33) 10.00 (20.00) 15.00 (16.33) H = 2.84;p = 0.42 T8 9.33 (19.33) 4.17 (21.00) 8.33 (16.67) 10.00 (18.33) H = 1.26;p = 0.74 Muscle response amplitude during spinal
stiffness assessment (nRMS, median, IQR)
T6 0.10 (0.09) 0.13 (0.11) 0.08 (0.15) 0.11 (0.10) H = 4.78;p = 0.19 T7 0.10 (0.06) 0.14 (0.13) 0.08 (0.06) 0.11 (0.11) H = 5.12;p = 0.16 T8 0.09 (0.05) 0.13 (0.13) 0.08 (0.04) 0.11 (0.09) H = 5.02;p = 0.17
Expectation (+: - or neutral) 13: 7 18: 4 18: 3 10: 8 –
Mean and standard deviation are reported unless otherwise indicated Note: pain intensity and QBPDQ are de-transformed values
* Participants in the control group presented higher pain intensity at baseline than participants in the Dose 2 group
Abbreviation: IQR interquartile range, TSK Tampa Scale of Kinesiophobia, QBPDQ Quebec Back Pain Disability Questionnaire, SBST STarT Back Screening Tool, SMT spinal manipulative therapy, nRMS normalized root mean square
activity during spinal stiffness (p values at each spinal level≥ 0.05).
Results for the exploratory analysis
At the fourth session, a total of 18 participants were “im-proved”, while 59 were “not improved”. Three (16%) partic-ipants of theDose 1 group, 7 (35%) of the Dose 2 group, 6 (30%) of theDose 3 group and 2 (11%) of the control group were classified as “improved”. No significant differences were observed in the baseline characteristics between “im-proved” and “not im“im-proved” participants (p values ≥0.05) with the exception of the SBST score for which“improved” participants showed higher scores than“not improved” par-ticipants (U = 366.0,p = 0.047). “Improved” participants ini-tially presented a median (IQR, range) SBST score of 4 (3, 1–6), while “not improved” participants presented a median score of 3 (3, 0–8). Probabilities of being “improved” and “not improved” when presenting a positive and a negative expectation were respectively of 28.6% and 90.5%.
Analyses revealed greater ‘slopes of change’ (i.e. a greater decrease across the four sessions or between the first two sessions or between before and after the SMT/rest at the first session) among “improved” participants in 6 variables: pain intensity across the four sessions (U = 268.5, p = 0.002); T6
tenderness across the four sessions (U = 326.0,p = 0.03); T6 tenderness between the first two sessions (U = 276.0, p = 0.002); T8 tenderness between the first two sessions (U = 357.5,p = 0.04); T8 terminal stiffness between the first two sessions (U = 359.0, p = 0.04); and T7 tenderness between before and after the first SMT/rest (U = 355.0, p = 0.03). These variables, as well as SBST score and initial expectation (positive or negative), were entered in the logistic regression to determine if these variables significantly associated with being“improved” at the follow-up (Table4). Overall associ-ation/prediction success was 87.7% (96.4% for “not im-proved” and 61.1% for “imim-proved” participants): φ = 0.65, χ2
(1) = 30.61, p < 0.001. Overall, a greater decrease in pain intensity across the four sessions (p = 0.01), a greater de-crease in tenderness during T6 spinal stiffness assessment between the first two sessions (p = 0.048), and a higher SBST score (p = 0.07) were significant and almost significant pre-dictors of “improved” participants (or significant variables associated with being“improved”).
Harms
One participant within the Dose 1 group left due in-creased back pain that subsided more than 72 h after the first SMT.
Discussion
This study failed to demonstrate an effect of SMT dose (i.e. the peak force and the rate of force application) on the clinical and biomechanical changes in participants with chronic thoracic pain. Overall, a decrease in the primary (pain intensity and disability) and secondary (spinal stiffness and tenderness during spinal stiffness as-sessment) outcomes were observed across the sessions not only regardless of the therapy dose (groups 1 to 3), but also in the group that did not receive any SMT (con-trol group).
SMT dose and spine-related pain
Comparisons with previous studies remain limited. The RCT published by Snodgrass et al. (2014) seems to be the only other study comparing the effect of a manual therapy (i.e. spinal mobilization) of different doses on clinical and biomechanical outcomes in a clinical popu-lation [12]. These authors evaluated the immediate and the short-term (~ 4 days) change in pressure pain thresh-old (main outcome) and neck disability, pain intensity, spinal stiffness and range of motion (secondary out-comes) following either a 90 N spinal mobilization, a 30 N spinal mobilization or a placebo (detuned laser) in participants with chronic nonspecific neck pain. Their results revealed no between-group difference on the pri-mary outcome but, in contrast with the current study, suggested a dose effect on neck pain intensity and spinal stiffness. Indeed, the 90 N spinal mobilization group showed, at short-term, greater decrease in pain intensity than the 30 N spinal mobilization group and in spinal stiffness than the placebo group. Authors concluded that a specific dose of mobilization (force applied), appears necessary to reduce spinal stiffness and potentially pain. However, their results also revealed a non-statistically significant change in pain intensity between the 90 N spinal mobilization and the placebo groups, and in spinal stiffness between the 90 N spinal mobilization and
the 30 N spinal mobilization groups. These results are therefore more consistent with an absence of a strong influence of SMT characteristics on this therapy effects This might partly explain the lack of significant differ-ence between the groups of the current study especially considering that all participants (included the control group) received light mobilization through the assess-ment of spinal stiffness.
Besides the fact that the spinal stiffness procedure could have resulted in a clinical improvement and thus
might have limited the possibility to detect
between-group differences, other reasons could explain the absence of significant between-group differences in the current study. First, although participants were asked to be symptomatic at baseline, the severity of their clin-ical status could be considered, in average, mild to mod-erate which could have resulted in a floor effect considering the limited window of improvement. This also explains that the average change in pain intensity (− 11.70%) and disability (− 4.79%) fell below the min-imal clinically important difference (MCID) thresholds which are respectively estimated to be 15% and 20% [32]. Future studies should aim to recruit participants presenting at least a moderate level of pain intensity and disability to evaluate the effect of SMT doses in a more clinically relevant population. Secondly, higher pain in-tensity at baseline was observed in the control group, these participants were, therefore, more susceptible to improve due to the regression toward the mean phenomenon which can have hidden a difference in the clinical improvement between the control group and the experimental groups. Third, it cannot be excluded that the changes in the clinical outcomes reflect the natural improvement of back pain which is known to constitute a cyclic condition and has been reported to be independ-ent of the intervindepend-ention received [33]. Finally, the im-provement might reflect that the contextual factors of a treatment are more important of the treatment modality
Table 4 Results of the logistic regression analysis to predict“improved” participants
Independent variables b (SE) p 95% CI for Odds Ratio
Lower Odds Ratio Upper
Intercept −3.51 (1.25) 0.01
STarT Back Screening Tool score 0.43 (0.23) 0.07 0.97 1.53 2.41
Initial expectation: positive vs negative −1.53 (0.94) 0.11 0.03 0.22 1.37
Slope of the change in pain intensity across the four sessions 0.39 (0.14) 0.01* 1.13 1.48 1.94
Slope of the change in T6 tenderness across the four sessions 0.01 (0.01) 0.50 0.98 1.01 1.04
Slope of the change in T6 tenderness between the first two sessions 0.13 (0.07) 0.048* 1.00 1.14 1.29
Slope of the change in T7 tenderness between before-and-after the first SMT/rest 0.09 (0.15) 0.57 0.81 1.09 1.48
Slope of the change in T8 tenderness between the first two sessions 0.07 (0.05) 0.22 0.96 1.07 1.19
Slope of the change in T8 terminal spinal stiffness between the first two sessions −1.00 (0.71) 0.16 0.09 0.37 1.48
Note: A positive slope indicates an improvement. R2
= 0.36 (Cox & Snell), 0.53 (Nagelkerke). Modelχ2
(8) = 32.02, p < 0.001 * Statistically significant predictor/variable
itself (see the discussion related to the variables associ-ated with improvement).
Regarding the secondary outcomes, it remains difficult to determine if the changes observed between the first and the last sessions are clinically significant. Although statistically significant, the change in tenderness during spinal stiffness remains small and failed to reach the MCID of 15%. The MCID for spinal stiffness is not known but some hypothesis can be raised from the current literature. Latimer et al. (1996) observed an 8% decrease in the initial spinal stiffness when participants reported an improvement of at least 80% in their LBP intensity [34]. This percentage would have represented a decrease of at least 0.60 N/mm in the current study, which is twice the average decrease observed. On the other hand, Wong et al. (2015) showed that, in partici-pants with LBP, a clinical improvement in disability fol-lowing two treatment sessions is associated to an average decrease in L3 spinal stiffness of 0.26 N/mm (95%CI = 0.08–0.43 N/mm), which is similar to the changes observed in the current study [15]. Finally, in contrast to the observation of an increase in spinal stiff-ness in participants with LBP [35], a decrease in this par-ameter has been observed in participants with chronic thoracic pain [26]. It is therefore more likely that these changes in spinal stiffness are not clinically relevant.
Variables associated with improvement
Considering that people with back pain constitutes a heterogenous population, an exploratory analysis was conducted to identify potential factors associated with a moderate to strong improvement at follow-up. Interest-ingly, 65% of the 18 “improved” participants received high peak force doses, suggesting that higher peak force increases the probability of improvement in at least some individuals. Current biomechanical and neuro-physiological models mostly explained SMT clinical ef-fects by the stimulation of spinal reflexes resulting, among others, in a hypoalgesia effect [36], an increase in spinal mobility [37] and an increase in maximum volun-tary contraction and proprioception [38]. However, it cannot be excluded that these clinical effects have, at least partly, been mediated by other factors such as the ones related to the context of treatment [39]. Previous studies showed that participants with neck pain receiv-ing SMT and initially believreceiv-ing that this therapy would help them were more likely to improve in comparison to participants not considering this therapy as potentially beneficial [29,40]. In the current study, 90.5% of partici-pants initially presenting a negative expectation towards the treatment effect were, indeed,“not improved” at the fourth session. Noteworthy, participants with negative expectations were twice as many in the control and low peak force dose groups than in the high peak force dose
groups. The portion of the clinical improvement associ-ated with these nonspecific effects is not known, but these results highlight the importance of considering pa-tient preferences and expectations in the choice of treat-ment modalities. Interestingly, previous studies failed to identify a prognostic value for the STarT Back Screening Tool in chiropractic settings [41]. In contrast to the studies included in the narrative review of Khan (2017), the 0–9 score was used in the current study instead of the 3-level risk stratification suggested by Hill et al. (2008) [42]. A score of > 3/9 on the SBST suggests the presence of physical findings that needs to be tailored, which can be accompanied or not by psycho-social bar-riers to recovery [42]. The reason why individuals with higher SBST score were more likely to be “improved” is not known but such results certainly warrants further investigation. The exploratory analysis also supports pre-vious literature on the importance of response to first treatments [43,44]. Indeed, a greater slope of change in pain intensity across the four sessions and a greater slope of change in tenderness during spinal stiffness at the targeted vertebra were predictors of a moderate to strong improvement. Considering that patients’ im-provement at the fourth session was shown to be a strong predictor of patient improvement at 3 and 12 months [45], importance of monitoring patient changes in pain intensity and tenderness across the first treat-ments to determine if a specific management is appro-priate needs to be investigated.
Neuromechanical responses and SMT
The current results do not support the hypothesis that SMT characteristics influence the clinical effects of this therapy. Indeed, the comparisons of the neuromechanical responses between the three experimental groups confirmed that dif-ferent responses were triggered although no between-group differences were revealed. Greater absolute vertebral dis-placement (indirectly obtained by the indenter displace-ment) was recorded in the two high peak force doses compared to the low peak force dose. Relative displacements were not measured in the current study, but SMT of lower peak force would unavoidably result in a lower relative dis-placement compared to SMT of greater peak force when de-livered with a similar rate of force application. Although it was initially hypothesized that the two high rate of force ap-plication doses would show similar and greater muscle re-sponse than the low rate dose, the only significant difference was observed between the high peak force/high rate dose and the low peak force/low rate dose. Whether a certain threshold of either neuromechanical responses is required to produce a clinical effect in participants with back pain can’t be determined with the design of the current study but should be considered in future studies.
Strengths and limitations
This study provides the first preliminary data regarding the influence of SMT characteristics on the therapy clinical/bio-mechanical effects using an RCT. The main strength is the between-group comparisons using a randomization sequence to minimize differences between them. Unfortunately, des-pite randomization, between-group differences in baseline pain intensity were present which may have influenced the results. Moreover, this study used a mechanical device to de-liver SMT and to assess spinal stiffness, which minimized between-participants and between-day variations. In contrast to previous studies evaluating SMT clinical effects, the ther-apy characteristics and the size of the contact surface were controlled in the current study. Moreover, a low attrition rate was reached (i.e. 7%).
Some limitations also need to be considered when interpreting the results of the current study. First, the in-terventions were not delivered within a clinical setting; therefore, the effects related to the clinician-patient rela-tionship, the SMT modulation during its delivery through feedback mechanisms, and to other components of patient management have not been evaluated. This constitute both a strength and a limitation of the study since it allowed the evaluation of the effect related to the SMT it-self but did not capture the whole effect of a management involving this therapeutic modality. Secondly, in average, participants initially presented levels of pain intensity and disability that can be considered as being low to moderate. Results should therefore should be generalized with cau-tion to other populacau-tions and future studies should recruit participants with a more clinically relevant status. It must also be noted that only three doses were evaluated. These doses, selected based on the previously conducted studies with the same apparatus [8–11], do not represent the whole and neither the average range of values performed by clinicians. Moreover, to ensure safety, peak forces remained in the lower/mid-range of forces reported in the literature which imply lower dose than the ones that could be delivered to certain patients within a clinical setting (e.g. for a large or fit [wo]man). It is consequently relevant to conduct studies comparing other doses or evaluating associations between SMT characteristics performed by clinicians and the clinical improvement of patients. Fi-nally, considering that the therapy characteristics and the treated area were not tailored to the participant’s morph-ology and complaints, future studies should investigate whether a personalized/targeted treatment can optimize clinical effects as well as if a participant not improving fol-lowing a SMT dose could improve with a different one.
Conclusion
This study showed, that in an experimental setting, the delivery of a SMT does not lead to significantly different outcomes (clinical and biomechanical) in participants
with chronic thoracic pain than a control condition only including the evaluation of spinal stiffness. A decrease in pain intensity, disability, spinal stiffness and tenderness during spinal stiffness assessment following four experi-mental sessions was observed regardless of the group al-location. Studies are still required to explore the mechanisms underlying SMT clinical effects and to iden-tify key characteristics of patients rapidly improving with this therapeutic modality. Overall, the observation of a rapid decrease in pain intensity and in tenderness during pressures over the spinous processes are performed con-stitute a better indicator of treatment success than the treatment characteristics.
Additional files
Additional file 1:Table S1. Primary and secondary outcomes at the different time points. (DOCX 19 kb)
Additional file 2:Anonymised data to replicate the analyses. (XLS 161 kb)
Abbreviations
BMI:Body mass index; IQR: Interquartile range; GS: Global coefficient; LBP: Low back pain; MCID: Minimal clinically important differences; QBPDQ: Quebec Back Pain Disability Questionnaire; RMS: Root mean square; SBST: STarT Back Screening Tool; sEMG: Surface electromyography; SMT: Spinal manipulative therapy; TS: Terminal coefficient; TSK: Tampa Scale of Kinesiophobia; VAS: Visual analog scale
Acknowledgements Not applicable. Funding
This study was supported by the Canadian Institutes of Health Research (CIHR, application number 314851), the Fonds de Recherche du Québec– Santé (FRQS, application number 28916) and the Fondation Chiropratique du Québec (FCQ). The funding sources had no role in the study design, in data collection, analysis and interpretation; in the preparation of the manuscript and in the decision to submit the manuscript for publication.
Availability of data and materials
All data generated or analysed during this study are included in this published article and an additional file (see Additional file2). Authors’ contributions
IP substantially contributed to the conception and design of the study, data acquisition, analysis and interpretation and drafting of the manuscript. MD substantially contributed to the conception and design of the study, data analysis and interpretation and drafting of the manuscript. Both authors provided their final approval of the version to be published and their agreement to be accountable for all aspects of the work.
Ethics approval and consent to participate
This study was carried out at the Université du Québec à Trois-Rivières (Trois-Rivières, Québec, Canada) in accordance with the Human Research Ethics Committee of the Université du Québec à Trois-Rivières (CER-17-232-07.03). All subjects provided written informed consent in accordance with the Dec-laration of Helsinki.
Consent for publication Not applicable. Competing interests
Publisher’s Note
Springer Nature remains neutral with regard to jurisdictional claims in published maps and institutional affiliations.
Author details
1Department of Anatomy, Université du Québec à Trois-Rivières,
Trois-Rivières, Québec, Canada.2Neuromusculoskeletal Research Group,
Université du Québec à Trois-Rivières, Trois-Rivières, Québec, Canada.
3Department of Human Kinetics, Université du Québec à Trois-Rivières,
Trois-Rivières, Québec, Canada.4Present address: Department of Physical
Therapy, Faculty of Rehabilitation Medicine, University of Alberta, Edmonton, Alberta, Canada.
Received: 4 October 2018 Accepted: 8 January 2019
References
1. Hartvigsen J, Hancock MJ, Kongsted A, Louw Q, Ferreira ML, Genevay S, et al. What low back pain is and why we need to pay attention. Lancet. 2018; 391(10137):2356–67.
2. Leboeuf-Yde C, Nielsen J, Kyvik KO, Fejer R, Hartvigsen J. Pain in the lumbar, thoracic or cervical regions: do age and gender matter? A population-based study of 34,902 Danish twins 20-71 years of age. BMC Musculoskelet Disord. 2009;10:39.
3. Murthy V, Sibbritt D, Adams J. An integrative review of complementary and alternative medicine use for back pain: a focus on prevalence, reasons for use, influential factors, self-perceived effectiveness and communication. Spine J. 2015.
4. Qaseem A, Wilt TJ, McLean RM, Forciea MA. Noninvasive treatments for acute, subacute, and chronic low Back pain: a clinical practice guideline from the American College of Physicians. Ann Intern Med. 2017.
5. Wong JJ, Cote P, Sutton DA, Randhawa K, Yu H, Varatharajan S, et al. Clinical practice guidelines for the noninvasive management of low back pain: a systematic review by the Ontario protocol for traffic injury management (OPTIMa) collaboration. Eur J Pain. 2017;21(2):201–16.
6. Bussieres AE, Stewart G, Al-Zoubi F, Decina P, Descarreaux M, Haskett D, et al. Spinal manipulative therapy and other conservative treatments for low Back pain: a guideline from the Canadian chiropractic guideline initiative. J Manip Physiol Ther. 2018.
7. Herzog W. The biomechanics of spinal manipulation. J Bodyw Mov Ther. 2010;14(3):280–6.
8. Pagé I, Nougarou F, Dugas C, Descarreaux M. The effect of spinal manipulation impulse duration on spine neuromechanical responses. J Can Chiropr Assoc. 2014;58(2):141–8.
9. Nougarou F, Dugas C, Loranger M, Page I, Descarreaux M. The role of preload forces in spinal manipulation: experimental investigation of kinematic and electromyographic responses in healthy adults. J Manip Physiol Ther. 2014;37(5):287–93.
10. Nougarou F, Dugas C, Deslauriers C, Page I, Descarreaux M. Physiological responses to spinal manipulation therapy: investigation of the relationship between electromyographic responses and peak force. J Manip Physiol Ther. 2013;36(9):557–63.
11. Nougarou F, Page I, Loranger M, Dugas C, Descarreaux M. Neuromechanical response to spinal manipulation therapy: effects of a constant rate of force application. BMC Complement Altern Med. 2016;16(1):161.
12. Snodgrass SJ, Rivett DA, Sterling M, Vicenzino B. Dose optimization for spinal treatment effectiveness: a randomized controlled trial investigating the effects of high and low mobilization forces in patients with neck pain. J Orthop Sports Phys Ther. 2014;44(3):141–52.
13. Kamper SJ, Maher CG, Hancock MJ, Koes BW, Croft PR, Hay E. Treatment-based subgroups of low back pain: a guide to appraisal of research studies and a summary of current evidence. Best Pract Res Clin Rheumatol. 2010; 24(2):181–91.
14. Fritz JM, Koppenhaver SL, Kawchuk GN, Teyhen DS, Hebert JJ, Childs JD. Preliminary investigation of the mechanisms underlying the effects of manipulation: exploration of a multivariate model including spinal stiffness, multifidus recruitment, and clinical findings. Spine (Phila Pa 1976). 2011; 36(21):1772–81.
15. Wong AY, Parent EC, Dhillon SS, Prasad N, Kawchuk GN. Do participants with low Back pain who respond to spinal manipulative therapy differ
biomechanically from nonresponders, untreated controls or asymptomatic controls? Spine (Phila Pa 1976). 2015;40(17):1329–37.
16. Schulz KF, Altman DG, Moher D, Group C. CONSORT 2010 Statement: updated guidelines for reporting parallel group randomised trials. BMC medicine. 2010;8:18-.
17. Merskey H, Bogduk N, International Association for the Study of Pain. Task Force on Taxonomy. Classification of chronic pain : descriptions of chronic pain syndromes and definitions of pain terms. 2nd ed. Seattle: IASP Press; 1994. xvi, 222 p. p.
18. Stonelake PS, Burwell RG, Webb JK. Variation in vertebral levels of the vertebra prominens and sacral dimples in subjects with scoliosis. J Anat. 1988;159. 19. Pagé I, Descarreaux M, Sobczak S. Development of a new palpation method
using alternative landmarks for the determination of thoracic transverse processes: an in vitro study. Musculoskelet Sci Pract. 2017;27:142–9. 20. Chapman JR, Norvell DC, Hermsmeyer JT, Bransford RJ, DeVine J, McGirt MJ,
et al. Evaluating common outcomes for measuring treatment success for chronic low back pain. Spine (Phila Pa 1976). 2011;36(21 Suppl):S54–68. 21. Kopec JA, Esdaile JM, Abrahamowicz M, Abenhaim L, Wood-Dauphinee S,
Lamping DL, et al. The Quebec Back pain disability scale. Measurement properties. Spine (Phila Pa 1976). 1995;20(3):341–52.
22. Lundberg M, Grimby-Ekman A, Verbunt J, Simmonds MJ. Pain-related fear: a critical review of the related measures. Pain Res Treat. 2011;2011:494196. 23. Bruyere O, Demoulin M, Beaudart C, Hill JC, Maquet D, Genevay S, et al.
Validity and reliability of the French version of the STarT Back screening tool for patients with low back pain. Spine (Phila Pa 1976). 2013.
24. Descarreaux M, Nougarou F, Dugas C. Standardization of spinal
manipulation therapy in humans: development of a novel device designed to measure dose-response. J Manip Physiol Ther. 2013;36(2):78–83. 25. Herzog W, Kats M, Symons B. The effective forces transmitted by
high-speed, low-amplitude thoracic manipulation. Spine (Phila Pa 1976). 2001; 26(19):2105–10 discussion 10-1.
26. Pagé I, Nougarou F, Lardon A, Descarreaux M. Changes in spinal stiffness with chronic thoracic pain: correlation with pain and muscle activity. PLoS One. 2018;13(12):e0208790.
27. Dallal GE. Web siteRandomization.com[updated July 15, 2008. Available from:http://www.randomization.com.
28. Hush JM, Kamper SJ, Stanton TR, Ostelo R, Refshauge KM. Standardized measurement of recovery from nonspecific back pain. Arch Phys Med Rehabil. 2012;93(5):849–55.
29. Haas M, Vavrek D, Peterson D, Polissar N, Neradilek MB. Dose-response and efficacy of spinal manipulation for care of chronic low back pain: a randomized controlled trial. Spine J. 2014;14(7):1106–16.
30. Shirley D, Ellis E, Lee M. The response of posteroanterior lumbar stiffness to repeated loading. Man Ther. 2002;7(1):19–25.
31. Laurencelle L. Statistical tables, explained and applied: world scientific; 2002. 32. Ostelo RW, Deyo RA, Stratford P, Waddell G, Croft P, Von Korff M, et al.
Interpreting change scores for pain and functional status in low back pain: towards international consensus regarding minimal important change. Spine (Phila Pa 1976). 2008;33(1):90–4.
33. Artus M, van der Windt DA, Jordan KP, Hay EM. Low back pain symptoms show a similar pattern of improvement following a wide range of primary care treatments: a systematic review of randomized clinical trials. Rheumatology. 2010;49(12):2346–56.
34. Latimer J, Lee M, Adams R, Moran CM. An investigation of the relationship between low back pain and lumbar posteroanterior stiffness. J Manip Physiol Ther. 1996;19(9):587–91.
35. Wong AYL, Kawchuk GN. The clinical value of assessing lumbar Posteroanterior segmental stiffness: a narrative review of manual and instrumented methods. PM and R: Journal of Injury, Function and Rehabilitation. 2017;9(8):816–30.
36. Pickar JG. Neurophysiological effects of spinal manipulation. Spine J. 2002; 2(5):357–71.
37. Henderson CN. The basis for spinal manipulation: chiropractic perspective of indications and theory. J Electromyogr Kinesiol. 2012;22(5):632–42. 38. Haavik H, Niazi IK, Jochumsen M, Sherwin D, Flavel S, Turker KS. Impact of
spinal manipulation on cortical drive to upper and lower limb muscles. Brain Sci. 2016;7(1).
39. Newell D, Lothe LR, Raven TJ. Contextually aided recovery (CARe): a scientific theory for innate healing. Chiropr Man Therap. 2017;25:6. 40. Haas M, Groupp E, Kraemer DF. Dose-response for chiropractic care of
41. Khan Y. The STarT back tool in chiropractic practice: a narrative review. Chiropr Man Therap. 2017;25:11.
42. Hill JC, Dunn KM, Lewis M, Mullis R, Main CJ, Foster NE, et al. A primary care back pain screening tool: identifying patient subgroups for initial treatment. Arthritis Rheum. 2008;59(5):632–41.
43. Axen I, Rosenbaum A, Robech R, Wren T, Leboeuf-Yde C. Can patient reactions to the first chiropractic treatment predict early favorable treatment outcome in persistent low back pain? J Manip Physiol Ther. 2002; 25(7):450–4.
44. Axen I, Rosenbaum A, Robech R, Larsen K, Leboeuf-Yde C. The Nordic back pain subpopulation program: can patient reactions to the first chiropractic treatment predict early favorable treatment outcome in nonpersistent low back pain? J Manip Physiol Ther. 2005;28(3):153–8.
45. Leboeuf-Yde C, Gronstvedt A, Borge JA, Lothe J, Magnesen E, Nilsson O, et al. The nordic back pain subpopulation program: demographic and clinical predictors for outcome in patients receiving chiropractic treatment for persistent low back pain. J Manip Physiol Ther. 2004;27(8):493–502.