HAL Id: hal-02823191
https://hal.inrae.fr/hal-02823191
Submitted on 6 Jun 2020
HAL is a multi-disciplinary open access
archive for the deposit and dissemination of sci-entific research documents, whether they are pub-lished or not. The documents may come from teaching and research institutions in France or abroad, or from public or private research centers.
L’archive ouverte pluridisciplinaire HAL, est destinée au dépôt et à la diffusion de documents scientifiques de niveau recherche, publiés ou non, émanant des établissements d’enseignement et de recherche français ou étrangers, des laboratoires publics ou privés.
Multi-criteria agro-environmental evaluation of low
input dairy farming systems
Miriam Bacchin
To cite this version:
Miriam Bacchin. Multi-criteria agro-environmental evaluation of low input dairy farming systems. Biodiversity and Ecology. 2010. �hal-02823191�
ISARA-Lyon University of Turin
Agrapole Agriculture Faculty
23 rue Jean Baldassini via L. Da Vinci 44
69364 LYON CEDEX 07 10093 Grugliasco (TO)
Multi-criteria agro-environmental
evaluation of low input dairy farming
systems
Master thesis
2nd Cohort (2008-2010) Miriam Bacchin
Date: 15th July 2010
ISARA’s tutor: professor Alexander Wezel Turin university tutor: Carlo Grignani INRA-Mirecourt tutor: Michel Marie
Acknowledgements
I would like to thank you the director of INRA-Mirecourt research unit Catherine Mignolet and my supervisor Michel Marie for the opportunity I’ve been given to carry out my MSc internship and thesis at the experimental site of Mirecourt.
I would also like to thank my supervisors from ISARA-Lyon Alexander Wezel and from Turin University Carlo Grignani for supporting my Master thesis work.
I am very grateful to all the personnel working at INRA-Mirecourt for the help and time I’ve been given during my work.
It was with pleasure and joy that I spent these last six months in Mirecourt, and this is especially thanks to my roommates, Adélaide, Magali, Laura, Laurine, Morgane, Fabrice, Pierre and Florence.
Finally my thankfulness is for my family, Mathieu and my friends, who all support me in spite of the physical distance.
Table of contents
1. Introduction ... 1
2. Sustainability of dairy farming systems ... 1
2.1. Sustainability assessment methods ... 2
2.2. Dairy farming systems evaluation ... 4
2.2.1. Input-output accounting system... 5
2.2.2. Ecological footprint ... 5
2.2.3. Life cycle assessment ... 6
2.2.4. Linear Programming model ... 7
2.2.5. Multicriteria analysis ... 8
3. Context of the study ... 17
3.1. The experimental farm of INRA-Mirecourt ... 17
3.2. Background for a multi-criteria evaluation ... 19
3.3. Objectives of agro-environmental sustainability ... 19
4. Materials and methods ... 21
4.1. Two low input organic dairy systems ... 21
4.2. Evaluation of the impact on abiotic resources ... 22
4.3. Indicators calculation ... 23
4.3.1. Data listing ... 24
4.3.2. Data collection ... 24
4.3.3. Indicators for abiotic resources ... 25
4.3.3.1. Water pollution risk ... 25
4.3.3.2. Air pollution risk ... 27
4.3.3.3. Soil quality ... 36
4.3.3.4. Energy consumption ... 37
4.3.4.1. Soil type ... 38
4.3.4.2. Crops and animals ... 39
4.3.4.3. Fertilizers ... 40
4.4. Aggregation ... 42
4.5. Statistical analysis ... 47
5. Results ... 48
5.1. Indicators results ... 48
5.1.1. INO3 (Nitrate leaching) ... 51
5.1.2. IMO (Organic matter content) ... 56
5.1.3. IPsol (Phosphorus availability) ... 58
5.1.4. IPres (Phosphorus losses) ... 60
5.1.5. IN2O (Nitrous oxide emission) ... 61
5.1.6. INH3 (Ammonia volatilization) ... 62
5.2. Aggregation results ... 64
6. Discussion ... 68
6.1. Evaluation results ... 68
6.2. Finding the appropriate indicators... 71
6.3. How to manage the aggregation of multiple criteria ... 72
6.4. Validation questions ... 73
6.5. Structural limits ... 74
7. Conclusions... 75
Reference list ... 76
List of figures
Figure 1. Farm gate P-surplus (kg P/ha) by farm type and amount of P supplied with manure...5
Figure 2. Elements and computation methods for the calculation of the ecological footprint of an organic dairy farm ………..6
Figure 3. Comparison of LCA results applied to conventional and organic dairy farms in five different countries (Germany, Sweden, The Netherlands, New Zealand and France)…..7
Figure 4. Graphic representation of results obtained with IDEA method .………9
Figure 5. OTPA horizontal bar graph used to represent farming practices evaluation results ...10
Figure 6. Pie-radar graph used to visualize MOTIFS output and interpretation guidelines …….11
Figure 7. Radar graphs visualizing the sustainability degree of a mixed livestock and crop farm evaluated by the tool RISE ...………12
Figure 8. Functioning of the two bovine milk systems conducted at the experimental farm of INRA-Mirecourt ………...18
Figure 9. Dexi-SPCE tree for the evaluation of the impact of the farming systems on the agro-environmental sustainability aspect “abiotic resources preservation” ……….20
Figure 10. The four rotation systems of the cropping-breeding system SPCE ………21
Figure 11. Indicators tree implemented for the evaluation of the impact of farming practices on abiotic resources as a component of agro-environmental sustainability ………..23
Figure 12. INDIGO form “Interventions” from which it is possible to enter data about pesticides treatments, fertilizers input, irrigation and machine operations ...………27
Figure 13. Structure of INH3 indicator ………28
Figure 14. Decision tree for the solid system of the module “NH3 emissions from barns” …….29
Figure 15. Decision tree for the solid system of the module “NH3 emissions from manure stocking sites” ...………29
Figure 16. Structure of IN2O indicator ………31
Figure 17. Procedure to calculate the CO2 emission amount corresponding to a value 0 for CO2 indicator ………35
Figure 18. Curve and function of the indicator CO2 ……….36
Figure 19. Agro-environmental sustainability tree and attributes weight ………....45
Figure 20. General structure and functioning of a decision rule-based, qualitative hierarchical multi-attribute model ………46
Figure 22. Radar graph summarizing the results obtained for each indicator used in the evaluation of the two dairy systems SPCE (blue line) and SH (red line) ……….48
Figure 23. Radar graph with the results of crop rotation systems evaluation ...………50
Figure 24. INO3 results ………51
Figure 25. Distribution of crop type among the six rotation systems ………...52
Figure 26. Distribution of soil type among the six rotation systems ………54
Figure 28. IMO results ………..56
Figure 29. IPsol results ……….58
Figure 30. IPres results ……….60
Figure 31. IN2O results ……….61
Figure 32. INH3 results ……….62
Figure 33. Indicators aggregation results for SPCE ……….65
List of tables
Table 1. Comparison of the methods with regards to the applied indicators ………13
Table 2. Coefficients used for the calculation of N2O emitted from barns and stocking sites …32 Table 3. Soil type registered in INDIGO form “Classe sol” ………39
Table 4. Animal groups and corresponding livestock unit (LSU) ………40
Table 5. Organic fertilizers and analysis as they have been registered in INDIGO “Fertilisants” form ………..41
Table 6. Attribution of ranges and corresponding qualitative scales to the indicators used in the evaluation ……….43
Table 7. Attribution of ranges and corresponding qualitative scales to the criteria (=aggregated attributes and root attributes) used in the evaluation ………44
Table 8. Results of the indicators evaluated on the two systems SPCE and SH ………..48
Table 9. Number of plots occupied by the same crop for each rotation systems ……….49
Table 10. Results of crop rotations evaluation ……….50
Table 11. INO3 average values related to soil type ………..53
Table 12. Number of observation, INO3 mean value and standard error in the six rotation systems (6H, 6P, 8H, 8P, PP, PP-SH) for the different soil types ……….53
Table 13. Number of observation, INO3 mean value and standard error in the 13 crop types for the different soil types ………..55
Table 14. Indicators results and their respective qualitative value as ranked with the tool DEXi………..64
Table 15. Evaluation of SPCE with DEXi tool ………66
List of abbreviations
General abbreviations
ALADIN: Application de la gestion des troupeaux Laitiers et Allaitants des Domaines INRA (Application of INRA experimental farms dairy cattle management)
APBI: Arboreous Plant Biodiversity Index
ASTER: AgroSystems, Territory, Environment and Resources BPA: Biological Productive Area
CEMAGREF: Institut de recherche en sciences et technologies pour l'environnement (Research institut of sciences and technologies for environment)
CDI: Crop Biodiversity Index
DAESE : Diagnostic Agri-Environnemental, Social et Economique (Agro-environmental, Social and Economic Diagnostic tool)
EDEN : Evaluation de la Durabilité des ExploitatioNs (Farms sustainability evaluation) FPCM: Fat and Protein Corrected Milk
FTE: Full Time Equivalent
GLEAMS: Groundwater Loading Effects of Agricultural Management GVA: Gross Value Added
HBI: Hedge Biodiversity Index
HPBI: Herbaceous Plant Biodiversity Index
IDEA: Indicateurs de durabilité des exploitation agricoles (Farm sustainability indicators) INRA: Institute National de la Récherche Agronomique
IOA: Input-Output Accounting Systems LCA: Life Cycle Assessment
LP model: Linear Programming model
MOTIFS: Monitoring Tool for Integrated Farm Sustainability MRI: Minimum Regional Income
OTPA: Observatoire Territorial de Pratiques Agricoles (Territorial observatory of farming practices)
PEC: Predicted Environmental Concentrations RISE: Response-Inducing Sustainability Evaluation SAD: Science for Action and Development
SH: Système Herbager (grazing system)
SPCE: Système Poly-Culture Elevage (crop-grazing system)
Indicators abbreviations
CO2: Indicator of carbon dioxide emission ICH4: Indicator of methane emission
IMO : Indicator for soil organic matter content INH3 : Indicator of ammonia volatilization
INO3 : Indicator of nitrate leaching
IN2O : Indicator of nitrous oxide emission
IPsol: Indicator of phosphorus availability IPres: Indicator of phosphorus losses
I-Phyto GW: Indicator of pesticides loss in groundwater I-Phyto SW: Indicator of pesticides loss in surface water I-Phyto Air: Indicator of pesticides loss in the air
N-R energy: Indicator of non-renewable energy use
Indicators parameter abbreviations
Ax: soil humus input into AR : recommended humus input
B0: CH4 production potential (m3 CH4/kg Vs)
BH: winter drainage
EB: ingested digestible energy EGb: ingested gross energy Fb: quantity of slurry in the barn Fp: quantity of stocked slurry FL: fuzzy logic
k1: isohumic coefficient LH: nitrate winter leaching
LP: nitrate leaching after fertilizer application
m: organic matter content of crop residues and manure MCF: methane conversion factor
Nex: g N/kg of excreted manure according to Tillie and Capdeville (1993) Nabs: N absorbed by a cover crop
Nmh: N from mineralization of soil humus Nmr: N from mineralization of crop residues Nre: N from over-fertilization
Nrr: N incompressible surplus
NXm: N from fertilizers applied in autumn
NXo: N captured by a cover crop
Qa: amount of manure produced per animal in one day (kg or m3/an/d), according to Ziegler and Heduit (1991);
RCF: reduction coefficient for the presence of a pit cover RL: floor cleaning modality coefficient
RSD: barn floor type coefficient Sb: barn surface
Sp: pit surface
T: tolerance threshold
v: ammonia volatilization coefficient
VS: volatile solids produced per day per system (kg/d) X: total P input on the plot
XA: P that can be absorbed by plants
XR: P recommended dose
Crop type abbreviations
Avhfev: Winter oat +faba bean Avpfev: Spring oat + faba bean Bh: Winter wheat
Ep: Spelt
LuDac: Alfalfa+dactyls Oh: Winter barley Op: Spring barley
OpLup: Spring barley +Lupin Prp: Permanent meadow
Prp-SH: Permanent meadow - SH Prt: Temporary meadow
Se: Rye
ThPf: Winter triticale +Fodder pea TpPf: Spring triticale + Fodder pea Tri: Winter triticale
TriP: Spring triticale
Soil type abbreviations
A: Clay
AL: Clay-Loamy L: Loamy
LA: Loamy-Clay LS: Loam-Sandy
1
1.
Introduction
The concept of sustainable development has taken a growing place in national and international policies since the statement of the Brundtland Commission on the impoverishment of people and environment due to the actual development model (WCED, 1987). In its report, the Commission defined as sustainable the “development that meets the needs of the present without compromising the ability of future generations to meet their own needs”. This general concept has been applied to many human activities in order to define the best actions to undertake for the preservation of resources, environment and people.
In the last fifty years also agriculture has been questioned about the sustainability of its practices: high pesticides use and its effects on people’s health and environment, land degradation and deforestation, biodiversity losses, food safety issues (f.i. BSE-mad cow, dioxin chicken, GMOs) and animal welfare, use of non-renewable energy and greenhouse gases emission, natural resources exploitation and landscape modification (Meynard, 2008). These problems are the consequences of a global strategy to increase agriculture productivity in order to feed a growing world population. The new technologies discovered in the developed countries have been transferred to some developing countries through what is called the “Green revolution”: chemical fertilizers, pesticides and new selected varieties to be highly productive in the new cropping conditions. Also livestock production has seen a strong intensification, in particular for dairy farming with the selection of high milk yielding cows (Nardone and Solms-Lich, 1999).
After five decades of implementation, global agriculture has witnessed the failure of this strategy, with declining marginal yields for input use and the environmental damages mentioned above. The aim of producing enough food for a still growing population, expected to reach 9 billion in 2050, has not been met. Global competition and low prices for commodities have caused the impoverishment of many farmers around the world or obliged them to leave their land. Today of the 2,5 billion people living of agriculture, 600 million cannot make a living out of it and 1,3 billion practice a subsistence agriculture (Griffon, 2007a). Furthermore in the recent years a new tendency stood out: the search for foreign arable land by net-importer or highly populated countries (such as Saudi Arabia, Unite Emirates, China and India) in order to assure food for their domestic population in the event of a new food crisis (Cotula et al., 2009).
On its side, livestock farming, with particular focus here on dairy systems, has been pointed out for its impact on the environment, for example due to nutrient leaching and eutrophication, as well for its social acceptability, in terms of ecological and ethical production (Gibon et al.,
2
1999a). The possibility for these hazards to become important impacts has drawn the attention of the public opinion and opened a new perspective for environmental and agriculture legislation.
How is agriculture supposed to face and answer these issues? Is sustainable agriculture the solution to those problems? If yes, which practices should be implemented to achieve sustainability and how to evaluate their effectiveness?
The idea of sustainability has far evolved from the catch phrase of WCED mentioned above and many definitions have been proposed (Mebratu, 1998). Agriculture could be defined sustainable if it is able to maintain in the long term its productivity as well as its benefits to society (Ikerd, 1993). This means that not only ecological but also economic and social aspects should be considered in the development of practices that could assure high production levels and at the same time preserve ecosystems functionality. The need here is to find a technological alternative that draws its knowledge from natural ecosystems interactions and services, coupling them with modern technologies to assure a sufficient food production today and in the future both at local and global scale.
This concept of ‘ecological intensification’ of agriculture has been given different names: agroecology, conservation farming, eco-agriculture, ever-green agriculture etc. (Griffon, 2007 b). The practices promoted are the same: crop rotation and association, introduction of leguminous plants to fix nitrogen from the atmosphere, use of local varieties adapted to the climate, cover crops, planting of hedges and grass strip, agroforestry, coupling animal breeding to crop production, use of animal manure and compost, minimum tillage, use of biological pest control methods, etc. The goals of these techniques are often multiple and synergic: soil fertility and soil structure improvement, erosion prevention, leaching of nutrients reduction to avoid eutrophication, closing of the nutrients cycle, biodiversity conservation, development of natural antagonists populations, soil, water and air quality preservation, fossil energy use limitation. Most of these practices are already implemented in organic farming, but this does not exclude a technological transfer to other types of agriculture that cannot face the obligations of organic standards, in order to reduce chemical inputs and pesticides use and promote an environmentally friendly intensification.
The need to test the effectiveness of agroecological practices at farm system and local level, has led to the establishment of long term farm trials (f.i. Rodale Institute1, Fibl for organic farming2), but more might be started to adapt those techniques to different local environments
1 Rodale Institute: http://www.rodaleinstitute.org/new_farm 2
3
and social contexts, in order to obtain a sort of library where field actors could compare and learn from different experiments and results (Meynard, 2008).
However, experimental farms have to be evaluated in order to assess which practices best fit sustainability requirements for a studied situations. Many methods and tools have been proposed to approach sustainability evaluation (Van der Werf and Petit, 2003; Ness et al., 2007) that could be applied to farming practices. Sustainability assessment can be carried out either ex ante, in order to visualize the potential results of different decision rules and practices management, or ex
post to establish if and at which degree the set objectives have been met. Furthermore, an
important step of the evaluation process is the validation of the method with regards to its usefulness and consistency towards the evaluated system.
This work aims at contributing to the evaluation of the agro-environmental sustainability of the experimental farm of INRA-Mirecourt, where two low-input organic dairy farming systems have been designed, one based on grassland (SH) and the other based on mixed crops-pasture management (SPCE) (Mignolet et al., 2004). The objective is to validate a method to evaluate the agro-environmental sustainability of the dairy farm. The method proposed for this assessment is a multi-criteria analysis of different aspects involved in the promotion of sustainable farm management which are evaluated through a tree of aggregated indicators.
The next chapter will propose an overview on the methods that have been used to assess dairy farming sustainability, in order to underline the difference between them and reasons why multi-criteria analysis has been chosen for the evaluation of INRA-Mirecourt dairy systems.
1
2.
Sustainability of dairy farming systems
Dairy cattle farming, as any animal husbandry activity in general, presents many constraints that could affect its sustainability. Certainly, the final effect depends on the farming management: manure availability could be a strength in a mixed cropping-breeding system, on the contrary it would rise disposal problems in an intensive indoor system. Whilst the first could valorize the self-sufficiency of its nutrients cycle, the latter would produce a surplus of nutrients that needs to be discharged somewhere else. Furthermore, the use of concentrates and dry fodder for feeding results in high land use devoted to cereals and proteaginous crops, with consequent application of fertilizers and pesticides, high consumption of direct and indirect fossil energy and water consumption for irrigation, animal drinking, cleaning of milking materials and stables. High density husbandry conditions could enhance disease spreading and animal stress, thus increasing the use of allopathic treatments.
These issues have emerged for most of the times sustainability of farming activities has been considered as a matter of “resource sufficiency” rather than as system’s reproduction capacity, a concept expressed as “functional integrity” (Thompson and Nardone, 1999).
Thus the wrong approach to farming system management could transform these constraints into threats to agro-environmental sustainability in the form of greenhouse gases emissions (CH4,
N2O, CO2), water pollution due to pesticides and nutrients leaching, air pollution (NH3, NOx,
SO2), soil erosion, diseases resistance to treatments, deterioration/worsening of animal health
and well-being and appearance of food safety issues (BSE, dioxin chicken, etc.). For instance, genetic variability could be threaten by the preference choice of high productive races at dispenses of local breeds. On the other side biodiversity of flora and fauna could be enhanced by the implementation of grazing and the maintenance of natural grassland, or could be lost with fodder crops specialization for indoor husbandry. Grazing could also contribute to soil erosion reduction, as well as the valorization of marginal areas and the maintenance of open spaces (Gibon, 2005). However, not only environmental but also economic and social aspects must be remembered: for example, the unpredictability of input market prices linked to the dependence on off-farm fodders threatens economic viability of farms, or the choice of local breeds could valorize local economy and keep alive local traditions.
These general concerns about dairy farming are the starting point of sustainability assessment, which is perceived as a hierarchical framework (Van Cauwenberg et al., 2007) where first, general principles are formulated as the overall goals to achieve sustainability (i.e. preservation of abiotic and biotic resources). Second, from those principles criteria are drawn,
2
which identify the impacts, the practice or the elements involved to accomplish the principles (i.e. water or air quality, soil fertility, climate change potential, biodiversity conservation). Third,
indicators are used to measure the level of compliance with a criterion and assess the state of the
system (i.e. nitrate leaching in watertable). Finally, reference value are defined to describe a quantitative threshold or target for the indicator (i.e. the maximum tolerate content of NO3 in watertable is 50 mg/l).
An indicator is “a variable which supplies information on other variables which are difficult to assess and which can be used as a benchmark to take a decision” (Gras et al., 1989). The objective of indicators is to quantify phenomena and situation which are complex and cannot be directly measured. The output of an indicator is a value that describes the state of the environment or the pressure of a pollutant and that can be used to compare similar systems in which the same variables are involved. Indicators can be the simple measurement or estimation of a variable, or the composition of several variables aggregated together (Bockstaller and Girardin, 2003). They could be classified into “means-based” (i.e. farming practices) or “effect-based” (i.e. effects of farming practices on the state of the system or on the environment): the latter usually require more data collection and are of not easy implementation, but their results describe an impact closer to reality (Hansen, 1996; Van der Werf and Petit, 2002).
There is no minimum or limit number of indicators, nevertheless it should be as small as possible and as large as essential (Bossel, 1999). According to Gamborg and Sandøe (2005), sustainability should be addressed by four to six principles (or concerns), each characterized by two to four criteria, which in turn could be assessed by two to four indicators. This means an overall sustainability evaluation could end up with 16-96 indicators.
2.1.
Sustainability assessment methods
Sustainability assessment methods have been compared in many papers (Van der Werf and Petit, 2002; Peschard et al., 2004; Halberg et al., 2005 (b); Thomassen and De Boer, 2005; Galan
et al., 2007; Ness et al., 2007; Van Cauwenbergh et al., 2007) with different objectives, spacing
from the proposition of evaluation guidelines, to the aid for choosing which indicators to implement, or the evaluation of results in terms of effectiveness of usefulness. Other authors have proposed indicators sets for the evaluation of one or more pillar of farm sustainability (Bockstaller et al., 1997; Andreoli and Tellarini, 2000; Castoldi and Bechini, 2010) as well as tool for holistic sustainability assessment such as RISE (Hӓni et al., 2003) and MEACROS (Mazzetto and Bonera, 2003). Important criteria that should be considered when analyzing or comparing different methods are scientific soundness (or relevance), feasibility, utility,
3
comprehensibility and cost, together with the comparison of output results and recommendations yielded from the different methods (Bockstaller et al., 2009 (a)).
Here the objective is not to exhaustively compare different evaluation methods to establish which is the most suitable for our purposes, but to describe the methods that approached the sustainability assessment of dairy farming systems. Five kinds of approach have been found in the literature: input-output accounting of nutrients, ecological footprint, Life Cycle Assessment, Linear Programming model, Multi-criteria analysis.
Input-output accounting (IOA) is a set of indicators that can be applied either to quantify
production fluxes for economic/budgetary survey, or to broader assess the environmental impact of a farm (Goodlass et al., 2003). The latter case is expressed as the surplus of nutrients, pesticides and energy originating from the flow of input entering the farm and of products leaving the farm (Halberg et al., 2005a). This surplus is considered to be lost to the environment (Goodlass et al., 2001). In Europe many IOA systems have been proposed to help farmers auditing the flow of potential pollutants in their farms and thus accomplish with EU environmental policies (Goodlass et al., 2003). IOAs have been developed especially in The Netherlands and Denmark, whose governments imposed environmental taxes based on the amount of nutrients surplus at farm level (Ondersteijn et al., 2002), following the commitment to the Council Directive 91/676 EEC (Nitrate Directive) which expresses the hazards of groundwater pollution and eutrophication due to nitrogen and phosphorus leaching (EEC, 1991; Goodchild, 1998). An example of IOA for France is the set of Agro-ecological indicators proposed by Bockstaller et al. (1997), which put the basis for the development of the tool INDIGO3.
The concept of ecological footprint was introduced in the early 1990s by W.E. Rees and M. Wackernagel (Rees, 1992; Rees and Wackernagel, 1994), who later proposed its calculation (Wackernagel and Rees, 1996). Ecological footprints is defined as the surface used directly or indirectly by an individual, a community or human population as a whole to produce its needed resources and to absorb its wastes (Wackernagel et al., 2002). The surface “consumed” is also referred to as biosphere annual regenerating capacity, earth biological carrying capacity or biological productive area (BPA). This concept has been applied to estimate environmental impact of various economic activities, depletion of natural resource by countries towards its
3
4
future generation, or the visioning of ecological future scenarios (Vuuren and Bouwman 2005; Venetoulis et Talberth, 2008; Ponthiere, 2009).
Life cycle assessment (LCA) is a product-related holistic method that evaluates the impact
of a product on the environment through its complete life cycle. The impact is expressed in terms of resources consumption and pollutants emission, including those occurring during the production of the product’s own inputs (Guinée et al., 2002). The impact category is related to a functional unit which can express a global impact, for example kg of produced meat, milk or grain, or a local impact, i.e. ha of land (Thomassen and De Boer, 2005; De Vries and De Boer, 2010).
Linear programming is a model which allows to define ex ante the economic performances
of an activity, e.g. a farm (Kerselaers et al., 2007). It maximizes a selected aspect for a farm (f.i. environmental impact) in order to see what changes/effects will occur to the other aspects, such as economic revenue. Thus it guides in defining the optimal technical solution for that farm. It is based on a matrix which crosses all farm activities with the constraints, internal and external, pressuring on the farm performances (Berentsen and Giesen, 1995).
Multi-criteria analysis is an integrated assessment method used for systems in which
competing evaluation criteria are present (Ness et al., 2007). It permits to distinguish which factors favor or constrain sustainability, acting as decision aid tool which can be implemented either in an ex ante or ex post evaluation. It allows obtaining a trade-off between opposing or conflicting objectives which results in an overall sustainability value at the farm system level. This single value can be break down into the lower-level criteria to observe the results yielded by the various objectives and thus their respective weight on the overall sustainability. Multi-criteria decision model such as MASC (Sadok et al., 2009), monitoring tool as RISE (Hӓni et al., 2003) and MOTIFS (Meul et al., 2008), and farm evaluation method such as IDEA (Vilain et al., 2003) have been proposed to link sustainability evaluation theory to farming management practice.
2.2.
Dairy farming systems evaluation
The literature review on dairy farming evaluation yielded two papers comparing or implementing IOA (Halberg et al., 2005a; Thomassen and De Boer, 2005), one for ecological footprint (Thomassen and De Boer, 2005), five for LCA (Hass et al., 2001; Thomassen and De Boer, 2005; Thomassen et al., 2008a; Thomassen et al., 2009; Van der Werf et al., 2009) and two main works on Linear programming model by Berentsen and Giesen (1995) and by Van Calker et al. which produced several consequently related papers (2004; 2005; 2006; 2007;
5
2008). With regards to multi-criteria approaches, five methods have been retained: an integrated economic-environmental accounting framework as applied by Pacini et al. (2003) in an Italian context, IDEA method (Zahm et al., 2008), OTPA indicators guide (Guillaumin et al., 2007b) and the tools MOTIFS (Meul et al., 2008) and RISE (Hӓni et al., 2003).
The methods introduced above present some differences and similarities with regards to parameters such as objective, sustainability aspects involved, spatial and temporal scale, type of indicators and their calculation, rating or scaling method, aggregation procedure. Additional differences are for example the time required to implement the method and the target end-users.
2.2.1. Input-output accounting system
Input-output accounting system was implemented by Thomassen and De Boer (2005) in a survey to compared different environmental evaluation methods on Dutch dairy farms. Halberg
et al. (2005b) compared ten different voluntary applications of IOA systems on north European
farms and the indicators used to evaluate the environmental impact of nutrients, pesticides and energies at farm level. In both cases applied indicators are quantitative simple indicators applied on a yearly base. Figure 1 present a graph in which different farms are compared for their phosphorus surplus by input-output accounting.
Figure 1. Farm gate P-surplus (kg P/ha) by farm type and amount of P supplied with manure, source Halberg et al. (2005b).
2.2.2. Ecological footprint
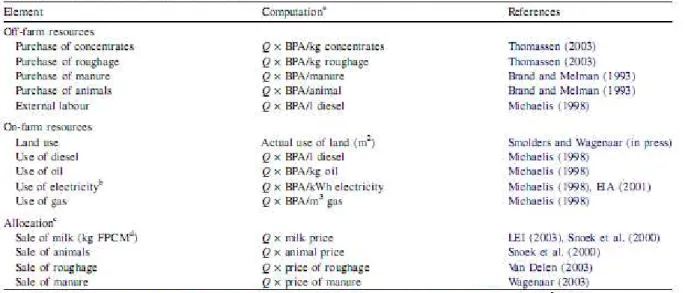
The ecological footprint assessment, due to its definition, yielded one single indicator: biological productive area (BPA) per kg of fat and protein corrected milk (FPCM). In the work of Thomassen and De Boer (2005) ecological footprints was evaluated at farm scale. It does not consider a particular time scale because it can cover different time periods according to inputs and outputs production. Figure 2 present the parameters used by the authors to calculate the ecological footprint of an organic dairy farm.
6
Figure 2. Elements and computation methods for the calculation of the ecological footprint of an organic dairy farm (source Thomassen and De Boer, 2005).
2.2.3. Life cycle assessment
Life cycle assessment as proposed by Thomassen and De Boer (2005), considered five environmental impact categories: land use, fossil energy use, global warming potential, eutrophication and acidification potential. In a study aimed to compare Dutch conventional and organic dairy production, Thomassen et al. (2008a) applied these same impact categories adding the distinction between on farm and off farm impact for each indicator. In a further study (Thomassen et al., 2009) those indicators have been related to gross value added for Dutch dairy farms. Two more indicators were thus included in the LCA: gross value added per kg FPCM and labour productivity (GVA/labour unit).
Van der Werf et al. (2009) implemented the environmental impact of 47 Brittany dairy farms using the valuation tool EDEN (Evaluation de la Durabilité des ExploitatioNs), which is based on LCA integrated with economic and social categories. Compared to the previous studies on LCA, the authors considered also terrestrial toxicity as impact category of farm practices.
Haas et al., (2001) applied life cycle assessment to compare the environmental impact of intensive, extensified and organic grassland farming in Germany. The indicators set was richer than that of the Dutch studies presented above, for it included also impact of pesticides on animal and human toxicity, biodiversity preservation and animal welfare.
7
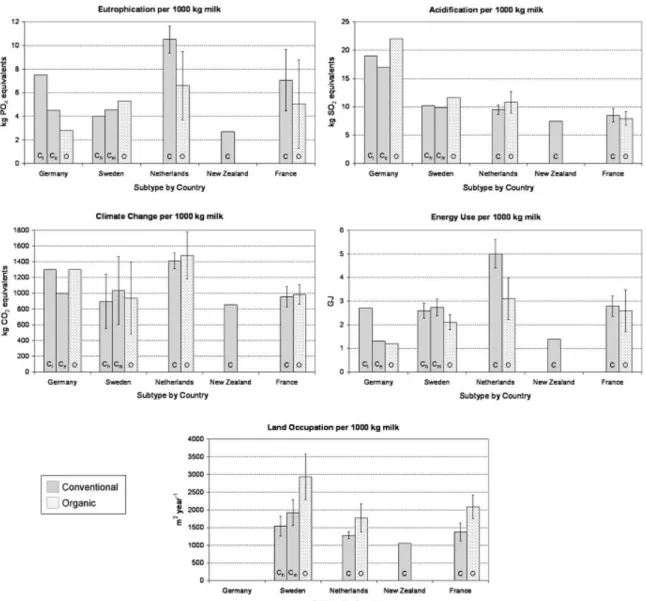
In general, LCA is based on the production period which could change from one farm to the other, as well as the farm’s input production. Figure 3 present a possible graphic comparison of impact categories evaluated through LCA.
Figure 3. Comparison of LCA results applied to conventional and organic dairy farms in five different countries (Germany, Sweden, The Netherlands, New Zealand and France). Bars represent the impact of the farms on the environment, expressed as kg of PO4 equivalents per 1000 kg of milk for eutrophication potential, kg of SO2
equivalents per 1000 kg of milk for acidification potential, kg of CO2 equivalents per 1000 kg of milk for climate
change (or global warming) potential, GJ per 1000 kg of milk for energy use and m2 per year per 1000 kg of milk for land use (source Van der Werf et al., 2009).
2.2.4. Linear Programming model
A LP model was set to determine the effects of possible changes at institutional, technical and market price level on dairy farm management, with regards to nutrient losses leading to environmental pollution and economic performances of the farm (Berentsen and Giesen, 1995). Some environmental indicators were used to evaluate nutrient balance at farm, herd and soil level, NH3 emission, nitrate leaching and phosphate surplus. The proposed economic indicators
8
were milk production, manure spreading costs, costs per animal (health care + breeding + milking energy + interest + animal replacement), housing capacity, feed production, purchase of feed and concentrates, labour costs and fixed costs for machinery.
Van Calker et al. (2004) adapted this existing dairy farm LP model on an experimental Dutch farm to study the effects of environmental policy and management changes on the economic and environmental sustainability of the farm. One economic indicator and seven ecological indicators were applied in the model. In a successive study (Van Calker et al., 2007) the model was completed with social indicators that the authors divided into one internal social or physical health indicator and four external social or societal indicators.
2.2.5. Multicriteria analysis
Pacini et al. (2003) applied an integrated economic-environmental accounting framework to three Central Italy mixed farms, in order to evaluate their financial and environmental sustainability. The first was assessed with a farm gross margin indicator. The second was assessed through an environmental accounting information system. The evaluation is proposed at field, site and farm levels and uses data from a reference period of three years (1998-2000) to compare annual average results of indicators over time.
IDEA (Indicateurs de durabilité des exploitation agricoles, Farm sustainability indicators) is
a method developed by Vilain et al. (2003) for French Agriculture Ministry, that aims at being a self-assessment tool for farmers as well as a pedagogic tool for teacher and students (Guillaumin
et al., 2009). The evaluation of farm performances is based on the three aspects of sustainability,
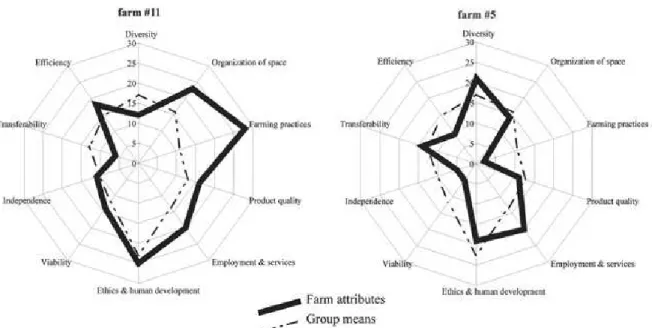
which are referred to as agroecological, socio-territorial and economic, divided into ten criteria and measured by 41 indicators. A particular trait of IDEA is the visualization of the relationship between the indicators and the objectives of sustainability evaluation, realized with the help of a matrix. Indicators are generally composed of different qualitative or quantitative variables. They are calculated using the data available on the farm and the results is translated as score on a ascending scale, where higher scores mean higher sustainability for that criteria. The score of each indicator belonging to a criteria of sustainability is summed together, in order to obtain a single value for that specific criteria, from 0 (minimum score) to 30 (maximum score). These final values are used to build a spider graph on which the ten criteria of sustainability individuated by the method can be compared (Fig.4). This evaluation allows the understanding of the strong aspects of farm management and the weak points towards sustainability.
9
Criteria scores can also be aggregated to obtain one score for the ecological, social and economic aspects. The overall sustainability score is expressed by the lowest of these three scores. The validation of indicators has been carried out for few of them in the form of comparison with other indicators output or expert supervision.
Figure 4. Graphic representation of results obtained with IDEA method. The radars group the ten evaluation criteria and allow to visualize the performances of the farm with regards to each criteria, expressed by the point on the axis, where 30 is the best performance and 0 the worst. The farm’s results (continuous line) are compared with the average results of the group of farms it belongs to (source Zahm et al., 2008).
OTPA - Observatoire Territorial de Pratiques Agricoles (Territorial observatory of farming
practices) was developed thanks to the collaboration of different French actors, among them five agricultural chambers (Rhône Alpes, Centre, Limousine, Poitou-Charentes and Picardie Regions), research institutes such as INRA, CEMAGREF and CIRAD, agricultural institutes (Institute d’Elevage, ARVALIS, IFIP) and the Ministry of Agriculture. This project was aimed at defining indicators in order to evaluate environmental, economic and social sustainability of French farms according to their local territorial context. A list of about 105 indicator forms was produced, in which the calculation method, source, interpretation advices and external references are detailed.
OTPA proposed a list of indicators that could be used to evaluate the sustainability of farms of a particular territorial context. The data are collected on different farms by the technicians and then transferred on software called DAESE (Diagnostic Agri-Environnemental, Social et Economique) to be used for indicators calculation and to be recorded. The results are assembled in a table, which regroups indicators according to farming practices and that expresses their value related to a single campaign, a region or a farming system. To make the results easier to
10
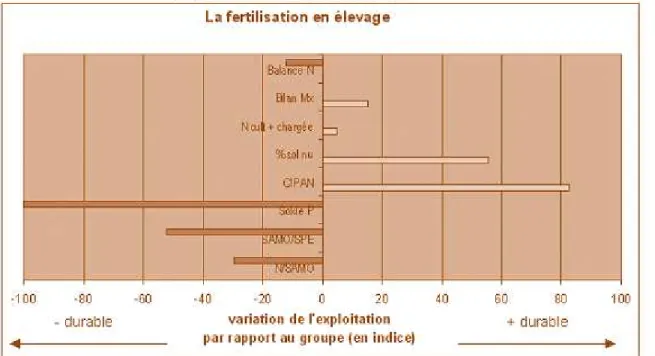
read and understand, an histogram graph for each farming practice is produced (Fig. 5). Each indicator is expressed as a horizontal bar whose value varies from 0 to 100. If the bar is oriented to the right (positive values), it will be assessed as sustainable, the opposite if it is oriented to the left (negative values). The longer the bar, the higher the sustainability or unsustainability of the related indicator. Since the indicators may be expressed by different unit of measurements, before the graph comparison they are translated into average values with respect to the sample of farms. However, at the moment of writing, the authors of the method have not defined an aggregation procedure to obtain a briefer overview of the results yet. Finally the method offers the possibility to pass from the farm to the territory scale, by expressing the results as rate of a territory reference surface (i.e. arable area, intercropped surface, irrigated surface etc.).
Figure 5. OTPA horizontal bar graph used to represent farming practices evaluation results. In this case fertilization in husbandry system. Bars represent the indicators involved in the evaluation (for example N balance, mineral nutrients balance, percentage of bare soil, cover crops, etc.). The length of the bars expresses the placement of the farm with respect of the farm group average (source Guillomin et al., 2007a).
IDEA and OTPA methods refer to the actual situation of the farm at the moment of the evaluation: time references are eventually specified for the required parameters of each indicator (f.i. annual application of organic matter for the indicator “organic matter management” or N and P fertilizer supply as average over two years for the indicator “fertilization” in IDEA).
11
MOTIFS (Monitoring Tool for Integrated Farm Sustainability) is based on a set of 47
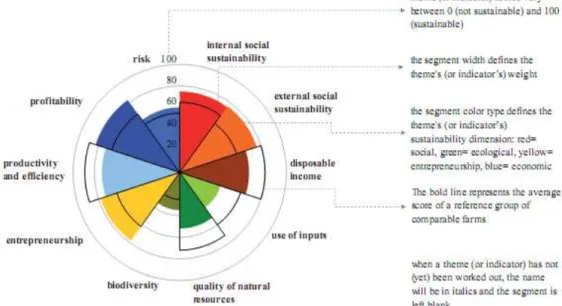
indicators (not all defined and validated) evaluating the three dimensions of sustainability which are equally weighted (Meul et al., 2008). Indicators outputs are rescaled into scores between 0 and 100 in order to compare and aggregate the indicators by weighting. The tool output is visualized as a pie-radar graph (Fig.6) of ten themes of sustainability, where the length of the segment represent the score obtained by the theme, the width defines the theme’s weight, and the color corresponds to the belonging sustainability aspect.
Figure 6. Pie-radar graph used to visualize MOTIFS output and interpretation guidelines (source Meul et al., 2008).
RISE (Response-Inducing Sustainability Evaluation) is a tool to assess sustainability and
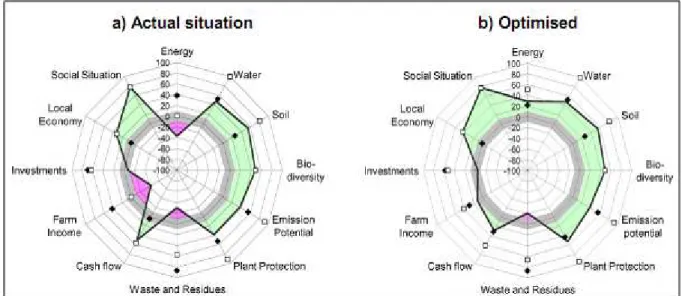
address practices optimization at farm level on yearly base (Hӓni et al., 2003). Each of the twelve aspects is evaluated for its “State” (S) and its pressure on the system’s sustainability (“Driving Force”, D). State of the system and pressure are addressed by one or more factor, resulting in a score between 0 and 100, where 0 is the best score for pressure and 100 the best one for state. The overall “Degree of sustainability” (DS) is calculated as difference between S and D: it is considered as sustainable an aspect with a DS score higher than +10 or a farm with no aspect scoring lower than -10. The DS scores for each aspect are represented on a radar graph (Fig. 7). However, in the review paper it was not presented how to calculated most of the factors to obtain the D and S parameters, neither how to rescale them from 0 to 100. Furthermore a conceptual misleading is produced for the authors call “indicators” what indeed would be “aspects” or criteria of sustainability.
12
Figure 7. Radar graphs visualizing the sustainability degree of a mixed livestock and crop farm evaluated by the tool RISE. Graph a) present the evaluation results of the actual farm management (19 ha; 1,5 Large animal units/ha; 2,5 Full Time Employees (FTE), while graph b present the results for a scenario in which cattle housing is optimised and renewable energy are used for machinery and heating (source Hӓni et al., 2003).
Table 1 summarizes the methods comparison presented above. Columns represent the five methods and in particular each reviewed paper for that method. For LCA only the latest work of Thomassen et al. (2009) is shown, for it completes the indicators proposed in the previous studies. Lines represent the indicators found in the papers. Sustainability criteria are listed in the first column, in order to group together indicators belonging to the same criteria. In the cells of each methods is reported the specific used indicator and, where available, the unit of measurement. This summary does not visualize the actual list of indicators or the indicators “tree” for multi-criteria methods as founded in the peer-review papers: it is an artificial clustering with the objective of allowing a comparison between methods applying similar indicators. For example, land use is implemented as agro-environmental indicator by ecological footprint and two LCA studies, but for IDEA it is considered into the criteria “ethics and human development” of the social pillar.
13
4
GLEAMS: Groundwater Loading Effects of Agricultural Management
5 NO3 -equivalents: NO3 -=1, NOx=1.35, NH3 =3.64 and PO4
-=10.45; CO2 equivalents: CO2=1, N2O=310, CH4=21; SO2 equivalents, where SO2 =1, NOx=0,7 and NH3=1.88; PO4 equivalents:
PO4=1, NH3=0.35, NO3=0.1, NO=0.2, NO2=0.13 and NOx=0.13 6
FPCM: Fat and Protein Corrected Milk
P IL L A R CRITERIA
METHODS Input-Output Accounting Ecological
Footprint LCA (Life cycle assessment)
LP (Linear Programming)
model Multi-criteria analysis
INDICATORS Thomassen and De Boer, 2005 Halberg et al., 2005 Thomasse n and De Boer, 2005 Thomasse n et al., 2009 Haas et al., 2001 Van der Werf et al., 2009 Berentsen and Giesen, 1995 van Calker et al. (2004;2007) IDEA (Vilain, 2003) Pacini et al., 2003 OTPA MOTIFS (Meul et al., 2008) RISE (Hӓni et al., 2003) A G R O -E N V IR O N M E N T A L Nitrate leaching potential (ground water quality) NO3 emission N surplus (kg N/ha farm) N surplus (kg/ha) or N use efficiency (%) N farm gate balance; N leaching potential N potential losses - N denitrificat ion NO3 concentration in groundwater (NO3- mg/l) N losses (GLEAMS)4 N surplus (N input-N output) N surplus; N use efficiency N balance Eutrophication potential (surface water quality) NO3 et NOx emission P surplus (kg P/ha farm) P surplus (kg P/ha farm) kg NO3 eq/ha farm5 or kg NO3 eq/kg FPCM6 N and P surplus as kg PO4 eq/ha (P balance; % drained surface) kg PO4 eq/ha farm or kg PO4 eq/1000 kg FPCM P2O5
surplus kg NO3 eq/ha
P losses (GLEAMS) P surplus (P input-P output) P surplus; P use efficiency P balance NH3 emission PO4
Land use Land use
m2 BPA/kg of FPCM ha/kg FPCM m2/year/ 1000 kg FPCM world population feeding contribution Resources consumption direct and indirect fossil energy use energy use (MJ/ha) or energy efficiency (MJ/kg product) MJ/ha farm or MJ/kg FPCM primary energy use; P and K fertilizers GJ/ha farm or GJ/kg FPCM energy dependence (description missing) energy use (l fuel eq/year) Energy use/ha Global warming potential
CO2 emission CO2
emission (kg CO2/kg product) kg CO2 eq/kg FPCM or kg CO2 eq/ha farm t CO2 eq/ha kg CO2 eq/ha farm or kg CO2 eq/1000 kg FPCM kg CO2 eq/t FPCM t CO2 eq/ha N2O emission CH4 emission Acidification potential NH3 emission NH3 ha farm/year NH3 ha farm/year kg SO2 eq/ha farm or kg SO2 eq/kg FPCM kg SO2 eq/ha kg SO2 eq/ha farm or kg SO2 eq/1000 kg FPCM NH3 from barn and manure spreading kg SO2 eq/ha NOx emission SO2 emission
14
7
HPBI: herbaceous plant biodiversity index; APBI: Arboreous plant biodiversity index; HBI: Hedge biodiversity index; CDI: crop biodiversity index
8 Calculations not presented in the paper 9
PEC: predicted environmental concentrations
Thomassen and De Boer, 2005 Halberg et al., 2005 Thomasse n and De Boer,2005 Thomasse n et al., 2009 Haas et al., 2001
Van der Werf
et al., 2009 Berentsen Giesen,19 95 van Calker et al. (2004;2007) IDEA Pacini et al.,
2003 OTPA MOTIFS RISE
Biodiversity
Wild diversity HPBI
7; APBI % Natura 2000; % E.E. D. of wild species ZEC; plot size Grassland/hedges biodiversity species nb/density- diversity-care grassland, hedges, field margins HBI3 % meadows hedges length; Habitat diversity Crop diversity annual and perennial crops CDI3 nb crops; %
main crop ha Crops used
Animal diversity livestock diversity; genetic conservation Insect biodiversity (no calculation)8 nb of species and races Animals used Farming practices Crop rotation x x Fertilization x x Pesticides use comparison of PEC9 with public standards pesticide application treated surface/total farm surface no calculation4 treatments nb Risk of pesticides use Risk; a.i. quantity Allopathic treatments antibiotics application Treatments per animal/ total herd Soil erosion soil conservation no
calculation4 soil erosion ha
Soil quality Soil salinity; S.O.M. content (no calculation)4 minimum tillage; compaction O.M; P; K content Nutrients content ;com paction Agroecosystem efficiency Energy efficiency Energy, water, minerals, biological resources Kg product/ energy unit Consumption /workforce
water use m3/ha m3/ha
water resources manag. m3/ha Kg product/l water m3/ha Others Heavy metals accumulation Terrestrial toxicity (kg 1,4-DCB eq/ ha or 1000 kg FPCM) Aquatic and terrestrial ecotoxicity Dangerous waste load; livestock load; Waste water contaminat ion risk Waste production disposal
15
10
FTE=full time equivalent; MRI= minimum regional income
P IL L A R CRITERIA
METHODS Input-Output Accounting Ecological
Footprint LCA (Life cycle assessment)
LP (Linear Programming)
model Multi-criteria analysis
INDICATORS Thomassen and De Boer, 2005 Halberg et al., 2005 Thomasse n and De Boer, 2005 Thomasse n et al., 2009 Haas et al., 2001 Van der Werf et al., 2009 Berents en and Giesen, 1995
van Calker et al. (2004;2007) IDEA (Vilain, 2003) Pacini et al., 2003 OTPA MOTIFS (Meul et al., 2008) RISE (Hӓni et al., 2003) E C O N O M IC Farm income Labour profitability Variable and fixed costs
Net farm income
Economic feasibility
Income/ labour
unit Farm income Return of the farm GVA/kg FPCM Farm gross margin x Farm profit/ capital unit Return on assets Economic productivity and efficiency Labour productivity GVA/labo
ur unit x VA/labour unit
Land
productivity VA/land use unit
Capital productivity
Economic
specialization VA/farm capital
Efficiency x Total/optimal production
Farm independence
Financial
self-sufficiency x x
Subsides support x x
Farm continuity transmissibility Economic x x
S O C IA L Working conditions (internal social)
Work intensity Physical load
index (PLI) x x
Professional pride
Farmer emancipation
Life quality x x Disposable
income FTE10 income/MRI Social quality (external social) Hygiene and security Chain food safety index x x Animal welfare Housing system condition Tier GerechtheitsInde x-35L x Parameters of living conditions
Animal health Animal health
index Lesions and diseases rate Landscape value Agricultural nature norm analysis (ANNA) Landscape and patrimony valorization x Nature conservation, elements Social
involvement x x Green care
Services/others
Local market
valorization x x Entrepreneurship Local sales %
Multi-functionality x x Active population occupation x x Local workforce level
16
All the methods presented above are goal-oriented, meaning they aim at defining the sustainability of a farming system with regards to its site specific conditions, as opposed to means-oriented framework whose objective is to define which practices are a priori sustainable (Von Wirén-Lehr, 2001). However, two groups can be distinguished: multi-criteria methods and the single indicators sets (i.e. LCA, IOAs, Ecological footprint and Linear programming). The second group’s methods use “raw” quantitative data as indicators’ output (f.i. kg of CO2 emitted
per ha) to compare different farming situations or systems. Thus the most (or least) sustainable practice is assessed as the least (or most) emitting. In a multicriteria analysis those quantitative data are transformed into scores on a scale (from 1 to 10 for example) in order to aggregate raw data output which differ for measurement unit and calculation.
It emerges here the conceptual difference between multi-criteria methods and indicators set based methods, which is the lack of criteria aggregation for the latter. Aggregation is a fundamental step of multi-criteria evaluation, which is meant to assess the holistic sustainability of a farm. Furthermore it permits to understand the role that each indicator plays on the related criterium. On the contrary, methods based on indicators sets cannot express sustainability as a whole, but only present separated quantitative criteria measurements. Multi-criteria analysis better fits sustainability evaluation than single indicators set, for sustainability is “more than the sum of the parts” (von Wirén-Lehr, 2001).
Another difference between multi-criteria and indicators set methods stands in the number of criteria considered in the evaluation. As one can see from table 1, multi-criteria methods use more criteria and indicators compared to all the other methods, also to those applying an economic and social evaluation such LP model.
Finally multi-criteria methods could be more easily used as decision aid tools because it allows to establish the relation between farming practices and sustainability criteria: on one side, the impacts of a single practice on different criteria could be identified, and on the other side the correlation and complementation of different practices on the same criterium could stand out.
17
3.
Context of the study
The research unit of Mirecourt is part of the SAD11 department (Science for Action and Development) of the national institute for agronomic research INRA (Institute National de la Recherche Agronomique). Together with other five research units, the one of Mirecourt is integrated with an experimental farm. It is part of the ASTER12 project, which stands for ‘AgroSystems, Territory, Environment and Resources’, whose objective is to implement agricultural practices which are compatible with the use and protection of local resources.
Two main research themes are carried out at INRA Mirecourt: « Conception de systèmes techniques agricoles innovants en situation de polyculture-élevage » (conception of innovative agricultural systems in cropping-breeding production ) and « Dynamiques de l’organisation spatiale des activités agricoles dans des territoires à enjeux environnementaux » (spatial organisation dynamics of agricultural activities into environmentally endangered areas). The first one is involved at the farm scale and works on the establishment of innovative production systems which integrate crops and animal breeding. The research is orientated towards sustainable management and evaluation of these particular farming systems. The second is involved at the territory scale in order to identify environmental risks linked to agriculture, especially for water quality, and how to limit the pollution or improve environmental condition through farming practices.
The study presented in this document was carried out in the context of the first theme.
3.1.
The experimental farm of INRA-Mirecourt
The experimental farm of INRA-Mirecourt research unit is devoted to dairy farming research since the 1960s. In 2004 the conversion to organic farming started and was completed in 2006. The objective of the research is to evaluate the technical and managerial performances of production systems on a long term scale (Coquil et al., 2009a). The aim of the experimental farm is to prototype a low input system, sustainable from environmental and agronomic point of view. The economic viability is not considered as a prerequisite of the system because it would inevitably change the environmental and agronomic parameters set to run and study a sustainable farming management.
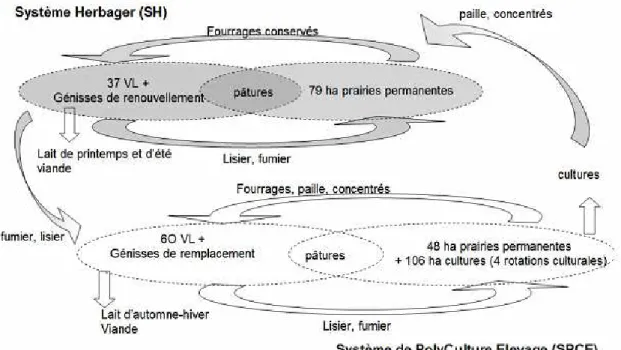
Two dairy systems are present on the experimental farm, one based on grassland (SH) and one based on mixed cereals and grassland (SPCE) (Fig. 8).
11
INRA-SAD (2010): http://www.inra.fr/sciences_action_developpement/
18
Figure 8. Functioning of the two bovine milk systems conducted at the experimental farm of INRA-Mirecourt: a grazing system (SH) and a cropping-breeding system (SPCE) complementary at the local territory scale (source: Coquil et al., 2009b).
The objectives of agro-environmental sustainability of the experimental farm accomplish three main criteria: abiotic resources preservation (water, air, fossil energy, soil fertility), biotic resources conservation (animal and vegetal biodiversity) and efficiency of farm production (crops and dairy production). The practices and agronomic choices are implemented in order to comply with those objectives and the organic farming rules: rotations and mechanical weeding play an important role since no pesticides are applied. The organization of soil labour, usually implemented before the seeding of spring cereals which were preceded by a winter cover or after the three years of temporary meadows/alfalfa, influences organic matter mineralization and fossil fuel consumption. The use of mixed cropping, cover crops, leguminous crops and meadows contribute to different aspects: soil fertility and nitrogen fixation, weed management, pest and disease control, but also to biodiversity in terms of crops and varieties number and favoring useful insects such as pollinators. With regards to production, the farm aims at being self-sufficient through the optimization of resource available on the farm surface and the off-setting of the two systems. The implementation of a low input system requires in fact as much autonomy from external input as possible and high complementarities at local territory scale This is obtained by regulating the feed and straw production on one side and organizing the milking period of the two herds over the all year as far as possible. Furthermore, the autonomy in straw utilization is very important in organic breeding in order to provide litter for the stable, on one hand to assure good housing for animals, as required by the European Regulation (Leroux et al.,
19
2009), and on the other hand to obtain a stabilized manure. The crops-grazing system SPCE assures the availability of concentrate feed and litter straw for the two systems, while the grazing system SH complements the uptake from the first system with manure, closing the nutrient cycle (Blouet and Coquil, 2009).
The structure and organization of the two breeding systems of the experimental farm of Mirecourt depend on all the factors and interactions described above, to which other requirements for land use load and animal welfare has to be added. Although sold milk and wheat constitute a monetary revenue for the farm, economic viability is not a target of the experimentation. The objective is in fact to verify if such an autonomous system could be managed at the farm and local territory level: if it provides a benefit for the environment and resource preservation, then a potential economic support from the future policies could be justified.
3.2.
Background for a multi-criteria evaluation
The setting-up and the management of a self-sufficient dairy farming system need to be verified in their effectiveness and impact on the territory. It is in this context that a multi-criteria analysis was developed to evaluate the two dairy systems implemented at INRA-Mirecourt. This evaluation aims at defining to which extent the set objectives are accomplished with regards to agro-environmental sustainability, in order to propose a valid model of sustainable dairy farming. In the past few years two studies have been conducted to propose a model for ex-ante evaluation of agro-environmental sustainability of the grazing system SH (Gerber et al., 2009) and of the cropping-breeding system SPCE (Garnier, 2009). These two works used the tool Dexi, an integrated rule-based model that allows the sustainability assessment of an activity through the establishment of a tree where sustainability criteria are aggregated, weighted and attributed with qualitative classes (Bohanec et al., 2004). The Dexi-SH model aggregates sixteen indicators and seven expertise criteria, while Dexi-SPCE model aggregates about forty criteria, most of them yet to be completed, and twenty indicators derived from different available methods.
3.3.
Objectives of agro-environmental sustainability
The present work aims at evaluating ex-post the agro-environmental sustainability of the two dairy systems of INRA-Mirecourt, using the criteria and indicators proposed in the Dexi-SPCE model. The evaluation tree proposed in this model is based on three main aspects, corresponding to the objectives of the experimental farm: abiotic resources preservation, biotic resources conservation and agro-ecosystem efficiency. The present work will develop the evaluation of the first aspect. The two latter aspects could not be investigated due to time restriction.
20
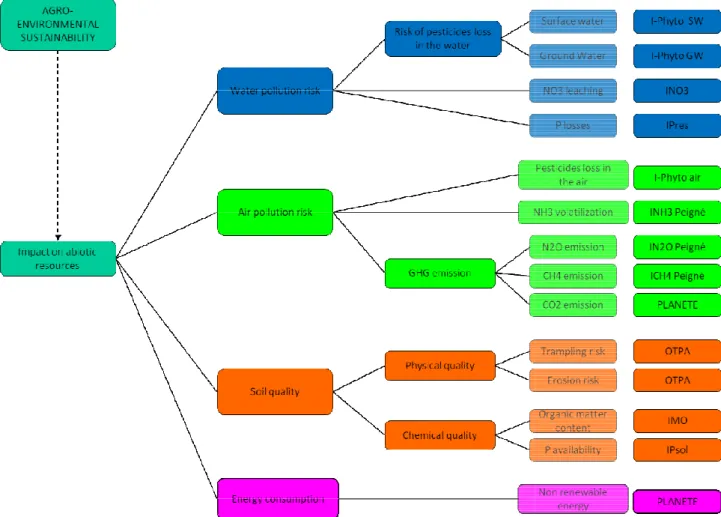
With regards to abiotic resources preservation, the Dexi-SPCE model proposed to evaluate the impact of farming practices on the water, the air, soil and fossil energy consumption (Fig. 9). Each one of these main criteria is assessed by one or more level of sub-criteria: water quality is disaggregated into groundwater, which could be affected by pesticides residues and nitrate leaching, and surface water, affected by pesticides and allopathic treatments residues and eutrophication by phosphate. Air quality is affected by pesticides emissions, acidification potential due to ammoniac emissions from crops and animals, and global warming potential influenced by greenhouse gases emission and carbon storage in the soil. Soil quality is assessed as aggregation of physical quality, linked to compaction and erosion risk, and soil fertility, depending on organic matter content and phosphorus availability in the soil. Finally, the consumption of fossil energy is determined by the direct energy use and the indirect use due to mineral fertilizers.
The lowest level criteria in the tree could be evaluated through the use of indicators, which were proposed for most of criteria in the Dexi-SPCE model.
The investigation of those indicators is the starting point for this work, whose procedure to evaluate the impact of farming practices on abiotic resources is presented in the next chapter.
Figure 9. Dexi-SPCE tree for the evaluation of the impact of the farming systems on the agro-environmental sustainability aspect “abiotic resources preservation” (source: Garnier, 2009).