HAL Id: tel-01153235
https://tel.archives-ouvertes.fr/tel-01153235
Submitted on 19 May 2015
HAL is a multi-disciplinary open access
archive for the deposit and dissemination of sci-entific research documents, whether they are pub-lished or not. The documents may come from teaching and research institutions in France or abroad, or from public or private research centers.
L’archive ouverte pluridisciplinaire HAL, est destinée au dépôt et à la diffusion de documents scientifiques de niveau recherche, publiés ou non, émanant des établissements d’enseignement et de recherche français ou étrangers, des laboratoires publics ou privés.
Tribological analysis of White Etching Crack (WEC)
failures in rolling element bearings
Arnaud Ruellan Du Créhu
To cite this version:
Arnaud Ruellan Du Créhu. Tribological analysis of White Etching Crack (WEC) failures in rolling element bearings. Mechanics of materials [physics.class-ph]. INSA de Lyon, 2014. English. �NNT : 2014ISAL0116�. �tel-01153235�
N° d’ordre 2014ISAL0116 Année 2014
Thèse
Tribological analysis of White Etching Crack (WEC)
failures in Rolling Element Bearings
Présentée devant
L’Institut National des Sciences Appliquées de Lyon
Ecole doctorale des Sciences pour l’Ingénieur de Lyon: Mécanique, Energétique, Génie Civil, Acoustique (MEGA)Spécialité : Mécanique
Pour obtenir
Le grade de docteur
Par
Arnaud RUELLAN Du CREHU
Ingénieur INSA LyonThèse soutenue le 05 Décembre 2014 devant la commission d’examen composée de : Pr. Michel FILLON Université de Poitiers (France) - Institut Pprime Président du jury
Pr. Motohiro KANETA Université de Brno (République Tchèque) Membre invité
Pr. Xavier KLEBER INSA Lyon (France) - MATEIS Directeur de thèse
M. Bernard LIATARD NTN-SNR – Annecy (France) Encadrant industriel
Pr. Gerhard POLL Université de Hannovre (Germany) - IMKT Rapporteur
Pr. Jorge SEABRA Université de Porto (Portugal) - INEGI Rapporteur
Pr. Fabrice VILLE INSA Lyon (France) - LaMCoS Directeur de thèse
Cette thèse a été préparée au Laboratoire de Mécanique des Contacts et des Structures (LaMCoS) et au laboratoire Matériau Ingénierie et Sciences (MATEIS) de l’INSA de Lyon, en
INSA Direction de la Recherche - Ecoles Doctorales – Quinquennal 2011-2015
SIGLE ECOLE DOCTORALE NOM ET COORDONNEES DU RESPONSABLE CHIMIE CHIMIE DE LYON
http://www.edchimie-lyon.fr
Sec : Renée EL MELHEM Bat Blaise Pascal 3e etage
04 72 43 80 46 Insa : R. GOURDON
M. Jean Marc LANCELIN
Université de Lyon – Collège Doctoral Bât ESCPE 43 bd du 11 novembre 1918 69622 VILLEURBANNE Cedex Tél : 04.72.43 13 95 [email protected] E.E.A. ELECTRONIQUE, ELECTROTECHNIQUE, AUTOMATIQUE http://edeea.ec-lyon.fr Sec : M.C. HAVGOUDOUKIAN [email protected] M. Gérard SCORLETTI
Ecole Centrale de Lyon 36 avenue Guy de Collongue 69134 ECULLY
Tél : 04.72.18 60.97 Fax : 04 78 43 37 17
E2M2 EVOLUTION, ECOSYSTEME, MICROBIOLOGIE, MODELISATION
http://e2m2.universite-lyon.fr
Sec : Safia AIT CHALAL Bat Darwin - UCB Lyon 1 04.72.43.28.91
Insa : H. CHARLES
Mme Gudrun BORNETTE
CNRS UMR 5023 LEHNA Université Claude Bernard Lyon 1 Bât Forel
43 bd du 11 novembre 1918 69622 VILLEURBANNE Cédex Tél : 06.07.53.89.13
e2m2@ univ-lyon1.fr
EDISS INTERDISCIPLINAIRE SCIENCES-SANTE
http://www.ediss-lyon.fr
Sec : Safia AIT CHALAL Hôpital Louis Pradel - Bron 04 72 68 49 09
Insa : M. LAGARDE
Mme Emmanuelle CANET-SOULAS
INSERM U1060, CarMeN lab, Univ. Lyon 1 Bâtiment IMBL
11 avenue Jean Capelle INSA de Lyon 696621 Villeurbanne Tél : 04.72.68.49.09 Fax :04 72 68 49 16 [email protected] INFOMATHS INFORMATIQUE ET MATHEMATIQUES http://infomaths.univ-lyon1.fr
Sec :Renée EL MELHEM Bat Blaise Pascal 3e etage
Mme Sylvie CALABRETTO
LIRIS – INSA de Lyon Bat Blaise Pascal 7 avenue Jean Capelle
69622 VILLEURBANNE Cedex Tél : 04.72. 43. 80. 46 Fax 04 72 43 16 87
Matériaux MATERIAUX DE LYON
http://ed34.universite-lyon.fr
Sec : M. LABOUNE PM : 71.70 –Fax : 87.12 Bat. Saint Exupéry
M. Jean-Yves BUFFIERE
INSA de Lyon MATEIS
Bâtiment Saint Exupéry 7 avenue Jean Capelle
69621 VILLEURBANNE Cedex Tél : 04.72.43 83 18 Fax 04 72 43 85 28
MEGA MECANIQUE, ENERGETIQUE, GENIE CIVIL, ACOUSTIQUE MECANIQUE, ENERGETIQUE, GENIE CIVIL, ACOUSTIQUE
http://mega.universite-lyon.fr
Sec : M. LABOUNE PM : 71.70 –Fax : 87.12 Bat. Saint Exupéry
M. Philippe BOISSE
INSA de Lyon Laboratoire LAMCOS Bâtiment Jacquard 25 bis avenue Jean Capelle 69621 VILLEURBANNE Cedex Tél :04.72 .43.71.70 Fax : 04 72 43 72 37
ScSo ScSo*
http://recherche.univ-lyon2.fr/scso/
Sec : Viviane POLSINELLI Brigitte DUBOIS Insa : J.Y. TOUSSAINT
Mme Isabelle VON BUELTZINGLOEWEN
Université Lyon 2 86 rue Pasteur 69365 LYON Cedex 07
Tél : 04.78.77.23.86 Fax : 04.37.28.04.48
Il est souvent nécessaire d’entreprendre pour espérer et de persévérer pour réussir. Gilbert Cesbron
&
Perseverance is not a long race, it is many short races one after the other. Walter Elliot
Foreword
The work results from a close collaboration between the laboratory of Contact and Structure Mechanics (LaMCoS) of INSA Lyon (France), the laboratory MATEriaux: Ingénierie et Sciences (MATEIS) of INSA Lyon (France), and the bearing company NTN-SNR.
The PhD took place in the doctoral school MEGA (Mechanics, Energetics, Civil Engineering, Acoustics), and has been funded by the National Agency for Research and Technology (ANRT) through an Industrial Research Convention (CIFRE) grant number 2011/1336.
PhD supervisors LaMCoS MATEIS Fabrice VILLE Xavier XLEBER
_________________________________________________________________________
Member of the jury University of Poitiers (France) University of Brno (Czech Republic) Michel FILLON Motohiro KANETA _________________________________________________________________________
Reviewers University of Hannover (Germany) University of Porto (Portugal) Gerhard POLL Jorge SEABRA
_________________________________________________________________________
LaMCoS Director David DUREISSEIX
Head of the SMC* team Philippe VELEX
_________________________________________________________________________
MATEIS Director Head of the Metal team Jérôme CHEVALIER Eric MAIRE _________________________________________________________________________
INSA Lyon Director Director of Research Eric MAURINCOMME Jean-François GERARD _________________________________________________________________________
MEGA doctoral school Director Philippe BOISSE
_________________________________________________________________________
NTN-SNR Chairman of the Managing Board
Didier SEPULCHRE DE CONDE
Director of Industry Business Unit Hervé BRELAUD Head of Technologies & Innovation Bernard LIATARD
Acknowledgements
As this research project results from a rich collaboration between the different aforementioned industrial and academic partners, I would like to express my profound gratitude to all the aforementioned directors and heads of division of each entity for giving me the opportunity to lead such an interesting project in two internationally reputed laboratories, LaMCoS and MATEIS, with the full support of the bearing manufacturer NTN-SNR. I also would like to acknowledge and sincerely thank all participants that have steered and contributed to this research project.
Members of the jury
– Pr. Michel Fillon (for accepting to be president of the jury);
– Pr. Gerhard Poll and Pr. Jorge Seabra (for reviewing thoroughly this thesis and for all the interesting discussion we have had on the topic);
– Pr. Motohiro Kaneta (for his interest in the presented work, for his advice and for accepting to be member of the jury);
– Pr. Fabrice Ville and Pr. Xavier Kleber (for their scientific and human incommensurable and generous support as PhD supervisors as well as for the autonomy and opportunities they have trustfully given me).
– Bernard Liatard (for his constant support to this research project at NTN-SNR as well as for all the opportunities he has given me);
LaMCoS and MATEIS
– Pr. Beneybka Bou-Saïd (for all the opportunities suggesting me to go on with a PhD); – Jérôme Cavoret (for all the measurements and discussions on many various topics); – Vincent Baudin (for all the help on the Twin-Disc Machine);
– Dr. Aurélien Saulot (for the access to the LaMCoS SEM);
– Dr. Claude Duret (for the hydrogen charging protocol and chemistry teaching); – Sophie De Oliveira (for all the support regarding conferences and trips to Annecy); – All PhD students and co-workers for all their help, for all the great time spent together,
for all the extras after work and smiles: Pierre R., Marion L., Mathieu C., Jérôme D., Charlotte M., Guillaume C., Jérôme R., Rudy C., Nina S., Vincent S., Jean-David W., Nicolas W., Marine M., Davide T., Jacopo B, Sandrine L., Jean-Philippe N., Serge P., Komla K., Eymard K., Grégoire I., etc.
NTN-SNR
– Aurélien Arnaudon (for the supervision and help during the first half of the project); – Cédric Burnet (for the supervision and help during the second half of the project); – Dr. Daniel Girodin (for his expertise, his advice and all the interesting discussions); – Frédéric Gelloz (for the openings on the wind turbine market)
– Christine Sidoroff (for all the help on metallographic and material aspects) – Renaud Moreau (for Sharclab® and all the extras);
– Jean-Marc Favre (for his expertise on bearing failures); – Audrey Bornes (for chemical analyses on lubricants)
– Frederic Chappeluz and Gilles Saccani (for the help on NTN-SNR test rigs)
And finally, thank you, reader, for the time spent reading, discussing, contesting and or continuing this study; or in other words, thank you for making this thesis lively and worth to be written.
To Pépère, To my friends, you all know who you are, To my family, Maman, Papa, Nicolas and Thomas, And to my beloved wife Florence.
Abstract
Abstract
Tribological analysis of White Etching Crack (WEC)
failures in Rolling Element Bearings
Despite constant expansion and engineering progress, wind turbines still present unexpected failures of heavy duty mechanical components drastically affecting the cost of energy. Among the most prevalent tribological failures in wind turbine rolling element bearings, a peculiar rolling contact fatigue mode has been associated to broad subsurface three-dimensional branching crack networks bordered by white etching microstructure, and thus named White Etching Cracks (WEC). Compared to conventional microstructural alterations, WECs tend to develop at moderate loads and cycles eventually leading to premature failures that remain unpredictable using fatigue life estimations. Far from being generic to specific manufacturers, WECs occur in various industrial applications, for various bearing types, components, lubricants, steels grades and heat treatments. As WEC occurrences present no common evident denominator, they remain delicate to reproduce on laboratory test rigs without prior artificial hydrogen charging, so that no consensus on WEC formation mechanisms have been confirmed yet.
In this study, a thorough tribological analysis of WEC formation mechanisms has been led. Expertise protocols have been established to best reveal and observe WECs that commonly develop at unconventional locations versus the contact area. First analysis of WEC reproductions on standard rolling element bearings either hydrogen precharged or kept neutral have signified that artificial hydrogen charging, commonly employed to apprehend the failure mode, results in similar WEC morphologies but tends to alter WEC tribological initiation.
In consequence, WEC reproductions in remarkably different configurations but without hydrogen charging have been compared in order to propose a better understanding of WEC surface-affected formation mechanisms: first, initiation via tribochemical hydrogen permeation at nascent steel surfaces formed either directly at the raceway or at surface microcracks flanks and second, propagation by local hydrogen embrittlement at crack tips function of the stress state.
An extensive root cause analysis have then been led suggesting that WEC may be associated to various combinations of macroscopic operating conditions that often interact and come down to similar tribological parameters including high sliding energy thresholds, specific lubricant formulations and tribochemical drivers such as water contamination and/or electrical potentials. Further investigations on a minimalist twin-disc fatigue tribometer have provided additional evidence that WEC influent drivers are non-self-sufficient, supporting that WEC formation mechanisms rely on a subtle equilibrium between material, mechanical and tribo-chemical drivers that all should be mastered to design efficient and durable countermeasures.
Keywords: Wind turbines, Rolling Element Bearings, Rolling Contact Fatigue, White Etching Cracks, Tribochemical drivers, Root cause analysis, Hydrogen embrittlement, Twin-Disc Machine
Résumé
Résumé
Analyse tribologique des défaillances de roulements par
fatigue de contact de type White Etching Cracks (WEC)
Malgré les innovations technologiques et une expansion fulgurante, le marché de l’énergie éolienne reste sujet à des défaillances prématurées de composants mécaniques imposants, ayant alors des conséquences considérables sur le coût de l’énergie. Parmi les défaillances tribologiques majeures au sein des roulements d’éoliennes, un mode de fatigue de contact atypique se caractérise par de vastes réseaux de fissures ramifiées avec des phases microstructurales adjacentes d’apparence blanche à l’origine de la dénomination White Etching Cracks (WEC).
Contrairement à la fatigue de contact classique, les WEC apparaissent pour un nombre de cycles et des charges relativement faibles, menant à une défaillance du composant imprévisible selon les modèles de durée de vie actuels. Les WEC ont été observés chez tous les roulementiers, dans diverses applications industrielles et pour différents types de roulements, éléments, lubrifiants, aciers et traitements thermiques. Ce manque de dénominateur commun rend les WEC difficilement reproductibles sur bancs d’essais sans avoir recours au chargement artificiel en hydrogène de l’acier. Ainsi, pour le moment, la formation des WEC ne fait pas l’objet d’un consensus.
Une analyse approfondie des reproductions de WEC a alors été menée afin d’en comprendre les mécanismes tribologiques. Des protocoles expérimentaux ont été établis pour révéler les WEC, souvent situés à des positions inhabituelles par rapport au contact. Leur reproduction sur des roulements standards, chargés ou non en hydrogène, a permis de démontrer que le chargement artificiel en hydrogène, jusque-là couramment employé pour étudier la défaillance, reproduit des faciès identiques mais semble modifier l’initiation des WEC.
Par conséquent, des reproductions de WEC sans chargement en hydrogène et dans des configurations différentes ont été comparées afin d’appréhender les phénomènes tribologiques à l’origine des WEC. Les résultats suggèrent que l’initiation est principalement déclenchée par des phénomènes de surfaces avec l’absorption tribochimique d’hydrogène au niveau des surfaces métalliques fraîches sur la piste de roulement ou au niveau des flancs de microfissures superficielles. La propagation est ensuite assistée chimiquement par l’hydrogène concentré en pointe de fissure.
Un arbre des causes étendu construit progressivement révèle que les WEC peuvent être associées à de multiples combinaisons de conditions opératoires qui semblent cependant conduire à des paramètres tribologiques similaires à l’échelle du contact avec, notamment, de fortes cinématiques de glissement, des formulations de lubrifiants spécifiques et des paramètres tribochimiques catalyseurs comme la présence d’eau et/ou d’électricité. Une vaste campagne d’essai a alors été conduite sur un tribomètre bi-disques afin de simuler la fatigue de contact. Les résultats confirment que les facteurs influents identifiés ne sont pas pour autant auto-suffisants. La formation des WEC repose sur un équilibre instable entre aspects matériaux, mécaniques et tribochimiques, à maitriser pour concevoir des solutions industrielles efficaces et durables.
Mots clé: Eolienne, Roulements, Fatigue de contact, White Etching Cracks, Analyse de défaillance, Tribochimie, Fragilisation par hydrogène, Machine Bi-Disques
Table of content
Table of content
FOREWORD 7 ACKNOWLEDGEMENTS 9 ABSTRACT 13 RÉSUMÉ 15 TABLE OF CONTENT 17 LIST OF FIGURES 21 LIST OF TABLES 29 NOTATIONS 31 ABBREVIATIONS 33 GENERAL INTRODUCTION 35THE WIND TURBINE MARKET EXPANSION 37
THE WIND TURBINE COST OF ENERGY AFFECTED BY UNEXPECTED FAILURES 40
AIMS AND OUTLINE OF THE PRESENT WORK 42
THESIS FLOW CHART 44
CHAPTER 1:WHITE ETCHING CRACKS CHARACTERIZATION AS FATIGUE IN ROLLING ELEMENT BEARINGS 47
1.1 ROLLING ELEMENT BEARING FUNDAMENTALS 51
1.1.1 WHAT ARE ROLLING ELEMENT BEARINGS? 51
1.1.2 WIND TURBINE BEARINGS BEYOND HISTORICAL KNOW-HOWS 56
1.2 ROLLING ELEMENT BEARING TRIBOLOGY 57
1.2.1 CONTACT STRESSES 58
1.2.2 CONTACT KINEMATICS 65
1.2.3 CONTACT LUBRICATION 68
1.2.4 CONTACT FRICTION 74
1.2.5 WIND TURBINE BEARINGS TRIBOLOGY 76
1.3 ROLLING ELEMENT BEARING FAILURES 79
1.3.1 SURFACE DISTRESS AND WEAR 81
1.3.2 ROLLING CONTACT FATIGUE 85
1.3.3 BEARING LIFE ASSESSMENT 91
1.3.4 WIND TURBINE BEARING UNEXPECTED FAILURES 96
1.4 WHITE ETCHING CRACKS (WEC) 99
1.4.1 WEC DEFINITION 99
1.4.2 WEC CHARACTERIZATION 101
1.4.3 WEC OCCURRENCES 103
1.5 CLOSURE TO THE STATE OF ART 105
1.5.1 WEC: UNCONVENTIONAL FATIGUE FAILURE MODE 105
1.5.2 WEC: AN APPARENT CHEMICAL EMBRITTLEMENT NOT YET FULLY UNDERSTOOD 106
Table of content
18
CHAPTER 2:METHODOLOGY AND EXPERIMENTAL PROCEDURES TO STUDY WHITE ETCHING CRACK 107
2.1 OVERALL METHODOLOGY 111
2.2 FULL BEARING RCF TESTING ON A MACHINE S ENDURANCE BENCH 112
2.2.1 MACHINE S OPERATING CONDITIONS 112
2.2.2 ACBB TESTED BEARINGS 113
2.3 TRIBOLOGICAL RCF TESTING ON A TWIN-DISC MACHINE (TDM) 116
2.3.1 MACHINE AND TYPICAL OPERATING CONDITIONS 116
2.3.2 TESTED SPECIMENS 118
2.3.3 LUBRICANTS 119
2.3.4 SPECIFIC PROCEDURES 120
2.4 ANALYSIS AND CHARACTERIZATION PROTOCOLS 125
2.4.1 SURFACE ANALYSIS 126
2.4.2 PROCEDURES TO REVEAL WHITE ETCHING CRACKS 128
2.5 CLOSURE 133
CHAPTER 3:THE EFFECT OF ARTIFICIAL HYDROGEN CHARGING ON WHITE ETCHING CRACK REPRODUCTION 135 3.1 WEC REPRODUCTION ON NEUTRAL AND HYDROGENATED SPECIMENS 139
3.1.1 ARTIFICIAL HYDROGEN CHARGING 139
3.1.2 OPERATING CONDITIONS 141
3.1.3 RESULTS:WEC ASSOCIATED PREMATURE FAILURES 142
3.2 WEC ANALYSES ON NEUTRAL AND HYDROGENATED SPECIMENS 144
3.2.1 SIMILAR WEC PROPAGATION ASPECTS 144
3.2.2 DIFFERENT WEC LOCATION VERSUS THE CONTACT AREA 148
3.2.3 DIFFERENT WEC LAYOUT VERSUS THE RACEWAY 149
3.3 HYDROGEN CHARGING EFFECT ON WEC INITIATION 151
3.3.1 HYDROGEN EMBRITTLEMENT THEORIES 151
3.3.2 WEC INITIATION CONJECTURE FOR HYDROGEN PRECHARGED SPECIMENS 152
3.3.3 WEC INITIATION DIFFERENT FOR NEUTRAL SPECIMENS 152
3.4 CLOSURE 154
3.4.1 WEC DELICATE OBSERVATIONS IN UNSPALLED SPECIMENS 155
3.4.2 HYDROGEN CHARGING EASES WEC PROPAGATION BUT ALTERS INITIATION 155
3.4.3 OBJECTIVES OF THE FOLLOWING CHAPTERS 156
CHAPTER 4:WHITE ETCHING CRACK REPRODUCTIONS AND FORMATION MECHANISMS 157
4.1 WEC REPRODUCTION WITHOUT HYDROGEN CHARGING 160
4.1.1 LITERATURE:RCF TESTS ON CYLINDRICAL ROLLER THRUST BEARINGS 160
4.1.2 IN-HOUSE:RCF TEST VARIANTS ON RADIAL ANGULAR CONTACT BALL BEARING 162
4.2 ANALYSES AND COMPARISON OF WEC ON BOTH TEST RIGS 168
4.2.1 DIFFERENT OVERALL BEARING CONFIGURATION 170
4.2.2 SPECIFIC BEARING LUBRICATION 170
4.2.3 SIMILAR INTERNAL SLIPPAGE KINEMATICS 172
4.2.4 SIMILAR INCIPIENT WEAR AND POOR TRIBOFILM 174
Table of content
4.3 WEC FORMATION MECHANISMS CONJECTURES 175
4.3.1 SURFACE AFFECTED INITIATION THROUGH NASCENT STEEL 176
4.3.2 HYDROGEN PERMEATION AT NASCENT SURFACE 178
4.3.3 SUBSURFACE PROPAGATION BY LOCAL HYDROGEN EMBRITTLEMENT 181
4.4 CLOSURE 183
4.4.1 A SURFACE AFFECTED TRIBOCHEMICAL CRACKING FAILURE MODE 183
4.4.2 WEC INITIATION AND PROPAGATION MECHANISMS 183
4.4.3 OBJECTIVES OF THE FOLLOWING CHAPTER 184
CHAPTER 5:WHITE ETCHING CRACKS INFLUENT DRIVERS AND TWIN-DISC MACHINE INVESTIGATIONS 185 5.1 WEC DRIVERS MANIFOLD AND RESPECTIVE TRIBOLOGICAL INFLUENCES 189
5.1.1 OVERVIEW OF WEC INFLUENT DRIVERS FROM TRIBO TO MACRO-SCALES 189
5.1.2 FOCUS ON MAIN WEC TRIBOLOGICAL DRIVERS 193
5.2 TRIBOLOGICAL TRANSPOSITION ON THE TWIN-DISC MACHINE 202
5.2.1 EXPERIMENTAL APPROACH 202
5.2.2 WEC INITIATION THROUGH MICRO-CRACKS 204
5.2.3 WEC PROPAGATION ATTEMPTS WITH VARIOUS DRIVERS 208
5.2.4 RESULTS AND REPRESENTATIVENESS OF THE TWIN-DISC MACHINE 213
5.3 CLOSURE 214
5.3.1 WEC MULTIPLE INFLUENT DRIVERS AT MACRO-SCALES 214
5.3.2 WEC MAIN DRIVERS AT TRIBO-SCALES 214
5.3.3 WEC MULTIPLE NON-SELF-SUFFICIENT 215
GENERAL CONCLUSION 217 A. GENERAL OUTCOMES 219 B. INDUSTRIAL COUNTERMEASURES 221 C. PERSPECTIVES 222 REFERENCES 223 APPENDIX 241 A. CONTACT THEORY 241
B. TYPE OF LUBRICANT AND FORMULATION 243
C. FITTING STRESS ESTIMATIONS 245
D. ACBBRCF TESTS 246
E. RESIDUAL STRESS ASSESSMENT 248
F. STEEL CLEANLINESS DATA 248
G. CONTACT KINEMATICS AND CRITERIA 249
H. TDMRCF TESTS 252
I. PROBABLE WIND TURBINE INFLUENT DRIVERS 255
J. IDENTIFIED ACBB AND CRTB INFLUENT DRIVERS 256
K. MULTIPLE CONSEQUENCES OF LUBRICANT ADDITIVE FORMULATION 257
L. MULTIPLE DRIVERS AND CONSEQUENCES OF SLIDING KINEMATICS 258
M. ADDITIONAL NTN-SNRRCF TESTS WITH WEC OCCURRENCES 259
RÉSUMÉ ÉTENDU EN FRANÇAIS 261
Table of content
20
B. CARACTERISATION DES WHITE ETCHING CRACKS (WEC) 263
C. EFFET DU CHARGEMENT EN HYDROGENE SUR L’INITIATION DES WEC 267
D. REPRODUCTIONS ET MECANISMES DE FORMATION DES WEC 270
E. FACTEURS INFLUENTS ET INVESTIGATIONS SUR MACHINE BI-DISQUE 274
F. CONCLUSIONS ET PERSPECTIVES 278
List of figures
List of figures
Figure 1: Worldwide population and electricity generation, highlighting the limited but developing wind energy
(numerical data from [1]). ... 37
Figure 2: Public acceptance of wind and nuclear energy (poll from 2010 on 6255 adults aged 16-64 equally
distributed among the U.S.A, U.K, France, Spain, Italy and Germany [2]). ... 38
Figure 3: Zoom on the worldwide ratio of wind turbine electricity generation versus total generation from Figure 1 (numerical data from [1]). ... 38 Figure 4: Typical horizontal axis MW wind turbine structure at the top of the tower (courtesy of ZF
transmission, www.zf.com); (b) AREVA M5000 5 MW wind turbine maintenance [3]. ... 39
Figure 5: Wind turbine (a) annual and (b) cumulative worldwide nominal power installed power in MW [4]. ... 39 Figure 6: Summary of the wind turbines’ expansion in the past decades [5]. ... 40 Figure 7: (a) (b) Wind turbine failures distribution in 2009 and the impact on the O&M costs [5]; (c) typical wind
turbine failure rate evolution in time with premature failures; (d) wind turbine drivetrain handling. ... 41
Figure 8: (a) Multi-MW wind turbine gearbox layout and size compared to a human head; (b) Example of wind
turbine REB fatigue failure [7] associated to (c) the formation of White Etching Cracks (WEC) [7]. ... 42
Figure 9: Main objective layout of the project. ... 43 Figure 10: General thesis flow chart. ... 45
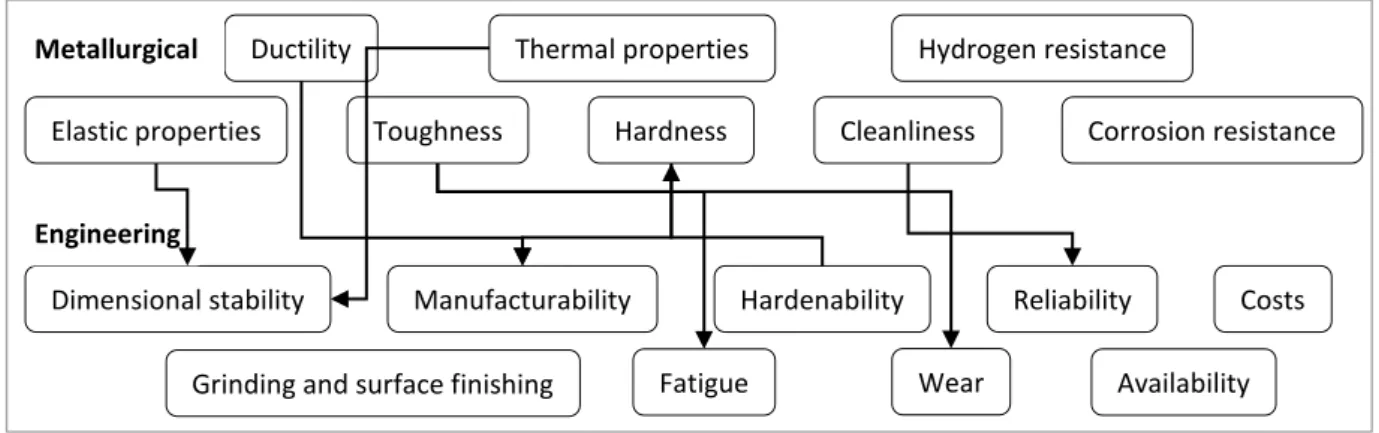
Fig. 1.1: Rolling Element Bearing (REB) typical structure, components and speeds (courtesy of SKF). ... 51 Fig. 1.2: Typical examples of REB types (courtesy of SKF). ... 52 Fig. 1.3: Typical metallurgical and engineering properties required for bearing steels and examples of
interdependencies ... 52
Fig. 1.4: (a) SEM image of a manganese sulfide (MnS) inclusion and (b) optical micrograph of another MnS
emerging inclusions both found in a 100Cr6 D2 specimen. ... 55
Fig. 1.5: Main steps of the REB ring manufacturing process (courtesy of NTN-SNR). ... 56 Fig. 1.6: Overview of REB arrangements in a typical MW wind turbine. ... 57 Fig. 1.7: Schematic overview of a tribological contact in a REB considering both tribomechanical and
tribochemical parameters affecting the life time before surface or subsurface failure. ... 58
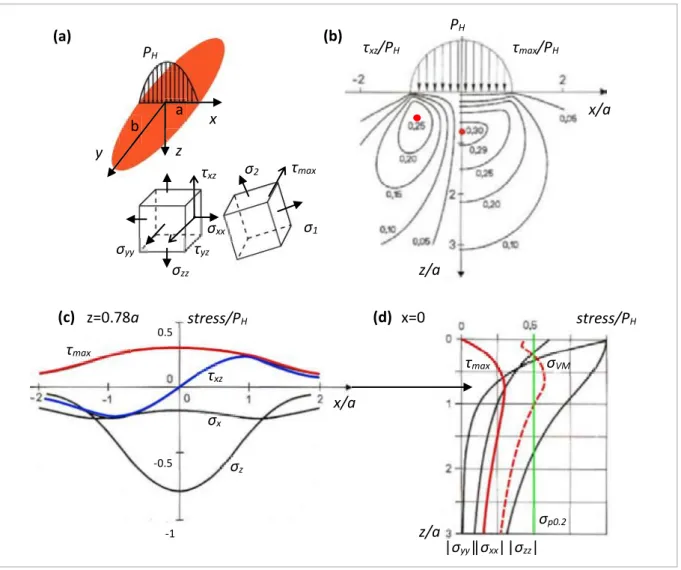
Fig. 1.8: Typical equivalent contact geometry of a raceway (1) – ball (2) elliptical contact. ... 59 Fig. 1.9: (a) Infinitesimal orthogonal stresses and principal stresses beneath a hertzian contact; (b) Contours of
the orthogonal shear stress τxz and Tresca shear stress τmax for a line contact, highlighting their respective
maximum locations; (c) Evolution of τmax, τxz, and principal compressive normal stresses along the x
direction at the depth of maximum shear stress z=0.78a; (d) Evolution of the absolute values of the principal normal stresses, τmax, and Von Mises equivalent stress σVM along the z direction for x=0 (plots
List of figures
22
Fig. 1.10: Tresca shear stress τmax and respective depth z(τmax) at x=0 function ratio of the degree of ellipticity:
case of a line contact for a/b=0 with τmax=0.3PH at z=0.78a; case of a circular contact for a/b=1 with
τmax=0.31PH at z=0.48a (plot adapted from [17]). ... 61
Fig. 1.11: Typical surface roughness and profile of a 100Cr6 roller after cycling on the Twin-Disc machine
measured by SENSOFAR PLu neox optical profilometer (Appendix H Ref TDM08_01). ... 62
Fig. 1.12: (a) Octahedral stress contours and pressure distribution of a Hertzian line contact with a typical
friction coefficient µ=0.05; (b) identical as (a) but contacting typical rough surfaces acting as stress raisers (surface zoom) (adapted from [48]). ... 63
Fig. 1.13: Typical SEM analysis of an ACBB IR raceway revealing dents after 1265 h of service (#9 Appendix D).
... 64
Fig. 1.14: Typical effect of a dent on the contact pressure and subsurface shear stress field of a Hertzian contact
(from [54]). ... 64
Fig. 1.15: (a) Comparison of the contours of Von Mises stress for frictionless hertzian contact and for a friction
coefficient µ=0.25 (adapted from [17]) with the same normal load; (b) Typical Von Mises stress profile modification as the friction coefficient increases. ... 65
Fig. 1.16: Basic rolling kinematics of an angular contact ball bearing under a typical load illustrating the
different velocities, contact angle, osculation and dynamic effects of the cage (adapted from [17]). ... 66
Fig. 1.17: (a) Heathcote conforming osculation with two lines of pure rolling in A; (b) ball contact sliding
velocities in a radial loaded DGBB representing Heathcote slip; (c) ball contact sliding velocities in an ACBB accounting for transverse spinning motions; (d) overall sliding velocity lines in an ACBB without considering skidding (b, c, and d adapted from [17]). ... 67
Fig. 1.18: Typical misalignment of a DGBB affecting contact kinematics (adapted from [17]). ... 68 Fig. 1.19: Typical Stribeck curve representing the evolution the friction coefficient depending on the Hersey
number or the λ film thickness ratio for the different lubrication regimes. ... 72
Fig. 1.20: Cross section of a typical EHL contact along the OD direction illustrating the contact pressure
distribution and the film thickness profile (adapted from [66]). ... 73
Fig. 1.21: (a) Optical image of a typical spotted ZDDP tribofilm (from [85]); (b) Typical cross section of a wear
track revealing the heterogeneous structure of a MoS2 based tribofilm (from [83]). ... 74
Fig. 1.22: Typical traction curves obtained on the LaMCoS two-disc machine for different conditions revealing:
(a) the Newtonian domain, (b) the limiting shear stress domain and (c) the thermal affected domain. .. 76
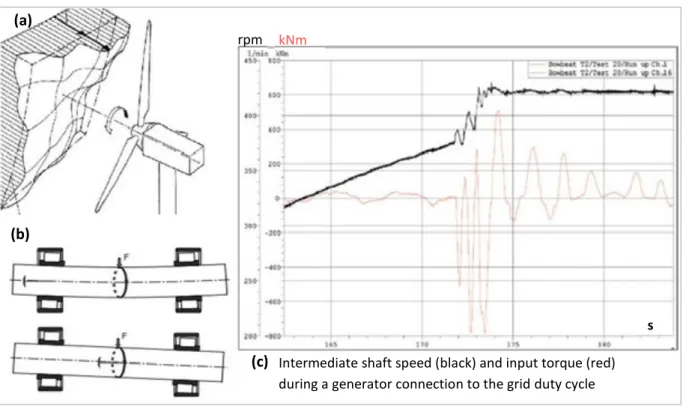
Fig. 1.23: Examples of wind turbine loadings affecting the REB tribological contacts: (a) wind fluctuations; (b)
REB misalignments due shaft displacement (bottom) or bending (top); typical transient events in wind turbine gearboxes (from [9]). ... 77
Fig. 1.24: Overview of the different tribological wear and RCF associated failure modes and microstructural
evolutions in REB contacts function of service life (bottom image adapted from [67]). ... 80
Fig. 1.25: Typical SEM analyses of tribochemically induced micropits on a IR raceway ((a-b) from [29]);
Tribochemical surface distress of the tribofilm due to water contamination of the lubricant (from [109]). ... 81
Fig. 1.26: Significant mild wear profile of a 100Cr6 driver roller after 106 cycles with important material removal measured by SENSOFAR PLu neox optical profilometer (Appendix H ref TDM09_04). ... 82
List of figures Fig. 1.28: (a) Scheme of microcrack development function of the contact kinematics and friction forces
illustrating that surface microcrack propagation is favored on the follower surface; (b) SEM analysis of a 100Cr6 follower roller revealing a typical incipient surface microcrack (Appendix H ref TDM09_12). ... 84
Fig. 1.29: SEM analysis of a typical incipient micropit obtained on a 100Cr6 roller. ... 85 Fig. 1.30: (1) Schematic illustration of the micro-plastic flow in the Hertzian region beneath the rolling contact
surface: the initial volume stressed above the yield limit (a) changes its form (b) causing an elevation of the rolling track (c) and residual stresses build-up exhibiting a profile (d) [40]; depth profile of residual stress measured by XRD analysis on: (2) a martensically hardened 100Cr6 TRB before and after rolling contact fatigue, (3) a DGBB operating under a similar contact pressure but with a heavily contaminated lubricant inducing high surface distress [120]. ... 86
Fig. 1.31: (a) Etched axial cross section LOM of an ACBB IR after 4x10⁷ cycles at 3.5 GPa revealing the formation of DER at depths coherent with the maximum shear stress depth; (b) Etched circumferential cross section LOM of an IR revealing flat (30°) and steep (80°) WEBs in the maximum shear stress region [122]; (c) Schlicht diagram repositioning the microstructural changes versus the contact pressure and the number of cycles (adapted from [122]); (d) Microhardness profile of a through-hardened 100Cr6 subjected to high cycle RCF with the presence of DER and WEBs in the shaded band (adapted from [19]). ... 87
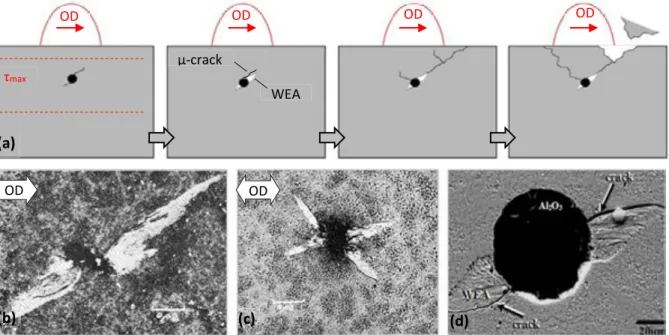
Fig. 1.32: (a) Development of a butterfly in the Hertzian shear stress zone leading to subsurface initiated
spalling; (b) Typical development of the butterfly wings at ~45° versus the surface in the direction of OD [125]; (c) Double-winged butterfly in case of alternating OD [125]; (d) Typical SEM analysis of an incipient butterfly composed of lateral micro-cracks and WEA (from [124]). ... 89
Fig. 1.33: Topview and corresponding circumferential metallographic cross section of a surface initiated spall
on an ACBB IR during after ~50x106 cycles of in-house testing: the V-shape indicates the position of the initial detrimental dent. ... 90
Fig. 1.34: (a) Top-view of a developing subsurface initiated spall presenting a typical oval form with more
incipient cracks developing on the down-line edge; (b) Propagated subsurface initiated spalls on a DGBB IR; (c) Circumferential cross section revealing the typical morphology of a subsurface initiated spall. ... 91
Fig. 1.35: Competition between surface distress and RCF failures modes of REBs depending on the tribological
operating conditions and induced subsurface shear stress (adapted from [114])... 92
Fig. 1.36: Scheme of surface crack propagation modes studied by analytical models applying fracture mechanics
to RCF [149]. ... 95
Fig. 1.37: Example of a cohesive finite element model simulating damage accumulation at grain boundaries to
predict crack initiation in RCF conditions (from [161]). ... 96
Fig. 1.38: Examples of wind turbine REB failure modes (all images from [162]): (a) premature radial cracking of a
gearbox intermediate shaft 100Cr6 through-hardened CRB IR after 1.4x10⁸ cycles (~15% L 10); (b) circumferential metallographic cross section revealing White Etching Cracks (WEC) associated to the surface radial cracks; (c) axial fractograph opening deep radial crack networks in the IR; (d) extended macro-pitting of a main shaft case carburized CRB IR after 1.8x10⁷ cycles (~18% L
10); (e) circumferential metallographic cross section revealing WEC below the raceway of IR illustrated in (d). ... 97
Fig. 1.39: Typical WEC networks revealed on an ACBB IR from further described NTN-SNR RCF test rig: (a) LOM
revealing discrete WEC networks; (b) LOM revealing WEC vertical links to surface and an apparent stair-like top-down growth in the direction of OD; (c) LOM revealing WEC layout parallel to the surface from an axial point of view in accordance with the respective stair-like steps; (d) LOM zoom on the refined white etching microstructure; (e) SEM analysis revealing ultra-thin secondary cracks; (f) Raceway topview of a WEC-initiated spall presenting typical axial cracks. ... 100
List of figures
24
Fig. 1.40: Typical WEA bordering cracks of a multi-branching WEC network in (a) a LOM and (b) SEM
micrographs of an etched cross section of a gearbox TRB IR (from [29]). ... 101
Fig. 1.41: (a) WEC close-up using SEM analysis with corresponding nanohardness indentations in the bulk
matrix and the WEA (from [6]); (b) WEC close-up using ion channeling contrast to reveal linear feature inside WEAs developed mainly on the upper bound of the cracks (black arrow) but also incipiently on the lower bound, as in (a) (from [14]). ... 102
Fig. 1.42: Circumferential LOM of a WEC network after etching with Murakami reagent revealing carbides in the
bulk matrix and confirming carbide dissolution in WEA bordering multi-branching cracks. ... 102
Fig. 1.43: 3D mapping of a WEC network reconstructed by manual serial-sectioning and segmentation
techniques (in red, inclusion interacting with the cracks) [188]. ... 103
Fig. 1.44: (a) LOM of an automotive wheel ACBB through-hardened 100Cr6 ball; (b) LOM of a wind turbine
case-hardened TRB IR (courtesy of NTN-SNR) ... 103
Fig. 2.1: Overall methodology and experimental procedures led for a tribological analysis of WECs. ... 111 Fig. 2.2: (a) NTN-SNR Machine S endurance test rig; (b) Cross section of the ACBB mounting used in this study
for WEC reproduction. ... 112
Fig. 2.3: (a) NTN-SNR ACBB with 10 balls and a polyamide cage used in this study; (b) Cross section of the ACBB
with the mean diameter Dm, the ball diameter Db and the IR curvature rIR ... 113
Fig. 2.4: (a) Contact pressure distribution in the ACBB; (b) Scheme of a cross sectioned IR of the tested ACBB;
Schemes of the tribological parameters for the most loaded ball/IR contact in load case (1) with (b) illustrating the effective contact angle, subsurface shear stress and PΔU sliding energy criterion, and (c) the SRR lines in the IR and OR respective contact ellipsoid. ... 114
Fig. 2.5: Axial LOM prior to Nital etching revealing type A inclusions (MnS) of different morphologies and
orientations vs. the raceway in forged (a) and turned (b) IRs coming from two different steel batches. 115
Fig. 2.6: LaMCoS TDM RCF test rig: (a) Main operational components and sensors; (b) Scheme of the roller
mounting and optional specific installations to (1) impose an electric potential or current through the contact and to (2) regulate the jet oil flow Qjet by varying the relative pipe losses of an opened deviation; (c) Scheme of the twin-disc tribological contact parameters. ... 117
Fig. 2.7: Traction curves performed on the LaMCoS two-disc machine suggesting a µPΔU threshold to establish
a scuffing limit for future TDM RCF tests... 118
Fig. 2.8: Schemes of the different rollers used in this study and corresponding nomenclature used for Appendix
H: (a) Cylindrical and crowned roller profiles and roughness configurations; (b) Standard roller geometry (c) Structural stress modifications using holes; (d) Press fitted IR inducing an estimated 90 MPa hoop stress into the tested cylindrical disc; (e) Disc manufactured horizontally versus the steel rod; (f) Tapered disc with a 10° raceway inclination inducing a ±3.5 % SRR linear gradient along the contact width. ... 119
Fig. 2.9: LOM topview of disc raceways: (a) Artificial dent (50 Kg Rockwell indenter prior to testing); (b) Dent
evolution after RCF testing on the follower surface (Appendix H ref TDM07_07) (c) Typical surface initiated crack at the raceway border on the counter driver roller (Appendix H ref TDM07_02_I_b). .... 121
Fig. 2.10: Artificial dent analysis prior to RCF testing: (a) schemes of different dent positionings on the disc
circumferences; (b) 3D dent topography and (c) profile measured with SENSOFAR PLu neox. ... 121
Fig. 2.11: Scheme of the electrical circuit deployed on the TDM. ... 122 Fig. 2.12: Evolution of the contact resistance RC as a function of the input current IC for different TDM contacts
List of figures Fig. 2.13: Visual aspect of lubricant samples after environmental artificial water ingress. ... 124 Fig. 2.14: Typical HFRR test result and wear scar profile by SENSOFAR PLu neox revealing respectively similar
friction coefficient evolutions with the temperature and similar wear scars for lubricant A at neutral state and with 220 wt. ppm of artificially ingressed water. ... 125
Fig. 2.15: Typical surface analyses of a TDM specimen: (1) HIROX LOM, (2) SENSOFAR raceway 3D topography
and axial profile and (3) SEM-EDX and chemical spectroscopy in the vicinity of a microcrack. ... 126
Fig. 2.16: Example of topography measurement by SENSOFAR PLu neox post-treated with MountainsMap
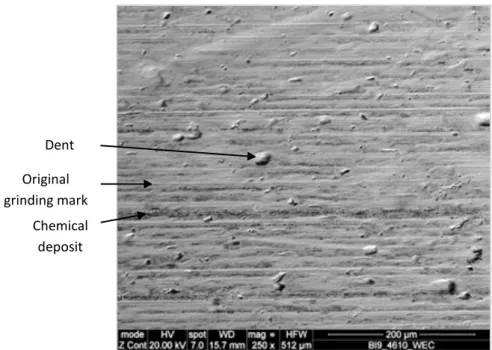
(Appendix H ref TDM12_02): (a) raw measurement of a crown disc; (b) zoom at the raceway after righting; (c) 3D visual; (d) Close-up on features perpendicular to the circumferential grinding marks; (e) circumferential profile confirming regular transverse stripes of material deposit. ... 126
Fig. 2.17: SEM-EDX analysis led on a TDM specimen subjected to high surface distress and tribofilm deposit
(Appendix H ref TDM07_01_II): (a) SE imaging; (b) BSE imaging revealing chemical deposits; (c)
magnification of tribofilm deposit further confirmed by EDX analysis. ... 127
Fig. 2.18: Efficiency of EDTA to remove tribofilm deposits (1) illustrated by the clear frontier between the
untouched left side and the EDTA tissue-cleaned right side of a TDM raceway observed on (a) side-angled LOM and (b) co-axial LOM close-up (Appendix H ref TDM12_07) and (2) confirmed by SEM-EDX analysis on a different TDM raceway (Appendix H ref TDM07_01_II) (c) prior and (d) after EDTA ultrasound bath rising where no more traces of sulfur and phosphorus remain. ... 128
Fig. 2.19: Complementarity between metallographic cross sections and fractography to obtain a representative
overview of WEC networks. ... 129
Fig. 2.20: TDM and ACBB IR axial and circumferential cross sections polished after hot mounting into resin in
order to reveal potential WEC networks by Nital 2% etching. ... 130
Fig. 2.21: Fractography protocol established to force open and reveal WECs: examples of specifically designed
tools for ACBB IRs (a) and DGBB IRs (b); pre-sectioning and three-point bending for TDM raceway fractographs; (d) fractography load monitoring; (e) binocular microscopy of an ACBB IR fractograph revealing wide WEC networks; (f) SEM analysis close-up on the WEC network in (e); (g) WEC fractograph 3D assessment on HIROX KH-7700. ... 131
Fig. 2.22: Serial cross sections of a WEC fractographs to confirm the pre-existent feature in the fracture
corresponds to part of a WEC network. ... 132
Fig. 2.23: Circumferential cross sections of a WEC suggesting a preferential plane of fracture under three point
bending tensile induced stress which would not reveal the circled WEC link to surface (original figure available in Fig. 1.39 (b)). ... 132
Fig. 3.1: Electrolytic hydrogen charging protocol of TDM specimens (a) and Machine S ACBB IR (b). ... 140 Fig. 3.2: Example of transgranular fracture halos around MnS inclusion on a TDM roller fractograph 96 hours
after artificial hydrogen charging. ... 141
Fig. 3.3: Examples of axial spalls on ACBB IR: (a) neutral #7, (b) neutral unspalled #8, (c) H-precharged #28. . 142 Fig. 3.4: Large WEC networks with similar propagation aspect on neutral ACBB IR #7 and H-precharged IR #28
with respectively: axial LOM Nital etched in (a)-(b) and fractographs in (c)-(d). ... 143
Fig. 3.5: WEC reproduction on the artificial H-precharged TDM roller of TDM08_01: (a) premature spall, (b)
circumferential LOM revealing WEC, (c) close-up on a WEC in the depth of maximum shear stress, (d) axial LOM revealing WEC; (e) axial fractograph revealing a brighter WEC network. ... 144
Fig. 3.6: Axial and circumferential LOMs of the neutral IR #7 revealing different morphological layouts of WECs
List of figures
26
Fig. 3.7: Axial LOM (a) of neutral IR #4 revealing the typical WEC position at the border of the DER and the
approximate position of the 4 circumferential slices by successive polishing of the same IR (b). ... 146
Fig. 3.8: LOM of an H-precharged TDM roller that failed prematurely after 2.5x10⁶ cycles (TDM08_03) ... 146
Fig. 3.9: SEM top view imaging of a WEC fractograph at the contact border of neutral IR #7 (SEM SUPRA 55 VP
available at MATEIS): (a) up on the striated preexistent WEC crack flank near the raceway; (b) close-up on type A MnS inclusions in the vicinity of WEC crack tip far beneath the raceway. ... 147
Fig. 3.10: WEC different position versus the contact area: (a) fractographs of the H-precharged IR # 28 aligned
with that of the neutral IR #7 (opposite side of Fig. 2.21 (e) ); (b) close-up on the small WEC network of IR #28 at the angle of contact (SEM imaging in Fig. 3.4 (d)); (c) axial LOM of IR #28 and neutral IR #9 aligned confirming the WEC offset to the border of the DER region in neutral IRs. ... 148
Fig. 3.11: (a) Scheme illustrating the WEC location versus the contact area in non-precharged and
H-precharged ACBB IR; (b) Three-quarter view of the H-H-precharged (H) TDM roller fractograph revealing a WEC at the center of contact below the raceway (cf. Fig. 3.5). ... 149
Fig. 3.12: Fractograph SEM close-up on the WEC connection to the surface revealing a smooth vertical
preexistent axial crack consistent with those observed in surface analyses (Fig. 3.3 (b)). The white arrows suggest a stair-like top down growth in the direction of OD (neutral IR #7). ... 150
Fig. 3.13: SEM close-up on a three-quarter view of an undamaged raceway despite the presence of a WEC
network in its vincinity confirmed by a circumferential unetched cross section (IR #61). ... 150
Fig. 3.14: Scheme of WEC formation conjecture in H-precharged specimens where crack initiation occurs in the
subsurface maximum shear stress zone due to excessive steel embrittlement ... 152
Fig. 3.15: SEM-EDX analysis of a WEC fractograph of neutral IR #61 revealing the presence of lubricant
compounds all the way down to the crack tip and a wide vertical connection to the raceway (IR cleaned by ethanol ultrasound bath rinsing and immediately put in SEM chamber after fracture). ... 154
Fig. 3.16: SEM-EDX analysis of a circumferential cross section of neutral IR #61 revealing a WEC network
connected to the surface with the presence of lubricant compounds deep into the primary crack but not in the adjacent WEA. ... 154
Fig. 4.1: Scheme of the 81212 CRTBs tested on a FAG FE-8 test rig with a focus on the induced slip velocities
and WEC locations versus the contact area. ... 160
Fig. 4.2: Typical grinding marks on similar NTN-SNR CRTB washers (Rq=0.10 µm) ... 161
Fig. 4.3: (a) standard cage design with spherical pocket (#1-36); (b) enhanced oblong pocket clearance by a 4%
circumferential elongation (#37-64); (c) latest design combining oblong pocket and thinner and less-conforming bridges (#65-68). ... 163
Fig. 4.4: (a) ACBB #40 standard cage after dismounting; (b) Specific ACBB short test under load case 4 with an
orange painted oblong cage to locate the friction spots between the ball and the cage pockets. ... 163
Fig. 4.5: WEC-affected ACBB #61 balls with a matt grey coloration; WEC-free ACBB #65 and #63 balls with a
shiny aspect; WEC-affected ACBB #8 balls with also a shiny aspect. ... 164
Fig. 4.6: SEM analyses of shiny ball from ACBB #62 and grey and matt ball from ACBB #61. ... 164 Fig. 4.7: ACBB ring flanges aspect after RCF tests. ... 165 Fig. 4.8: Axial LOM of ACBB IRs from the same shaft revealing a significant variation in DER density. ... 166 Fig. 4.9: Typical results of SEM EDX linear tribofilm analysis performed on raceway topview of WEC-affected IR
#8 (standard cage clearance) and #61 (oblong cage clearance) providing close-ups on (a) an axial incipient microcracks positioned at ~2 mm from the groove in the WEC region, and on (b) heterogeneous and
List of figures stripped tribofilm at the contact border nearby the WEC region (N.B. the size of the EDX spot
represented is not scaled but is here as a reminder). ... 167
Fig. 4.10: Typical results of SEM EDX linear tribofilm analysis performed on raceway topview of WEC-free IR #63
(oblong cage clearance). ... 168
Fig. 4.11: Typical results of SEM EDX linear tribofilm analysis performed on raceway topview of WEC-free IR #65
(oblong cage clearance plus less-conforming bridges). ... 168
Fig. 4.12: Infrared transmission spectrometry assessment on three different samples of lubricant A ... 171 Fig. 4.13: Slide to roll ratio (SRR) and dimensionless sliding energetic criteria P.ΔU along the contact major axis
transverse to rolling motion for (1) the CRTB FE8 configuration (green) and for (2) WEC-free (black) and WEC-affected (orange-red) ACBB load cases (Fig. 2.4 and Table 2-2). A suggested P.ΔU threshold for WEC development is represented by the blue dashed lined and arrows. Similar P.ΔU plot accounting for scaled contact major axis available in Appendix G (a). ... 173
Fig. 4.14: Superposition of the P.ΔU profile along the major axis of the most loaded ball/IR contact (contact
angle α=30.7°) for the ACBB tests load case 1: (a) fractographs of IR #9 and (b) stitched axial LOM of IR #7. Repositioning is achieved by aligning the respective grooves and flanges. ... 173
Fig. 4.15: Raceway topview of the contact edges of ACBB IR #7 and #65 where grinding marks remain (dents on
IR#7 most probably due to debris from subsequent spalling). ... 174
Fig. 4.16: Scheme of WEC initiation mechanisms by formation of nascent steel surfaces either (a) directly at the
surface by incipient wear and/or heterogenous and patchy tribofilms, either (b) indirectly by the opening of incipient surface microcracks allowing lubricant contact with nascent flanks. ... 176
Fig. 4.17: SEM-EDX analysis of an axial microcrack observed in the contact edges of WEC-affected ACBB IR #8
revealing high manganese and sulfur contents in the crack vicinity suggesting the crack has been initiated due to the presence and/or dissolution of a type A inclusion near the surface [29]. ... 178
Fig. 4.18: Scheme of hydrogen permeation into the steel: lubricant or water molecules are chemisorpted at
tensely stressed nascent metal surfaces at the raceway or at microcrack tips liberating highly diffusible hydrogen that is eventually trapped in the vicinity of defects such as inclusions. ... 179
Fig. 4.19: Scheme of WEC propagation due to local hydrogen embrittlement at crack tips: (a) radial cracking in
through-hardened bearing subjected to tensile hoop stresses and (b) flaking in components subjected to compressive residual stresses such as case-carburized or significantly loaded components. ... 181
Fig. 4.20: Circumferential LOM of a specific NTN-SNR DGBB IR tested on a Machine S with highly additivated
lubricant B: WEA form aside cracks that initiated at the IR bore due to intense fretting. ... 182
Fig. 5.1: Partial overview of influent drivers on WEC formation from macro to tribo-scales suggested by 1wind turbine REB, 2ACBB and 3CRTB WEC occurrences. Examples of interactions suggested by arrows. ... 189
Fig. 5.2: WEC initiation and propagation root cause analysis with some various influences of multiple drivers
from tribo to macro-scales (Appendix I, J, K, L). ... 191
Fig. 5.3: Examples of different root causes leading to similar WEC drivers and multiple consequences at
tribo-scales all influencing each other: (a) slippage, (b) tribofilm properties, (c) temperature ... 192
Fig. 5.4: Circumferential LOM of IR#61 with a high WEC density despite at high inclusion cleanliness. ... 194 Fig. 5.5: Dimensionless sliding energetic criteria P.ΔU along the contact major axis for various REBs. ... 196 Fig. 5.6: Dimensionless sliding energetic criteria P.ΔU and N.ΔU for wind turbine D-SRB and TRB. ... 196 Fig. 5.7: Dimensionless sliding energetic criteria N.ΔU along the contact major axis for various REBs. ... 197
List of figures
28
Fig. 5.8: Dimensionless sliding energetic criteria vs. the lubrication parameter N.ΔU/λ for various REBs. ... 197 Fig. 5.9: General approach of WEC initiation and propagation on the TDM (details in Appendix H). ... 204 Fig. 5.10: TDM07_01_II cylindrical roller circumferential LOM (propagation phase, 3.0x10⁷ cycles, 3.4 GPa, 30%
SRR, driver, subsequent to microcrack pre-initiation with a dented counter-roller). ... 205
Fig. 5.11: TDM10_06 crowned roller typical raceway topview (a), circumferential LOM (b) and SEM ¾ view of
the circumferential cross section and raceway microcrack revealing some crack ramifications opposite to OD without adjacent WEA (propagation phase, 2.9x10⁷ cycles, 3 GPa, 30% SRR, driver, 85°C water contamination, and regular EDTA cleaning of the tribofilm, subsequent to microcrack pre-initiation with a dented counter-roller). ... 206
Fig. 5.12: TDM09_04 crowned roller typical raceway center topview (a), SEM ¾ view of a circumferential cross
section (b), and SEM analysis of a raceway fractographs opening a shallow surface microcrack (initiation phase; 1.9x10⁷ cycles, 2 GPa, 7% SRR, follower, lubricant A at 50°C). ... 207
Fig. 5.13: Typical TDM13_02 raceway topview of (a) cylindrical follower roller and (b) crowned driver roller
(2.5x 10⁷ cycles,3 GPa, 30% SRR, lubricant B at 85°C, water contamination and 50mA). ... 208
Fig. 5.14: Circumferential LOM of TDM11_00 cylindrical roller with holes inducing additional structural stresses
(3.5 GPa, 7% SRR, driver, lubricant PAO8 at 80°C) (cracks are emphasized due to etchant trap in their vicinity). ... 209
Fig. 5.15: Typical circumferential LOMs of TDM cylindrical follower raceway after RCF testing with various
additive blends (Table 5-2) targeted to intersect with visible surface cracks. ... 212
Fig. 5.16: SEM-EDX analysis on TDM raceways after RCF testing with various additive blends (Table 5-2)
revealing different tribofilm composition. ... 213
Fig. 5.17: WEC formation seems to require a subtle instable equilibrium between mechanical, material and
List of tables
List of tables
Table 1-1 : Typical through hardened bearing steel chemical composition (wt.%) limits (ISO 683-17:1999
standard on bearing steels) and precise chemical composition of the 100Cr6 steel used in this study. .... 53
Table 1-2 : Example of case-hardened bearing steel chemical composition (wt.%) (ISO 683-17:1999)... 53 Table 1-3 : 100Cr6 D2 bearing steel mechanical properties at room temperature (data from NTN-SNR also
available in [25] and in good agreement with [29]). ... 54
Table 2-1: NTN-SNR Machine S endurance test rig operating conditions for the ACBB tests. ... 113 Table 2-2: ACBB load cases and tribological parameters at the most loaded ball/IR contact oil lubricated with
ISO VG46 mineral oil at 40°C (position 6 in Fig. 2.4 (a)). ... 114
Table 2-3: LaMCoS TDM RCF test rig operating condition ranges explored in this study ... 116 Table 2-4: Rheological properties of the lubricants (lubricant A for Machine S ACBB and TDM tests). ... 120 Table 2-5: Infrared emission spectrometry for lubricant chemical content in ppm (ASTM D5185). ... 120 Table 2-6: Water content in wt. ppm determined by the Karl Fisher titration method applied to different
lubricants either new or aged in application (in wt. ppm). ... 124
Table 2-7: Water content determined by the Karl Fisher titration method applied to lubricants after different
environmental artificial water ingress for a given time at a given temperature (wt. ppm). ... 124
Table 2-8: Viscosity of the new and water contaminated lubricants (mm²/s) ... 125 Table 3-1: Artificial hydrogen charging protocols available in the literature. ... 140 Table 4-1: WEC reproduction RCF tests without prior hydrogen charging: on CRTBs and on ACBBs (contact
conditions given for the most loaded ball). ... 169
Table 5-1: Comparison chart of typical tribological parameters between the ACBB and the TDM tests (TDM
ranges are specified excluding specific tests, details in Appendix H). ... 203
Notations
Notations
General
µ Global friction coefficient, µ=T/N [.]
µx Local friction coefficient in the OD, µx=τxy/σz [.]
a Minor semi-axis of the contact ellipse [m]
b Major semi-axis of the contact ellipse [m]
D Diameter [m]
Dm Pitch diameter, Dm≈1/2(bore diameter + outer diameter) [m]
E Material elastic Young’s modulus [Pa]
E* Material equivalent Young’s modulus [Pa]
F Osculation, fir=rir/Db [.]
Fa Axial load of the bearing [N]
Fr Radial load of the bearing [N]
G* Material parameter (Appendix A. Contact theory) [.]
h Asperity heights [m]
H* Dimensionless film thickness (Appendix A. Contact theory) [.] H1 Maximum Hertzian pressure with no plastic deformation [MPa]
hc Central film thickness [m]
k Ellipse ratio, k=b/a (Appendix A. Contact theory) [.]
C Basic dynamic capacity of a REB [N]
l Line contact length [m]
L10 Expected life of 90% of similar bearings under similar conditions [.]
n Rotational speed [min-1]
N Normal contact load [N]
Nc Number of cycles [.]
P Local contact pressure along the major contact axis [Pa]
PH Maximum Hertzian pressure (Appendix A. Contact theory) [Pa]
r Radius of curvature of a raceway [m]
Q Equivalent REB load [N]
R Radius [m]
R* Equivalent radius of curvature (section 1.2.1.1) [m]
R’ Relative radius of curvature (section 1.2.1.1) [m]
Ra Arithmetic average of the roughness profile [m]
Rq Root mean square roughness [m]
SRR Slide to roll ratio: SRR=(ΔU/Ur) [.]
T Tangential contact load [N]
U Linear velocity of the components at contact [m.s-1]
U* Speed parameter (Appendix A. Contact theory) [.]
Ur Lubricant entrainment speed or Rolling velocity, Ur=(U1+U2)/2 [m.s-1]
V Linear velocity of the components [m.s-1]
W* Load parameter (Appendix A. Contact theory) [.]
wt.% Percentage in weight [.]
Notations
32
z Depth below he contact surface [m]
α Angle of contact [°]
α* Piezoviscosity coefficient [Pa-1]
δ Maximum Hertzian deformation (Appendix A. Contact theory) [m]
ΔU Sliding velocity at contact [m.s-1]
ε Strain [.]
η Lubricant dynamic viscosity at contact inlet [Pa.s-1]
η100 Lubricant dynamic viscosity at 100°C [Pa.s-1]
η40 Lubricant dynamic viscosity at 40°C [Pa.s-1]
ϴ Temperature [°C]
λ Film thickness ratio, λ=hc/(Rq,1²+Rq,2²)0.5 [.]
µ Friction coefficient [.]
ν Material Poisons coefficient [.]
ρ Lubricant density [.]
σ Normal stress [MPa]
σoct Octahedral equivalent stress [MPa]
σp0.002 Tensile micro-yield strength limit [MPa]
σp0.2 Tensile yield strength limit [MPa]
σVM Equivalent Von Mises stress [MPa]
σVM Von Mises equivalent stress [MPa]
τ Shear stress [MPa]
τ0 Maximum alternative orthogonal shear stress [MPa]
τmax Maximum shear stress or Tresca shear stress [MPa]
τp0.002 Micro-yield shear strength limit [MPa]
Ω Angular velocity, Ω=nπ/30 [rad/s-1]
Subscripts
1 Relative to body 1 in contact 2 Relative to body 2 in contact b Relative to the ball
ir Relative to the inner ring
max Maximum
or Relative to the outer ring rk Relative to the roller x,y,z x,y,z respective direction
Coordinates
x Over-rolling direction z Subsurface depth direction y Corresponding axial direction
Abbreviations
Abbreviations
General
3D Three dimensional
AW Anti-wear additives CaS Calcium Sulfonates
CoE Cost of Energy
DLC Diamond Like Coatings
EDTA Ethylenediaminetetraacetic acid EDX Energy dispersive X-ray spectroscopy EHD ElastoHydroDynamic
EP Extreme pressure additives FM Friction modifiers
H Hydrogen
HD Hydrodynamic
ISO International Organization for Standardization LOM Light Optical Microscopy
NDT Non Destructive Technique O&M Operations and Maintenance OD Over-rolling direction PAG Polyalkylene glycol oil PAO Polyalphaolefin synthetic oil
SEM Scanning electron microscope (for this study: FEI Quanta 600 coupled with an Oxford Instruments EDX probe controlled by INCA software) TDA Thermal Desorption analysis
TDM Twin-Disc machine VI Viscosity index XRD X-Ray Diffraction ZDDP Zinc Diakyldithiophospohates ZnDTP Zinc Dithiophosphates Bearings
ACBB Angular contact ball bearing AISI American Iron and Steel Institute CRTB Cylindrical roller thrust bearing DER Dark etching region
DGBB Deep groove ball bearing
IR Inner ring
OD Over-rolling direction
OR Outer ring
RCF Rolling contact fatigue REB Rolling element bearing REB Rolling Element Bearings
Abbreviations
34
SABB Self-aligning ball bearing SRB Spherical roller bearing TRB Tapered roller bearing WEA White etching area WEB White etching bands WEC White Etching Cracks WEL White etching layer WSF White structure flaking
Tribological analysis of White Etching Crack (WEC)
failures in Rolling Element Bearing
General introduction
The wind turbine market expansion
Have you ever imagined our world without electricity? No more light, no more transportation means, no more industries, no more computers, reduced food production... Electricity is everywhere and human nature is obviously becoming more and more fundamentally dependent on it. To fulfill a growing reliance of an expanding worldwide population, the electricity generation is constantly increasing (Figure 1), especially in developing countries where both modern technologies and populations present the greatest expansion rates. For the moment, the main sources of electricity are non-renewable energies as fossil fuels and nuclear plants.
However, in recent years, the influence of human exponential need of energy has become a major concern considering both environmental issues and the depletion of the earth’s non-renewable resources. Therefore, broad non-renewable energy projects, derived from natural processes that are replenished constantly by nature like sunlight, wind, tides, plant growth and geothermal heat, are developed and are projected to grow strongly in the coming decades, by enjoying a wide public acceptance (Figure 2) and significant governmental financial support. In 2011, according from the U.S. Energy Information Administration, about 17% of global final electrical consumption was supplied by renewables resources (Figure 1). After biomass and hydroelectricity, wind power presently accounts for 2.5% of the electricity generation. It is, however, currently growing at the greatest rate of all, reaching around 25% annually (Figure 3 and Figure 5).
Figure 1: Worldwide population and electricity generation, highlighting the limited but developing wind energy (numerical data from [1]).
0 1 2 3 4 5 6 7 8 0 5000 10000 15000 20000 25000 1980 1985 1990 1995 2000 2005 2010 2015 Wor ld p o p u lation (x10 9) Wor ld e le ctr ic tiy g e n e ration (x10 9kW/ h ) Year
World population and electricity generation (EIA data)
Total electricity generation Wind electricity generation Nuclear electiricy generation Fossil Fuel electricity generation Total renewable electricity generation Population
General introduction
38
Figure 2: Public acceptance of wind and nuclear energy (poll from 2010 on 6255 adults aged 16-64 equally distributed among the U.S.A, U.K, France, Spain, Italy and Germany [2]).
Figure 3: Zoom on the worldwide ratio of wind turbine electricity generation versus total generation from Figure 1 (numerical data from [1]).
Wind energy is converted in electrical power by means of wind turbines that basically employ the wind kinetic energy continuously acting on blades to rotate a shaft that is itself connected to an AC/DC electrical generator via a multiplicative gearbox (Figure 4) to accommodate the main shaft and generator rotational speeds. If some wind turbines rotate along a vertical axis, the most common and developed models are horizontal axis wind turbines composed of three blades connected via a hub to the main shaft and the nacelle at the top of the tower (Figure 4). According to Betz’ law, only 59% of the total kinetic energy of the air flow can be captured by the rotor and due to different efficiency losses, 75% of this energy finally transformed in electrical power.
Forming a new and worldwide rapidly growing industrial branch, wind turbines have tremendously increased in size and in number of installations in the past decades (Figure 5 and Figure 6), and are now commonly displayed in arrays of 10 to hundreds of turbines, known as wind farms, in order to collect the produced electrical power via an electrical grid. In the past five years, at least approximately 40 GW of wind turbine nominal power has been installed annually leading to a cumulative power of more than 300 GW in 2013 (Figure 5). For the moment, the onshore Gansu Wind Farm in China is the biggest wind farm, with near 8GW of installed wind power and a maximum planned of 20GW by 2020, erecting 36 wind turbine every day. As a comparison, common nuclear plants deliver between 0.8 to 2.6 GW of nominal power.
As of today, half of the wind turbines installed have a nominal power between 2 and 3 MW with an increasing share of larger wind turbines of 3 to 7.5 MW. A typical example being currently deployed is Areva Multibrid M5000 5 MW offshore wind turbine that has been prized several times for its “lightweight” design (Figure 4). Some specifications are listed below [3]:
0,0 0,5 1,0 1,5 2,0 2,5 1980 1985 1990 1995 2000 2005 2010 2015 W in d e le ctici ty/To tal (% ) Year
Ratio of the wind electricity vs. the total generation
Wind energy Nuclear energy
General introduction
Tripod foundation structures: 45 m high and 710 tons
Tower: 90 m high and 350 tons
Rotor diameter 116 m (2009) and 135 m (mid 2014)
Swept area: 10500 m² and 14300 m² (two times a football field)
Nacelle and rotor assembly: 349 tons placed at the top of the tower (equipped with a helicopter landing pad)
Cost: example of Global Tech North Sea Wind Park €800 million contract with AREVA for 80 M5000 (2012)
Figure 4: Typical horizontal axis MW wind turbine structure at the top of the tower (courtesy of ZF transmission, www.zf.com); (b) AREVA M5000 5 MW wind turbine maintenance [3].
Figure 5: Wind turbine (a) annual and (b) cumulative worldwide nominal power installed power in MW [4]. One main limitation in wind turbine dimensions is that blade tip velocities have to be kept below the velocity of sound in air. Hence, the main-shaft rotational speeds are limited to
Main shaft & bearings Yaw system
Generator
Brake Gearbox
Coupling Hub & pitch system
(a) (b)
(b) (a)
![Figure 1: Worldwide population and electricity generation, highlighting the limited but developing wind energy (numerical data from [1])](https://thumb-eu.123doks.com/thumbv2/123doknet/14676140.742439/38.892.105.784.621.1018/figure-worldwide-population-electricity-generation-highlighting-developing-numerical.webp)
![Figure 6: Summary of the wind turbines’ expansion in the past decades [5].](https://thumb-eu.123doks.com/thumbv2/123doknet/14676140.742439/41.892.242.653.405.696/figure-summary-wind-turbines-expansion-past-decades.webp)
![Fig. 1.36: Scheme of surface crack propagation modes studied by analytical models applying fracture mechanics to RCF [149]](https://thumb-eu.123doks.com/thumbv2/123doknet/14676140.742439/96.892.192.678.545.853/scheme-surface-propagation-studied-analytical-applying-fracture-mechanics.webp)
![Fig. 1.40: Typical WEA bordering cracks of a multi-branching WEC network in (a) a LOM and (b) SEM micrographs of an etched cross section of a gearbox TRB IR (from [29])](https://thumb-eu.123doks.com/thumbv2/123doknet/14676140.742439/102.892.111.786.760.1028/typical-bordering-cracks-branching-network-micrographs-section-gearbox.webp)