HAL Id: hal-01907590
https://hal.archives-ouvertes.fr/hal-01907590
Submitted on 6 Jan 2019HAL is a multi-disciplinary open access archive for the deposit and dissemination of sci-entific research documents, whether they are pub-lished or not. The documents may come from teaching and research institutions in France or
L’archive ouverte pluridisciplinaire HAL, est destinée au dépôt et à la diffusion de documents scientifiques de niveau recherche, publiés ou non, émanant des établissements d’enseignement et de recherche français ou étrangers, des laboratoires
Toward an Automatic Prediction of the Sense of
Presence in Virtual Reality Environment
Magalie Ochs, Sameer Jain, Philippe Blache
To cite this version:
Magalie Ochs, Sameer Jain, Philippe Blache. Toward an Automatic Prediction of the Sense of Presence in Virtual Reality Environment. 6th International Conference on Human-Agent Interaction (HAI-2018), Dec 2018, Southampton, United Kingdom. �hal-01907590�
Abstract
In human-agent interaction, one key challenge is the evaluation of the user’s experience. In the virtual reality domain, the sense of presence and co-presence, reflecting the psychological immersion of the user, is generally assessed through well-grounded subjective post-experience questionnaires. In this article, we aim at presenting a new way to automatically predict the sense of presence and co-presence of a user at the end of an interaction based on specific verbal and non-verbal behavioral cues automatically computed. A random forest algorithm has been applied on a human-agent interaction corpus collected in the specific context of a virtual environment developed to train doctors to break bad news to a virtual patient. The performance of the models demonstrate the capacity to automatically and accurately predict the level of presence and co-presence, but also show the relevancy of the verbal and non-verbal behavioral cues as objective measures of pres-ence.
Toward an Automatic Prediction of the Sense of
Presence in Virtual Reality Environment
Magalie Ochs, Sameer Jain, and Philippe Blache Aix Marseille Université, Université de Toulon, CNRS,
LIS UMR 7020, LPL UMR 7309, France January 6, 2019
1
Introduction
In Human-Agent Interaction domain, one key aspect is the evaluation of the user’s experience. Nowadays, most of the methods are based on subjec-tive evaluations consisting in asking users to fill questionnaires after their interaction with the virtual agent. These questionnaires are used to assess the perception of the user of the virtual agent, of the task, of the virtual environment, her global satisfaction, engagement, etc.
In the virtual reality domain, the experience of the user is generally evaluated through the measure of the sense of presence, the feeling of beiing present in the virtual environement. The sense of presence can be considered as psychological immersion in virtual environment. Indeed, in the literature, two types of immersion are defined: (1) the technological and physical im-mersion cadoz1994realites made possible by the device and caused particu-larly by 360 degrees; and (2) the psychological immersion [Slater et al., 1996] which is independent of the device (a book, projecting us in a virtual world, and can provoke a psychological immersion, without technological and phys-ical immersion). This second type of immersion is called sense of presence and approaches the concept of flow [Csikszentmihalyi, 2014] that makes the user lose the concept of time and space. When the virtual environment is inhabited by virtual agent or avatars, the notion of sense of co-presence (also commonly called social presence), could be evaluated to assess “the sense of being and acting with others in a virtual space” [Slater et al., 2006]1.
Different questionaires exist to evaluate the sense of presence and co-presence (as for example in [Bailenson et al., 2005]). One main limits of these methods if the subjectivity of the approach consisting in asking the users to self-report their feeling.
1
Note that no consensus exists on the notion of co-presence. A detailed discussion on the different definitions can be found in [Bailenson et al., 2005]
In this article, based on previous research works highlighting objective measures of presence (e.g. [Laarni et al., 2015, Ijsselsteijn, 2002]), we start from the hypothesis that different levels of the sense of presence and co-presence may lead to different verbal and non-verbal behavior of the user. Based on this hypothesis, we explore the possibility to automatically predict the sense of presence and co-presence of a user based on her multimodal behavior during an interaction with a virtual agent in a virtual reality en-vironment. For this purpose we have collected a corpus of human-agent interaction in a virtual reality environment. On one hand, we have used spe-cific tools to record automatically the verbal and non-verbal behavior of the user, and, on the other hand we have collected through questionnaires the sense of presence and co-presence of the user at the end of the interaction. We have considered different virtual reality displays - known to generate different degrees of immersion - to collect different experiences in terms of sense of presence. Based on machine learning techniques, we have learned a model to correlate verbal and non-verbal cues to different levels of presence and co-presence. The accuracy of the model shows that certain verbal and non-verbal cues of the user’s behavior can be used to predict her level of pres-ence and co-prespres-ence. These research results highlight objective behavioral measures of presence and co-presence.
The paper is organized as follows. In the next section, we present the theoretical background on the notion of presence and co-presence. In Section 3, we introduce the human-agent interaction corpus collected with different virtual reality displays. Section 4 is dedicated to the pre-processing of the col-lected data in order to automatically extract relevant verbal and non-verbal behavioral cues that may be used to predict the sense of presence. In Section 5, we present the random forest based model learned on the human-agent interaction corpus, with the extracted verbal and non-verbal behavioral cues exploited as features and, the levels of presence and co-presence clustered to classes to predict. We conclude and discuss perspectives Section 6.
2
The sense of presence and co-presence
2.1 Definition of the sense of presence
Two different schools of thought can be distinguished concerning the defi-nition of immersion. First, in [Witmer and Singer, 1998], the authors con-sider immersion as a psychological state, as the perception of being in, to be surrounded by. Immersion includes for these authors the insulation from the physical environment, the perception of a feeling of being included in the virtual environment, the natural state of the interactions and a perception of control, and the perception of movement in a virtual environment. Another approach considers immersion in a technological view: immersion would
In our study we focus on the first definition of Witmer and Singer [Witmer and Singer, 1998] to describe the sense of presence investigated.
In the literature, several factors are identified in the literature as affected the sense of presence: (1) the ease of interaction: interaction correlates with
the sense of presence felt in the virtual environment [Billinghurst and Weghorst, 1995]; (2) the user control : the sense of presence increases with the sense of control
[Witmer and Singer, 1998]; (3) the realism of the image: the more realistic
virtual environment is, the more the sense of presence is strong [Witmer and Singer, 1998]; (4) the duration of the exhibition: prolonged exposure beyond 15 minutes
with the virtual environment does not give the best result for the sense of presence with HMD (Head Mounted Display) and there is even a neg-ative correlation between the prolonged exposure in the virtual environ-ment and the sense of presence [Witmer and Singer, 1998]; (5) the social presence and social presence factors: the social presence of other individu-als (real or avatars), and the ability to interact with these individuindividu-als in-creases the sense of presence [Heeter, 1992]; (6) the the quality of the vir-tual environment : quality, realism, the ability of the environment to be fluid, to create interaction are key factors in the sense of presence of the user [Hendrix and Barfield, 1996]. Two other factors are more particularly related to the individual perception, and contextual and psychological fac-tors that should be taken into account during the evaluation of presence [Mestre, 2015]. In the next section, we introduce the different questionnaires available to measure these factors.
2.2 Presence Questionnaires
To test the sense of presence, several questionnaires have been proposed. Four of them are canonical since they have been tested several times in other research and are statistically significant: the canonical presence test of Witmer and Singer [Witmer and Singer, 1998], the ITC-SOPI canonical test [Lessiter et al., 2001] that evaluates the psychological immersion, the Slater-Usoh-Steed (SUS) questionnaire to evaluate the spatial presence, and the canonical test IGroup Presence Questionnaire (IPQ) [Schubert et al., 2001]. The latest has been used in our study to evaluate our training system. This test aims at evaluating three variables dependent on presence factors: the spatial presence, the involvement in the device, and the realism of the device. The test is composed of 14 questions, some of them are taken directly from the Presence Questionnaire [Witmer and Singer, 1998] and the SUS ques-tionnaire [Usoh et al., 2000]. In the last version, another variable dependent on the global presence was added in the test. This test has the advantage to contain few questions (only 14) but including the main presence factors of the other canonical tests.
However, one limit of the IPQ test is the lack of the evaluation of the notion of copresence. Copresence, also commonly called social presence, can
be defined as “the sense of being and acting with others in a virtual space” [Slater et al., 2006]2. In our context, we are interested in evaluating the sense of copresence of the participants with the virtual agent. In order to evaluate the copresence, we have used the test proposed in [Bailenson et al., 2005] that measures social presence through the following variables: the perceived copresence, the embarrassment to measure the social influence of the agent, and the likability of the virtual representation. In [Bailenson et al., 2005], the authors have shown that this self-report questionnaire is effective “to measure how people perceive an embodied agent”.
2.3 Objective measures of presence and co-presence
Three types of objective measures of presence can be distinguished : behav-ioral (e.g. attention), performance-based (e.g. user’s performance in task re-alization) and physiological (e.g. brain activity, heart rate) [Ijsselsteijn, 2002]. In this article, we focus on behavioral measures of presence.
Some research works have studied the user’s behavior considering the way the user performs specific actions related to the task in the virtual environ-ment. For instance, in [Usoh et al., 1999], the authors have studied the navi-gation path of the users to go to an object and the correlation with the levels of presence. Another study presented in [Slater and Steed, 2000] has shown a close relation between body movements - and more particularly their mag-nitude - and the sense of presence. Finally, as pointed in [Laarni et al., 2015], nowadays, the research works have not yet demonstrated strong evidence of behavioral measures of presence. Moreover, existing research has focused mainly on specific actions related to the context of the task. In the paper, we propose to analyze fine-grained objective behavioral measures of presence by studying verbal and non-verbal behavioral cues.
3
The human-agent interaction corpus in virtual
reality environments
3.1 A virtual reality training platform with different immer-sive displays
The corpus has been collected in the context of a project aiming at developing a virtual reality environment to train doctors to break bad news to a virtual patient (for details on the project, see [Ochs et al., 2017]). A platform has been developed with a virtual patient with which the doctors can interact in natural language. The virtual patient has been endowed with a dialog model and a non-verbal behavior model constructed based on a
human-2
Note that no consensus exists on the notion of co-presence. A detailed discussion on the different definitions can be found in [Bailenson et al., 2005]
human corpus analysis of real interactions of doctors training to break bad news to standardized patients [Ochs et al., 2017].
In order to collect data with different levels of immersion, we have imple-mented the virtual patient on different virtual reality displays: PC, virtual reality headset, and virtual reality cave (Figure 1). The virtual reality cave is
Figure 1: Participants interacting with the virtual patient with different virtual environment displays (from left to right): virtual reality headset, virtual reality room, and PC.
constituted of a 3m deep, 3m wide, and 4m high cubic space with three ver-tical screens and a horizontal screen (floor). A cluster of graphics machine makes it possible to deliver stereoscopic, wide-field, real-time rendering of 3D environments, including spatial sound. This offers an optimal sensorial immersion of the user. The environment has been designed to simulate a real recovery room where the breaking bad news are generally performed. The virtual agent based on the VIB platform [Pelachaud, 2009] has been integrated in by means of the Unity player.
3.2 The collect of the human-machine interaction corpus
In order to collect the interaction and create the corpus of human-machine interaction in the context of breaking bad news, we have implemented a specific methodology.
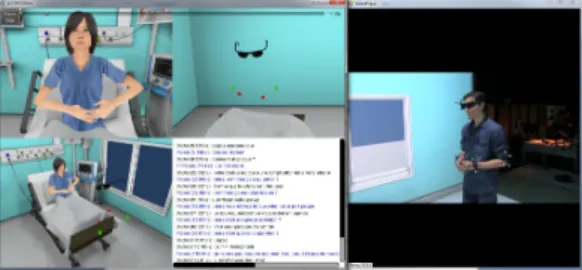
Equipment to collect objective verbal and non-verbal measures. The doctor is filmed using a camera. Her gestures and head movements are digitally recorded from the tracking data: her head (stereo glasses), elbows and wrists are equipped with tracked targets. A high-end microphone synchronously records the participant’s verbal expression. As for the virtual agent, its gesture and verbal expressions are recorded from the Unity Player. The visualization of the interaction, is done through a 3D video playback player we have developed (Figure 2). This player replays synchronously the animation and verbal expression of the virtual agent as well as the movements and video of the participant. This environment facilitates the collection of the corpus of human-agent interaction in order to analyze the verbal and non-verbal behavior in different immersive environments.
Procedure. When participants arrived at the laboratory, an experimenter sat them down and presented them the instructions. Each participant has
Figure 2: 3D video playback player
interacted with the systems 3 times with three different displays: PC, virtual reality headset, and virtual reality cave. Note that we counterbalanced the order of the use of each display in order to avoid an effect of the order on the results. The task of the participants was to announce a digestive perforation after a gastroenterologic endoscopy in immediate post operative period3. Before the interaction, written instructions were presented to the participants: the role they have to play is a doctor that had just operated the virtual patient to remove a polyp in the bowel. A digestive perforation occurred during the surgery. These written instructions explains precisely the causes of the problem, the effects (pain), and the proposed remediation (a new surgery, urgently). Participants are asked to read the instructions several times as well as before each interaction. The understanding is verified by means of an oral questionnaire. Each participant has the instruction to announce this medical situation to the virtual patient three times with the three different displays. The duration of each interaction is in average 3mn16.
Subjective measures of presence and co-presence. In order to eval-uate the participant’s experience, we asked the participants to response to different questions on their subjective experience to measure their sense of presence (with the IGroup Presence Questionnaire, IPQ [Schubert, 2003] and their sense of copresence [Bailenson et al., 2005]. Each questionnaire provides a score ranging from 1 to 5. Based on these scores of the two questionnaires, we consider three levels of presence and co-presence: a low level ([1; 2, 5]), an average level (]2, 5; 3, 5[) and a high level of presence and co-presence ([3, 5; 5]).
Participants. In total, 38 persons (28 males, 10 females) with a mean age of 29 years (SD:10.5) have participated to the experimentation. Some participants (25) have been recruited in the University. 13 of them are real doctors recruited in a medical institution. These participants had already 3The scenario has been carefully chosen with the medical partners of the project for
several reasons (e.g. the panel of resulting damages, the difficulty of the announcement, its standard characteristics of announce).
have an experience in breaking bad news with real patients. The participants were not paid.
A statistical analysis of the effects of the virtual reality displays and of the type of the participant (doctors versus naive) on the behavior dis-played and on the sense of presence and co-presence is described in details in [Ochs et al., 2018]. In this paper, we focus on the automatic prediction of the sense of presence and co-presence by considering the type of participant and their verbal and non-verbal behavior as key features. Note that the goal of this work is not to predict the different interaction modes (PC, virtual reality headset, or virtual reality room), but the levels of presence and co-presence. We have shown in [Ochs et al., 2018] that the three interaction modes imply different levels of presence and co-presence.
In the next section, we present the processing of the collected objective measures (corresponding to tracked points on the participants body and transcript text) to compute verbal and non-verbal relevant cues.
4
Automatic extraction of verbal and non-verbal
cues
To summarize, in the corpus, the collected data are the following:
• a video of the participant during her interaction with the agent in the three environments: a virtual reality cave, a virtual reality headset, and a PC;
• time-series three-dimensional unity coordinates of 5 trackers located on the participant’s head, left and right elbows, and left and right wrists during the interaction;
• an audio file from a mic pinned to the participant during the interaction and hence containing only the voice of the participant. The audio file has been transcript from an automatic speech recognition system.
In total, the data contains 114 human-agent interactions. However, due to technical recording problems, some interactions have not be integrated in the corpus. Finally, the corpus is composed of 86 human-agent interactions. In the machine learning point of view, in order to reduce the number of features, we have processed this data to compute relevant verbal and non-verbal behavioral cues. We present these features in the following.
Segmentation of the interaction in three phases. The interaction between the participants and the virtual patient is split into 3 phases: the beginning, the central part, and the conclusion. Based on a previous analysis of human-human interaction in the same context [Saubesty and Tellier, ], we
suppose that the verbal and nonverbal behavior may differ depending on the phases of the interaction. Keeping this in mind, we performed our analysis independently for each phase for all the data sources we have. We defined the size of each phase relatively to the total duration of the interaction. As a first step, we define empirically the duration of each phase: 15% of the total conversation for the introduction, 70% for the central part of the interaction, and 15% for the conclusion. Note that a script in Python has been written with the percentage of each phase in parameter to automatically compute the features described in the following with different segmentation.
Features characterizing lexical richness and linguistic complexity. In order to compute high-level features characterizing the lexical richness and the linguistic complexity of the user’s verbal behavior, we have com-puted the frequency of the part-of-speech tags for each participant and each phase of the interaction. Using a specific tool called SPPAS [Bigi, 2012], we performed a tokenization followed by a phonetization on the transcrip-tion file. lThe part-of-speech (POS) tags were automatically identified using MarsaTag [Rauzy et al., 2014]. MarsaTag is a stochastic parser for written French which has been adapted to account for the specificities of spoken French. Among other outputs, it provides a morpho-syntactic category for each POS token. We consider 9 parts-of-speech tags: adjective, adverb, auxiliary, conjunction, determiner, noun, preposition, pronoun, verb.
Based on these POS tags, we computed two high level features for each phase: lexical richness, measured as the fraction of adjectives and adverbs out of the total number of tokens and linguistic complexity, measured as the fraction of conjunctions, prepositions and pronouns out of the total number of tokens.
Length of the sentences in terms of number of words. We compute the average length of sentences in each pahse of the interaction for each participant. The length corresponds to the number of words of a sentence. The MarsaTag tool [Rauzy et al., 2014] has been used to define the sentences from the transcript text.
Lengths of inter-pausal units in terms of duration . The speech signal was segmented into Inter-Pausal Units (IPUs), defined as speech blocks surrounded by at least 200 ms silent pauses4. Due to its objective nature, the IPU has been automatically segmented using SPASS [Bigi, 2012].
4
For French language, lowering this 200 ms threshold would lead to many more er-rors due to the confusion of pause with the closure part of unvoiced consonants, or with constrictives produced with a very low energy.
Body movements. Concerning the non-verbal cues, we have computed the entropy to characterize the movements of the participant in the virtual environment. The entropy is a common measure in virtual reality domain to assess the movements of the participants [Maïano et al., 2011]. To ob-tain the entropy of the curve defined by the movement of each tracker on the participant, following the method described in [Dodson et al., 2013], we have computed the upper-bound on the Shannon entropy of curves of each plane (x, y and z) and each tracked point (head, left wrist, right wrist, left elbow, and right elbow). Finally, the different computed values of entropy are averaged two obtained two features: the average movements of the head, and the average movement of the arms.
To summarize, each human-agent interaction is characterized by the follow-ing 7 features:
• total duration of the interaction represented by one continuous value in seconds;
• expertise of the participant represented by a binary categorical variable representing whether the participant is an expert (doctor) or a non-expert;
• entropy of head and arms movements represented by 6 continuous vari-ables (the entropy for the head and of the arm computed for each of the three phases of the interaction);
• average sentence length in terms of number of words characterized by 3 continuous variables (one for each phase);
• average length of Inter-Pausal Units in seconds represented by 3 con-tinuous variables (one for each phase)
• lexical richness represented by 3 continuous variables, one for each phase, computed as follows:
nb_adj+nb_adv
Ptokens
• linguistic complexity represented by 3 continuous variables, one for each phase, computed as follows:
nb_conjunctions+nb_prepositions
P
tokens
In a nutshell, the collected data is represented by a matrix of 86 lines (one per interaction) and 20 columns (one per feature). In the next section, the features are used to learn a model to automatically predict the sense of presence and co-presence of the participants.
5
Automatic prediction of the sense of presence
based on multimodal cues
Our goal is to predict users’ sense of presence and co-presence based on objectives measures. In our context, we consider two classification problems making it possible to predict 1/ the level of the sense of presence and 2/ the level of the sense of co-presence. The same features, described in the previous section, are used to learn the two models. For each interaction, the sense of presence and co-presence have been assessed through two questionnaires (Section 2). The resulting values are continuous in [0, 5]. To approach this problem as a multi-classes problem, we clustered the scores into three classes representing: a low level of presence and co-presence for the values ranging in [1; 2, 5], a medium level for values in ]2, 5; 3, 5[ and a high level for values in [3, 5; 5]. Each human-agent interaction is then associated with values indicating the level of presence and co-presence to predict.
In terms of methods, we used a a feature selection algorithm. This ap-proach offers the advantage to identify the most relevant features character-izing a class. Applied to our problem, this enables us to explore the relevant verbal and non-verbal cues characterizing different levels of presence and co-presence. Different feature selection algorithms exist. In this work, we used the Random Forest approach [Breiman, 2001], offering the particular advantage, compared to other statistical models such as RNN, to measure the relevance score for each feature but also to handle high-dimensional data with a high generalization power [Strobl et al., 2008]. Such a method has already been used in a similar task to identify relevant social cues in body movements associated to emotions[Fourati and Pelachaud, 2015].
In the presented work, two random forest models are learnt: one for the notion of presence, the other for the notion of co-presence. In both models, we predict the class corresponding to the level of presence or co-presence (low, medium, high). We have used the random forest algorithm with 10 decision trees5. Note that in order to avoid the prediction classification problem due to unbalanced data-set, we have done over-sampling on minority classes by duplicating unbalanced samples to obtain equivalent number of samples in each classes. Each class contains finally 42 samples.
As commonly used, we have computed three measures to evaluate the quality of prediction of a model: precision, recall and F1 Score. The data-set is split in a training and test data-set. To estimate the over-fitting, we have performed k-cross validation with k = 10. Since we performed a 10-cross validation, the entire data was split into 10 parts and performance metrics were evaluated 10 times, each time keeping one part as the test set and the
5
Models with different numbers of trees were manually tested, but finally kept at the default value (10 decision trees) because the performance was worse or similar. An exhaustive search for the optimum was not performed.
Presence F-score Precision Recall
Low 0,87 0,84 0,9
Medium 0,78 0,88 0,0,81
High 0,61 0,77 0,6
Macro-average 0,79 0,79 0,77
Figure 3: Presence level (average)
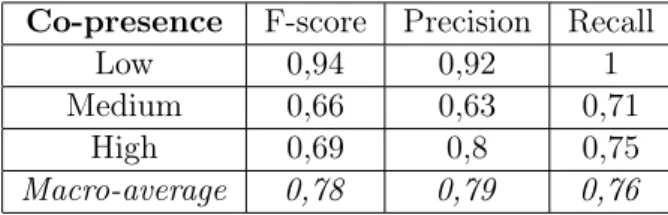
Co-presence F-score Precision Recall
Low 0,94 0,92 1
Medium 0,66 0,63 0,71
High 0,69 0,8 0,75
Macro-average 0,78 0,79 0,76
Figure 4: Co-presence level (average)
other 9 as the training set. Because of the small size of our data-set, we could not afford to leave aside a part of the data-set only for testing. As a consequence, validation has been performed on every fold and the following tables (Table 3 and Table 4) contain metrics aggregated across all these validations.
The performance measures reveal an accurate capacity of the models to predict both the sense of presence and of co-presence of the users based on relevant verbal and non-verbal behavioral cues. The two models can predict automatically the sense of presence and co-presence of a user at the end of the interaction with the virtual agent only by means of some specific verbal and non-verbal behavioral features.
The high accuracy of the models to predict the sense of presence and co-presence demonstrates the relevancy of the features to distinguish the different levels of presence and co-presence. These results mean that the behavior of the users differ significantly depending on their immersive expe-rience. In other words, users behave differently depending on their sense of presence. A finer-grained analysis of the weights associated to each feature estimated by the random forest algorithm will enable us to identify more precisely the importance of each feature for classification, and consequently the most important verbal and/or non-verbal cues that characterize a high level of presence or co-presence compared to a medium or low level. In any cases, the accuracy of the models demonstrate that the features may be used as objective measures of presence and co-presence.
6
Conclusion and perspectives
In this article, we have explored a machine learning method aiming at pre-dicting the sense of presence and co-presence of users based on objective multimodal behavioral measures. A random forest algorithm has been ap-plied on a human-agent interaction corpus collected in the specific context of a virtual environment developed to train doctors to break bad news to a virtual patient.
Specific verbal and non-verbal behavioral cues have been computed. We have defined high-level features to characterize the user’s multimodal be-havior. These features describe the frequency of head and arms movements of the user as well the lexical richness and the linguistic complexity of her verbal behavior. Through a machine learning approach, these features have been correlated to the sense of presence and co-presence assessed with spe-cific subjective questionnaires. Two computational models have been con-structed to predict automatically different levels of presence and co-presence. The performance measures of the learned models show the accurate predic-tive capacity of the models. In other words, we can predict automatically and accurately the sense of presence and co-presence of the user after the interaction, based on specific cues on her multimodal behavior. This result demonstrates that the verbal and non-verbal cues presented in this article may constitute an objective measures of the subjective sense of presence and co-presence.
The next step will consist in evaluating features importance to better understand how user’s behavior differs depending on her level of psycholog-ical immersion (i.e. her sense of presence), but also depending on the type of the user (doctors versus naive). We aim also at exploring other machine learning methods to compare the performance measures for instance with SVM algorithm known as particularly adapted to small data-sets.
Acknowlegements
This work has been funded by the French National Research Agency project ACORFORMED (14-CE24-0034-02) and supported by grants ANR-16-CONV-0002 (ILCB), ANR-11-LABX-0036 (BLRI) and ANR-11-IDEX-0001-02 (A*MIDEX), STIC-AMSUD Program for the "Empatia" Project.
References
[Bailenson et al., 2005] Bailenson, J. N., Swinth, K., Hoyt, C., Persky, S., Dimov, A., and Blascovich, J. (2005). The independent and interactive ef-fects of embodied-agent appearance and behavior on self-report, cognitive,
and behavioral markers of copresence in immersive virtual environments. Presence: Teleoperators and Virtual Environments, 14(4):379–393. [Bigi, 2012] Bigi, B. (2012). Sppas: a tool for the phonetic segmentations
of speech. In The eighth international conference on Language Resources and Evaluation, pages 1748–1755.
[Billinghurst and Weghorst, 1995] Billinghurst, M. and Weghorst, S. (1995). The use of sketch maps to measure cognitive maps of virtual environments. In Virtual Reality Annual International Symposium, 1995. Proceedings., pages 40–47. IEEE.
[Breiman, 2001] Breiman, L. (2001). Random forests. Machine learning, 45(1):5–32.
[Bystrom et al., 1999] Bystrom, K.-E., Barfield, W., and Hendrix, C. (1999). A conceptual model of the sense of presence in virtual environments. Pres-ence: Teleoperators and Virtual Environments, 8(2):241–244.
[Csikszentmihalyi, 2014] Csikszentmihalyi, M. (2014). Toward a psychology of optimal experience. In Flow and the foundations of positive psychology, pages 209–226. Springer.
[Dodson et al., 2013] Dodson, M. M., France, M. M., and Mendes, M. (2013). On the entropy of curves. Journal of Integer Sequences, 16(2):3. [Draper et al., 1998] Draper, J. V., Kaber, D. B., and Usher, J. M. (1998).
Telepresence. Human factors, 40(3):354–375.
[Fourati and Pelachaud, 2015] Fourati, N. and Pelachaud, C. (2015). Rele-vant body cues for the classification of emotional body expression in daily actions. In Affective Computing and Intelligent Interaction (ACII), 2015 International Conference on, pages 267–273. IEEE.
[Heeter, 1992] Heeter, C. (1992). Being there: The subjective experience of presence. Presence: Teleoperators & Virtual Environments, 1(2):262–271. [Hendrix and Barfield, 1996] Hendrix, C. and Barfield, W. (1996). Presence within virtual environments as a function of visual display parameters. Presence: Teleoperators & Virtual Environments, 5(3):274–289.
[Ijsselsteijn, 2002] Ijsselsteijn, W. A. (2002). Elements of a multi-level the-ory of presence: Phenomenology, mental processing and neural correlates. Proceedings of PRESENCE, 2002:245–259.
[Laarni et al., 2015] Laarni, J., Ravaja, N., Saari, T., Böcking, S., Hart-mann, T., and Schramm, H. (2015). Ways to measure spatial presence: Review and future directions. In Immersed in Media, pages 139–185. Springer.
[Lessiter et al., 2001] Lessiter, J., Freeman, J., Keogh, E., and Davidoff, J. (2001). A cross-media presence questionnaire: The itc-sense of presence inventory. Presence: Teleoperators and virtual environments, 10(3):282– 297.
[Maïano et al., 2011] Maïano, C., Therme, P., and Mestre, D. (2011). Af-fective, anxiety and behavioral effects of an aversive stimulation during a simulated navigation task within a virtual environment: A pilot study. Computers in Human Behavior, 27(1):169–175.
[Mestre, 2015] Mestre, D. R. (2015). On the usefulness of the concept of presence in virtual reality applications. In IS&T/SPIE Electronic Imaging, pages 93920J–93920J.
[Ochs et al., 2018] Ochs, M., Mestre, D., de Montcheuil, G., Pergandi, J.-M., Saubesty, J., Lombardo, E., Francon, D., and Blache, P. (2018). Training doctors’ social skills to break bad news: Evaluation of the impact of virtual environment displays on the sense of presence. Journal on Multimodal User Interfaces (JMUI), (to appear).
[Ochs et al., 2017] Ochs, M., Montcheuil, G., Pergandi, J.-M., Saubesty, J., Donval, B., Pelachaud, C., Mestre, D., and Blache, P. (2017). An archi-tecture of virtual patient simulation platform to train doctor to break bad news. In International Conference on Computer Animation and Social Agents (CASA).
[Pelachaud, 2009] Pelachaud, C. (2009). Studies on gesture expressivity for a virtual agent. Speech Communication, 51(7):630–639.
[Rauzy et al., 2014] Rauzy, S., Montcheuil, G., and Blache, P. (2014). Marsatag, a tagger for french written texts and speech transcriptions. In Proceedings of Second Asian Pacific Corpus linguistics Conference, page 220.
[Saubesty and Tellier, ] Saubesty, J. and Tellier, M. Multimodal analysis of hand gesture back-channel feedback. In Gesture and Speech in Interaction, Nantes, France.
[Schubert et al., 2001] Schubert, T., Friedmann, F., and Regenbrecht, H. (2001). The experience of presence: Factor analytic insights. Presence: Teleoperators and virtual environments, 10(3):266–281.
[Schubert, 2003] Schubert, T. W. (2003). The sense of presence in virtual environments: A three-component scale measuring spatial presence, in-volvement, and realness. Zeitschrift für Medienpsychologie, 15(2):69–71.
[Slater et al., 1996] Slater, M., Linakis, V., Usoh, M., Kooper, R., and Street, G. (1996). Immersion, presence, and performance in virtual en-vironments: An experiment with tri-dimensional chess. In ACM virtual reality software and technology (VRST), volume 163, page 72. ACM Press New York, NY.
[Slater et al., 2006] Slater, M., Sadagic, A., Usoh, M., and Schroeder, R. (2006). Small-group behavior in a virtual and real environment: A com-parative study. Small-Group Behavior, 9(1).
[Slater and Steed, 2000] Slater, M. and Steed, A. (2000). A virtual presence counter. Presence: Teleoperators & Virtual Environments, 9(5):413–434.
[Slater and Wilbur, 1997] Slater, M. and Wilbur, S. (1997). A framework for immersive virtual environments (five): Speculations on the role of pres-ence in virtual environments. Prespres-ence: Teleoperators and virtual envi-ronments, 6(6):603–616.
[Strobl et al., 2008] Strobl, C., Boulesteix, A.-L., Kneib, T., Augustin, T., and Zeileis, A. (2008). Conditional variable importance for random forests. BMC bioinformatics, 9(1):1.
[Usoh et al., 1999] Usoh, M., Arthur, K., Whitton, M. C., Bastos, R., Steed, A., Slater, M., and Brooks Jr, F. P. (1999). Walking> walking-in-place> flying, in virtual environments. In Proceedings of the 26th annual con-ference on Computer graphics and interactive techniques, pages 359–364. ACM Press/Addison-Wesley Publishing Co.
[Usoh et al., 2000] Usoh, M., Catena, E., Arman, S., and Slater, M. (2000). Using presence questionnaires in reality. Presence: Teleoperators and Vir-tual Environments, 9(5):497–503.
[Witmer and Singer, 1998] Witmer, B. G. and Singer, M. J. (1998). Measur-ing presence in virtual environments: A presence questionnaire. Presence: Teleoperators and virtual environments, 7(3):225–240.