S1
Silver(I) complexes with 4,7-phenanthroline efficient in rescuing the
zebrafish embryos of lethal Candida albicans infection
Aleksandar Pavica,#,*, Nada D. Savićb,#,*, Biljana Đ. Glišićb, Aurélien Crochetc, Sandra
Vojnovica, Atanas Kurutosd, Dalibor M. Stankoviće, Katharina M. Frommc, Jasmina Nikodinovic-Runica, Miloš I. Djuranf,*
aInstitute of Molecular Genetics and Genetic Engineering, University of Belgrade, Vojvode
Stepe 444a, 11000 Belgrade
bUniversity of Kragujevac, Faculty of Science, Department of Chemistry, R. Domanovića
12, 34000 Kragujevac, Serbia
cDepartment of Chemistry, University of Fribourg, Chemin du Musée 9, CH-1700
Fribourg, Switzerland
dInstitute of Organic Chemistry with Centre of Phytochemistry, Bulgarian Academy of
Sciences, Acad. G. Bonchev str., bl. 9, 1113 Sofia, Bulgaria
eThe Vinča Institute of Nuclear Sciences, Mike Petrovića Alasa 12-14, 11000 Belgrade,
Serbia
fSerbian Academy of Sciences and Arts, Knez Mihailova 35, 11000 Belgrade, Serbia
#A.P. and N.D.S. contributed equally.
Corresponding authors: Tel.: +381 11 397 6034; fax: +381 11 397 5808 (A. Pavic); Tel.:
+381 34 336 223; fax: +381 34 335 040 (N. D. Savić); Tel.: +381 34 300 251; fax: +381 34 335 040 (M. I. Djuran).
E-mail addresses: [email protected] (A. Pavic); [email protected] (N. D. Savić); [email protected] (M. I. Djuran).
S2 Abstract
Five novel silver(I) complexes with 4,7-phenanthroline (4,7-phen), [Ag(NO3
-O)(4,7-phen-µ-N4,N7)]n (1), [Ag(ClO4-О)(4,7-phen-µ-N4,N7)]n (2), [Ag(CF3
COO-O)(4,7-phen-µ-N4,N7)]n (3), [Ag2(H2O)0.58(4,7-phen)3](SbF6)2 (4) and {[Ag2(H2
O)(4,7-phen-µ-N4,N7)2](BF4)2}n (5) were synthesized, structurally elucidated and biologically evaluated.
These complexes showed selectivity towards Candida spp. in comparison to the tested bacteria and effectively inhibited the growth of four different Candida species, particularly of C. albicans strains, with minimal inhibitory concentrations (MICs) in the range of 2.0 – 10.0 µM. In order to evaluate the therapeutic potential of 1 – 5, in vivo toxicity studies were conducted in the zebrafish model. Based on the favorable therapeutic profiles, complexes 1, 3 and 5 were selected for the evaluation of their antifungal efficacy in vivo using the zebrafish model of lethal disseminated candidiasis. Complexes 1 and 3 efficiently controlled and prevented fungal filamentation even at sub-MIC doses, while drastically increased the survival of the infected embryos. Moreover, at the MIC doses, both complexes totally prevented C. albicans filamentation and rescued almost all infected fish of the fatal infection outcome. On the other side, complex 5, which demonstrated the highest antifungal activity in vitro, affected the neutrophils occurrence of the infected host, failed to inhibit the C. albicans cells filamentation and showed a poor potential to cure candidal infection, highlighting the importance of the in vivo activity evaluation early in the therapeutic design and development process. The mechanism of action of the investigated silver(I) complexes was related to the induction of reactive oxygen species (ROS) response in C. albicans, with DNA being one of the possible target biomolecules.
Keywords: Silver(I) complexes; Phenanthroline; DNA interaction; Candida albicans; Danio rerio; Infection model
S3 TABLE OF CONTENTS 1H NMR spectrum of 1 S6 13C NMR spectrum of 1 S7 1H NMR spectrum of 2 S8 13C NMR spectrum of 2 S9 1H NMR spectrum of 3 S10 13C NMR spectrum of 3 S11 1H NMR spectrum of 4 S12 13C NMR spectrum of 4 S13 1H NMR spectrum of 5 S14 13C NMR spectrum of 5 S15
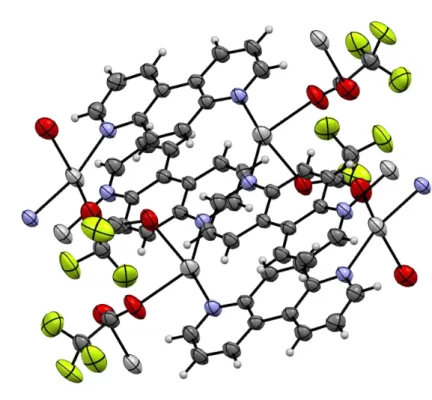
Fig. S1. An extended view of the polynuclear complex 3. S16
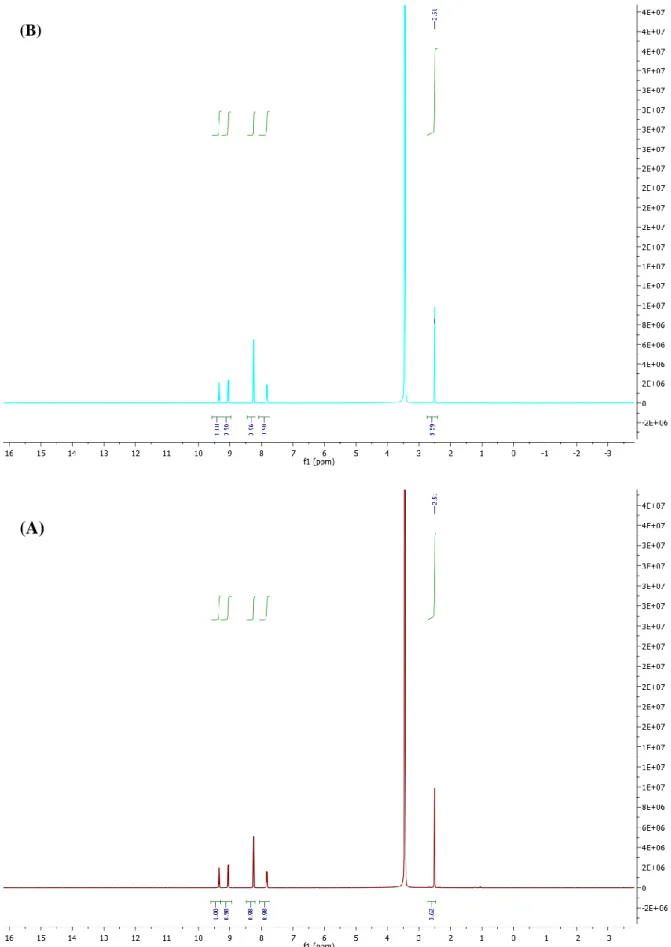
Fig. S2. Complex 4 stability over time measured by 1H NMR spectroscopy. 1H NMR spectrum was measured immediately (A) and 24 h (B) after complex dissolution in DMSO-d6.
S17
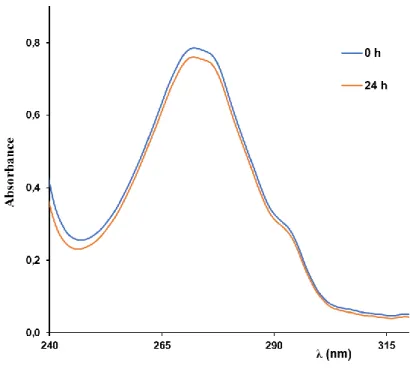
Fig. S3. Complex 4 stability over time followed by UV-Vis spectrophotometry in
DMF/RPMI medium containing 2% of glucose.
S18
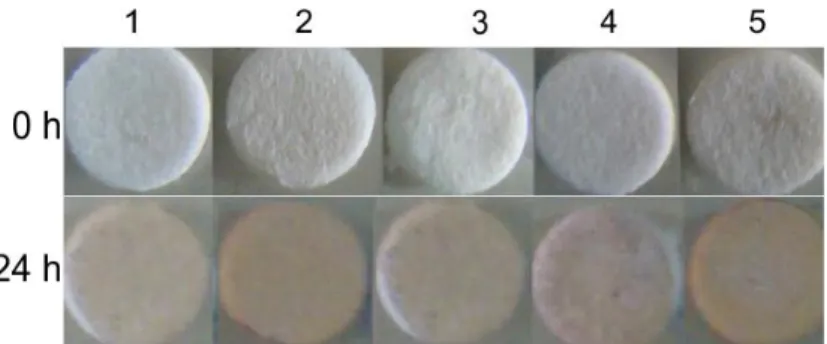
Fig. S4. The air/light stability of silver(I) complexes 1 – 5. S19
Fig. S5. (A) Absorption spectra of the silver(I) complexes 1 – 5 in Tris buffer
upon addition of DNA. Arrow shows the change of absorbance upon increasing concentration of DNA. (B) Plot of [DNA]/(εa – εf) versus [DNA].
S4
Fig. S6. (A) Fluorescence emission spectra of EthBr bound to DNA in the absence
and presence of the silver(I) complexes in Tris buffer at 25 oC. Arrow shows the change upon increasing concentration of complex. (B) Stern-Volmer plots of relative EthBr-DNA fluorescence intensity F0/F vs [complex].
S22-S23
Fig. S7. Plot of log(F0 - F)/F vs log[complex]. S24
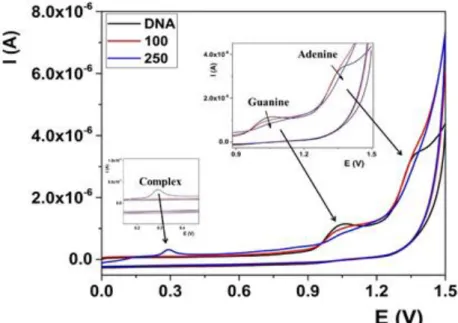
Fig. S8. CV voltammograms of DNA after addition of complex 4 in the
concentrations range from 0 to 250 ppm.
S25
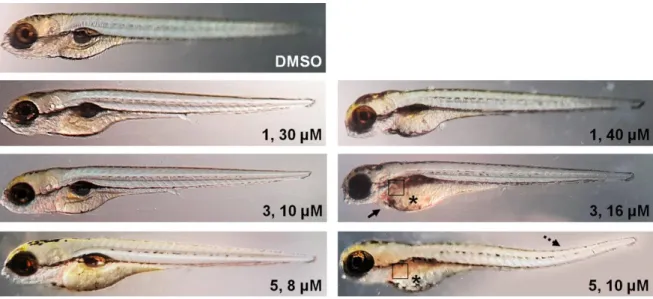
Fig. S9. Toxicity evaluation of silver(I) complexes 1, 3 and 5 in the zebrafish
model. The normally developed fish are shown on the left panel of photos including the control one (DMSO-treated), while the affected (teratogenic) fish are shown on the right panel. In comparison to the untreated fish, the teratogenic fish upon complexes showed signs of weak hepatotoxicity – slightly darker liver (boxed area), weakly absorbed the yolk (asterics) and shorter body, had weak pericardial edema (arrow) and lordosys (dashed arrea).
S26
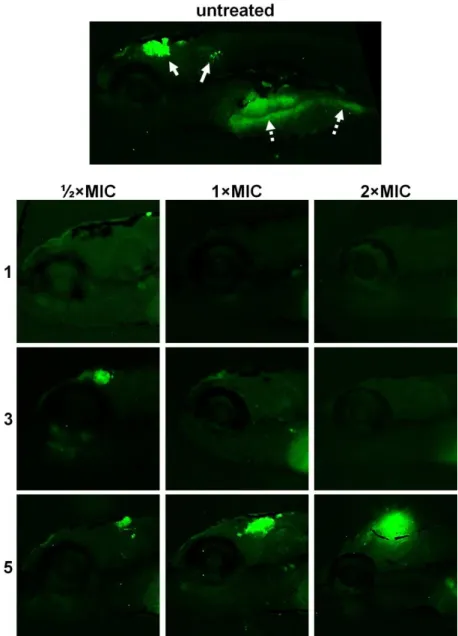
Fig. S10. Eradication of C. albicans infection from the body of zebrafish larvae
after the 3 days treatments with different doses (½×MIC, 1×MIC and 2×MIC) of silver(I) complexes 1, 3 and 5. In the untreated embryos at 3 dpi (120 hpf), fungal infection has mainly been localized in the head (arrow) and the intestine (dashed arrow). Complexes 1 and 3 successfully inhibited fungal filamentation by 4 dpi at any applied dose, while the treatment with 5 resulted in the filamentation increase with complex’s concentration increase.
S27
Table S1
Details of the crystal structure determinations of the silver(I) complexes 1 – 5.
S5 Table S2
Lethal and teratogenic effects observed in zebrafish (Danio rerio) embryos at different hours post fertilization (hpf).
S29
Table S3
Selected bond distances (Å) and valence angles (o) in silver(I) complexes 1 – 5.
S30
Table S4
Hydrogen bond parameters for silver(I) complexes 4 and 5.
S31
Table S5
Values of binding constants of silver(I) complexes 1 – 5 with DNA.
S6 1H NMR (400 MHz, DMF-d 7) DMF HOD DMF DMF N N Ag ONO2 [Ag(NO3-O)(4,7-phen-µ-N4,N7)]n (1)
S7 13C NMR (101 MHz, DMF-d 7) DMF DMF DMF N N Ag ONO2 [Ag(NO3-O)(4,7-phen-µ-N4,N7)]n (1)
S8 1H NMR (400 MHz, DMF-d 7) DMF DMF DMF HOD N N Ag OClO3 [Ag(ClO4-О)(4,7-phen-µ-N4,N7)]n (2)
S9 DMF DMF DMF N N Ag OClO3 [Ag(ClO4-О)(4,7-phen-µ-N4,N7)]n (2) 13C NMR (101 MHz, DMF-d 7)
S10 1H NMR (400 MHz, DMF-d 7) DMF DMF DMF HOD N N Ag OCOCF3 [Ag(CF3COO-O)(4,7-phen-µ-N4,N7)]n (3)
S11 13C NMR (101 MHz, DMF-d 7) [Ag(CF3COO-O)(4,7-phen-µ-N4,N7)]n (3) N N Ag OCOCF3 DMF DMF DMF
S12 1H NMR (400 MHz, DMF-d 7) N N N N N N Ag Ag OH2 2SbF6 -[Ag2(H2O)0.58(4,7-phen)3](SbF6)2 (4) DMF DMF DMF
S13 13C NMR (101 MHz, DMF-d 7) N N N N N N Ag Ag OH2 2SbF6 -[Ag2(H2O)0.58(4,7-phen)3](SbF6)2 (4) DMF DMF DMF
S14 1H NMR (400 MHz, DMF-d 7) {[Ag(4,7-phen)][Ag(4,7-phen)(H2O)](BF4)}n (5) N N N N Ag H2O N Ag 2BF4 -DMF DMF DMF HOD {[Ag2(H2O)(4,7-phen-µ-N4,N7)2](BF4)2}n (5)
S15 13C NMR (101 MHz, DMF-d 7) {[Ag(4,7-phen)][Ag(4,7-phen)(H2O)](BF4)}n (5) N N N N Ag H2O N Ag 2BF4- DMF DMF DMF {[Ag2(H2O)(4,7-phen-µ-N4,N7)2](BF4)2}n (5)
S16
S17
Fig. S2. Complex 4 stability over time measured by 1H NMR spectroscopy. 1H NMR spectrum was measured immediately (A) and 24h (B) after complex dissolution in
DMSO-d6.
(A)
S18
Fig. S3. Complex 4 stability over time followed by UV-Vis spectrophotometry in
S19
S21
Fig. S5. (A) Absorption spectra of the silver(I) complexes 1 – 5 in Tris buffer upon
addition of DNA. Arrow shows the change of absorbance upon increasing concentration of DNA. (B) Plot of [DNA]/(εa – εf) versus [DNA].
S23
Fig. S6. (A) Fluorescence emission spectra of EthBr bound to DNA in the absence and
presence of the silver(I) complexes in Tris buffer at 25 oC. Arrow shows the change upon increasing concentration of complex. (B) Stern-Volmer plots of relative EthBr-DNA fluorescence intensity F0/F vs [complex].
S24
S25
Fig. S8. CV voltammograms of DNA after addition of complex 4 in the concentrations
S26
Fig. S9. Toxicity evaluation of silver(I) complexes 1, 3 and 5 in the zebrafish model. The
normally developed fish are shown on the left panel of photos including the control one (DMSO-treated), while the affected (teratogenic) fish are shown on the right panel. In comparison to the untreated fish, the teratogenic fish upon complexes showed signs of weak hepatotoxicity – slightly darker liver (boxed area), weakly absorbed the yolk (asterics) and shorter body, had weak pericardial edema (arrow) and lordosys (dashed arrea).
S27
Fig. S10. Eradication of C. albicans infection from the body of zebrafish larvae after the 3
days treatments with different doses (½×MIC, 1×MIC and 2×MIC) of silver(I) complexes
1, 3 and 5. In the untreated embryos at 3 dpi (120 hpf), fungal infection has mainly been
localized in the head (arrow) and the intestine (dashed arrow). Complexes 1 and 3 successfully inhibited fungal filamentation by 4 dpi at any applied dose, while the treatment with 5 resulted in the filamentation increase with complex’s concentration increase.
S28 Table S1
Details of the crystal structure determinations of the silver(I) complexes 1 – 5.
1 2 3 4 5
Empirical formula C12H8AgN3O3 C12H8AgClN2O4 C14H8AgF3N2O2 C36H25.15Ag2F12N6O0.58Sb2 C24H18Ag2B2F8N4O
CCDC number 1879001 1879002 1879003 1879004 1880758
Formula weight (g/mol) 350.08 387.52 401.09 1238.21 767.78
Crystal system, space group monoclinic, P21/c monoclinic, P21/c monoclinic, P21/c triclinic, Pī triclinic, Pī
a (Å) 10.7794(15) 10.2659(6) 11.7244(14) 10.7878(8) 7.1974(4) b (Å) 14.485(2) 14.6602(11) 14.7916(16) 12.1188(8) 11.8682(6) c (Å) 7.320(2) 7.9925(7) 7.4544(9) 14.5250(10) 15.0708(8) (°) 82.918(5) 79.146(4) (°) 100.585(17) 97.922(6) 95.644(10) 88.316(6) 76.397(4) (°) 85.176(6) 82.976(4) V (Å3) 1123.5(4) 1191.39(15) 1286.5(3) 1877.4(2) 1224.75(12) F000 688 760 784 1184 748 4 4 4 2 2
X-radiation, /Å Mo-Kα 0.71073 Mo-Kα 0.71073 Mo-Kα 0.71073 Mo-Kα 0.71073 Mo-Kα 0.71073
data collect. temperat. /K 298(2) 250(2) 298(2) 250(2) 200(2)
Calculated density (Mg/m3) 2.070 2.160 2.071 2.190 2.082
Absorption coefficient (mm-1) 1.801 1.931 1.612 2.551 1.689
Crystal size (mm3) 0.64 × 0.26 × 0.02 0.38 x 0.167 x 0.04 0.39 × 0.17 × 0.05 0.37 × 0.183 × 0.07 0.30 × 0.15 × 0.06
range (°) 3.8 to 50.5 4.0 to 50.5 3.4 to 50.6 2.8 to 50.5 3.5 to 50.2
index ranges h, k, l -12 ... 12, -17 ... 17, -8 ... 8 -12 … 12, -17… 17, -9 ... 9 -14 ... 13, -17 ... 17, -8 ... 8 -12 ... 12, -14 ... 14, -17 ... 17 -8 ... 8, -14 ... 14, -17 ... 17 No. of collected and independent
reflections
12782, 2013 12271, 2126 16077, 2296 6286, 6286 13046, 4351
Rint 0.0684 0.0371 0.1070 0.0391
Data / restraints / parameters 2013 / 0 / 172 2126 / 0 / 181 2296 / 0 /199 6286 / 57 / 408 4351 / 3 / 376
Goodness-on-fit on F2 1.040 1.034 1.055 1.041 1.045 Final R indices [I ≥ 2(I)] 0.0362, 0.0727 0.0232, 0.0546 0.0346, 0.0800 0.0929, 0.2586 0.0237, 0.0628 Final R indices (all data) 0.0543, 0.0779 0.0348, 0.0579 0.0497, 0.0888 0.1125, 0.2837 0.0268, 0.0645
S29 Table S2
Lethal and teratogenic effects observed in zebrafish (Danio rerio) embryos at different hours post fertilization (hpf).
aNo clear organs structure is recognized.
bMalformation of eyes was recorded for the retardation in eye development and abnormality in
shape and size.
cPresence of none, one or more than two otoliths per sacculus, as well as reduction and enlargement
of otoliths and/or sacculi (otic vesicles).
dTail malformation was recorded when the tail was bent, twisted or shorter than to control embryos
as assessed by optical comparation.
eGrowth retardation was recorded by comparing with the control embryos in a body length (after
hatching, at and onwards 72 hpf) using by optical comparation using an inverted microscope (CKX41; Olympus, Tokyo, Japan).
Category Developmental endpoints Exposure time (hpf) 48 72 96 120
Lethal effect Coagulated eggs ● ● ● ●
Lack of the heart beating ● ● ● ●
Teratogenic effect Malformation of head ● ● ● ●
Malformation of eyes ● ● ● ● Malformation of sacculi/otoliths ● ● ● ● Malformation of chorda ● ● ● ● Malformation of tail ● ● ● ● Scoliosis ● ● ● ● Yolk edema ● ● ● ● Yolk deformation ● ● ● ● Growth retardation ● ● ● Hatching ● ●
Cardiotoxicity Pericardial edema ● ● ●
Heart morphology ● ●
S30 Table S3
Selected bond distances (Å) and valence angles (o) in silver(I) complexes 1 – 5.
1 2 3 4 5
Ag1—N1 2.274(3) Ag1—N1 2.196(2) Ag1—N1 2.239(3) Ag1—N3 2.111(15) Ag1—N3 2.168(2)
Ag1—N2 2.268(3) Ag1—N2i 2.193(2) Ag1—N2 2.254(3) Ag1—N2 2.102(13) Ag1—N1 2.170(2)
Ag1—O3 2.544(4) Ag1—O1 2.571(2) Ag1—O1 2.440(3) Ag2—O1 2.43(2) Ag2—N4 2.161(2)
Ag1—O1 3.495(5) Ag1—O2iii 2.635(4) Ag2—N4 2.135(14) Ag2—N2iv 2.171(2)
Ag1—O2’ 2.739(6) Ag2—N5 2.155(11) Ag2—O1 2.631(2)
Ag1—O3’ 2.759(6)
N1—Ag1—N2 139.34(12) N2i—Ag1—N1 150.98(9) N1—Ag1—N2 144.95(12) N2—Ag1—N3 175.4(5) N1—Ag1—N3 165.01(8) N1—Ag1—O3 113.16(12) N2i—Ag1—O1 110.70(9) N1—Ag1—O1 124.22(12) N4—Ag2—O1 93.8(6) N2iv—Ag2—N4 162.57(8) N2—Ag1—O3 92.34(13) N1—Ag1—O1 86.10(9) N2—Ag1—O1 89.78(12) N4—Ag2—N5 167.7(5) C1—N1—Ag1 119.40(17) C1—N1—Ag1 120.9(3) C1—N1—Ag1 120.2(2) N1—Ag1—O2iii 84.49(11) N5—Ag2—O1 98.5(6) C5—N1—Ag1 121.88(16) C5—N1—Ag1 121.4(2) C5—N1—Ag1 120.44(18) N2—Ag1—O2iii 107.51(12) C13—N3—Ag1 121.0(10) C12—N2—Ag2v 121.07(19) C12—N2—Ag1 119.2(3) C12—N2—Ag1ii 120.3(2) O1—Ag1—O2iii 87.43(13) C17—N3—Ag1 122.1(12) C8—N2—Ag2v 120.30(17) C8—N2—Ag1 121.3(3) C8—N2—Ag1ii 121.67(19) C1—N1—Ag1 120.5(3) C12—N2—Ag1 119.2(11) C13—N3—Ag1 118.75(18) N3—O3—Ag1 123.2(3) Cl1—O1—Ag1 125.91(14) C5—N1—Ag1 121.1(2) C8—N2—Ag1 124.1(11) C17—N3—Ag1 122.34(16) C12—N2—Ag1 117.6(3) C20—N4—Ag2 124.5(12) C24—N4—Ag2 120.67(18) C8—N2—Ag1 123.2(2) C24—N4—Ag2 119.4(10) C20—N4—Ag2 120.59(16) C25—O1—Ag1 147.4(3) C25—N5—Ag2 118.9(10)
C25—O2iii—Ag1 117.1(3) C29—N5—Ag2 123.1(10)
BVSAg1 0.97 BVSAg1 1.32 BVSAg1 1.01 BVSAg1 0.97 BVSAg1 0.84
BVSAg2 1.13 BVSAg2 1.39
S31 Table S4
Hydrogen bond parameters for silver(I) complexes 4 and 5.
D–H [Å] D···A [Å] H···A [Å] D-H···A [°] Symmetry codes
4 O1–H1A···N1 0.87(2) 2.66(3) 1.944(17) 139.4(18) +x, +y, -1+z O1–H1B···N1 0.91(2) 3.16(3) 2.360(19) 147.1(19) 1-x, 2-y, 2-z 5 O1–H1B···F7 0.832(18) 2.897(3) 2.12(2) 155(3) 2-x, 1-y, 1-z O1–H1B···F5 0.832(18) 3.054(3) 2.34(3) 144(3) x+1, y, z-1 O1–H1A···F3 0.826(18) 2.753(3) 1.928(19) 176(4) -x+2, -y+1, -z+1
S32 Table S5
Values of binding constants of silver(I) complexes 1 – 5 with DNA.
UV-Vis titration Fluorescent titration
Complex Kb (M-1) ΔGo (kcal/mol) Кsv (M-1) Hypochromism (%) Кq (M-1/s) KA (M-1) n 1 1.03.104 -5.5 (2.62 ± 0.10).103 19.7 2.62.1011 4.23.104 1.30 2 1.22.103 -4.2 (1.72 ± 0.05).103 13.0 1.72.1011 9.56.103 1.18 3 7.00.103 -5.2 (2.65 ± 0.05).103 20.8 2.65.1011 2.78.103 1.01 4 3.74.103 -4.9 (2.06 ± 0.10).103 13.7 2.06.1011 1.12.103 0.92 5 1.20.104 -5.5 (3.23 ± 0.06).103 24.6 3.23.1011 1.47.103 0.91
![Fig. S7. Plot of log(F 0 - F)/F vs log[complex].](https://thumb-eu.123doks.com/thumbv2/123doknet/14810096.610842/24.893.66.871.123.997/fig-s-plot-log-f-f-log-complex.webp)