DETERMINATION OF CONTACT ANGLE FROM RAW MATERIAL PROPERTIES USING
LINEAR MULTIVARIABLE ANALYSIS
Arunima Sarkar1, Duygu Kocaefe1, Yasar Kocaefe1, Dipankar Bhattacharyay1, Brigitte Morais2, Charles-Luc Lagacé2 1UQAC/Aluminerie Alouette Research Chair on Carbon University of Québec at Chicoutimi,
555, boul. De l’Université, Chicoutimi, Québec, Canada G7H2B1
2Aluminerie Alouette Inc., 400, Chemin de la Pointe-Noire, C.P. 1650, Sept-Îles, Québec, Canada, G4R 5M9 Keywords: Contact angle, petroleum coke, pitch, chemical compositions, linear regression
Abstract
Carbon anodes are made by baking a compacted mixture of calcined petroleum coke, recycled anodes and butts, and coal-tar pitch. Pitch is utilized as a binder for the dry aggregate. Good interaction between coke and pitch is essential for the generation of a satisfactory bond between them, and the contact angle is a measure of this interaction. A program was developed using the linear multivariable analysis to predict the contact angle for a given coke/pitch pair at different times. Normalized coke and pitch properties and their corresponding contact angles were used to train the program. The precision of the model depends on the amount of data available for training. The value and the sign of the weighting factors indicate the effect of the input parameters on the contact angle. The model gives information on the effect of raw material properties such as composition and impurities on the contact angle.
Introduction
The ability to predict unknown physical properties of coke/pitch from their chemical properties is of great interest in all aspects of their interaction during anode preparation. For example, predictive methods can be used in trained systems when experimental knowledge of physical properties or time is limited, as is often the case in the anode manufacturing process. In such programs, even some qualitative knowledge of (predicted) physical properties would be helpful in planning formulation studies and developing recipes. Such statistical methods are commonly used to predict the contact angle of pharmaceutical solids, which provide useful information for these industries [1-3]. A similar approach has been taken to predict the contact angle of pitch on coke. Predicting surface energies of coke is of great interest since surface interactions are important in determining and understanding the performance of carbon anodes. One way to study and determine the surface properties of a petroleum coke is by predicting the contact angle values which provide information on surface energies and wettability. The prediction of contact angle helps understand coke-pitch interaction and prepare a better paste formulation. Penetration and carbonization of pitch in coke pores affect the anode properties. Understanding pitch/coke wetting and consequently their interactions allows the formulation of better mixing conditions during paste preparation.
The wetting behavior of raw materials are influenced by their properties such as porosity, bulk density, surface functional groups, and impurities for coke and surface tension, viscosity, quinolone insoluble (QI) and mesophase contents for pitch.
In this study, the effect of surface composition and impurities in raw materials are considered. Lahaye et al. [4] studied the correlation between surface chemical functional groups of coke and the wetting behavior of coke by coal-tar pitch. Adams [5] found that the carboxyl, lactonic, and phenolic functional groups are present in coke surface, and these oxygen-containing surface functional groups predominate the wetting. Oxygen-containing functional groups are easy to decompose during reaction and helps in chemical wetting.
Different authors studied X-ray Photoelectron spectroscopy (XPS) spectra of green petroleum coke and carbonaceous materials and found that the petroleum coke and carbonaceous materials contain mostly carbon. Other than carbon, they contain oxygen, nitrogen, sulfur, calcium, and sodium [6-9]. Different impurities of coke and pitch have an effect on anode reactivity as well as interactions between coke and pitch.
The aim of this study was to establish a model that can predict different pitch contact angles for different petroleum cokes at two different times by using linear multivariable analysis. The contact angle measured at 80s was taken as the initial contact angle since it takes time for the drop to stabilize whereas the contact angle at 1500s was taken as the final contact angle. A linear multivariable analysis was carried out to identify the effect of individual properties of raw materials on their wettability and interaction. Raw material surface compositions are measured by XPS, and impurity concentrations in coke and pitch were provided by the suppliers. Contact angles were measured by the sessile-drop technique, and results were used to train the system. Thereafter, a predictive model was developed, and its predictive capabilities were tested and discussed.
Materials and Methods Raw Material Properties
Eight different cokes and seven different pitches were used as raw material. Each coke and pitch is paired to measure the contact angle at 170°C. Surface chemical compositions of raw materials were measured by XPS which is a quantitative technique to measure the elemental composition of the material surface. The sample is irradiated with mono-energetic x-rays causing photoelectrons to be emitted from the sample surface. An electron energy analyzer determines the binding energy of the photoelectrons. From the binding energy and intensity of a photoelectron peak, the elemental identity, chemical state, and quantity of an element are determined. Database for raw material impurities is taken from suppliers certificates. All the data are
normalized before analysis. Chemical composition and impurities of coke and pitch is shown in Table 1 and Table 2, respectively.
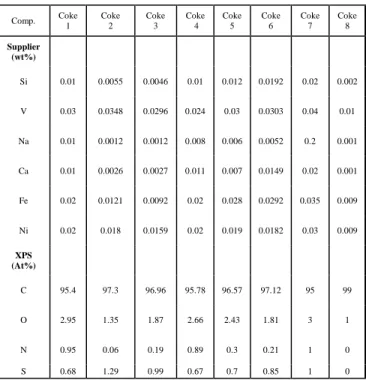
Table 1. Surface chemical compositions and impurities of calcined petroleum cokes used
Comp. Coke 1 Coke 2 Coke 3 Coke 4 Coke 5 Coke 6 Coke 7 Coke 8 Supplier (wt%) Si 0.01 0.0055 0.0046 0.01 0.012 0.0192 0.02 0.002 V 0.03 0.0348 0.0296 0.024 0.03 0.0303 0.04 0.01 Na 0.01 0.0012 0.0012 0.008 0.006 0.0052 0.2 0.001 Ca 0.01 0.0026 0.0027 0.011 0.007 0.0149 0.02 0.001 Fe 0.02 0.0121 0.0092 0.02 0.028 0.0292 0.035 0.009 Ni 0.02 0.018 0.0159 0.02 0.019 0.0182 0.03 0.009 XPS (At%) C 95.4 97.3 96.96 95.78 96.57 97.12 95 99 O 2.95 1.35 1.87 2.66 2.43 1.81 3 1 N 0.95 0.06 0.19 0.89 0.3 0.21 1 0 S 0.68 1.29 0.99 0.67 0.7 0.85 1 0
Table 2. Surface chemical compositions and impurities of coal tar pitches used
Comp(%) Pitch 1 Pitch 2 Pitch 3 Pitch 4 Pitch 5 Pitch 6 Pitch 7
Supplier Si 0.0091 0.0085 0.0127 0.0099 0.0113 0.0094 0.0250 V 0.0000 0.0000 0.0000 0.0000 0.0000 0.0000 0.0000 Na 0.0108 0.0094 0.0111 0.0108 0.0105 0.0130 0.0100 Ca 0.0029 0.0037 0.0028 0.0028 0.0044 0.0027 0.0096 Fe 0.0122 0.0109 0.0124 0.0120 0.0112 0.0101 0.0153 Ni 0.0000 0.0000 0.0000 0.0000 0.0000 0.0000 0.0000 Pb 0.0134 0.0141 0.0126 0.0157 0.0172 0.0176 0.0147 Zn 0.0192 0.0191 0.0183 0.0200 0.0233 0.0202 0.0197 XPS C 93.02 97.12 96.78 97.32 98.52 98.73 98.49 O 3.95 1.89 1.59 1.44 1.58 0.19 0.68 N 3.2 0.86 1.46 1.19 0.03 0.95 0.69 S 0.26 0.13 0.17 0.06 0.03 0.13 0.14
Contact Angle Test
The wettability of calcined coke by molten pitch drop can be characterized with the contact angle formed between the molten pitch drop and a coke bed. Wetting can be physical or chemical.
With an increase in temperature and time, contact angle decreases. The first widely accepted correlation between interfacial tension and contact angle for a liquid drop on a solid surface is expressed by the Young equation proposed by Young in 1805 [10].
γsv = γsl + γlv . cos θ (1) where γsv is the interfacial tension of the solid-vapor interface γsl is the interfacial tension of the solid-liquid interface, γlv is the interfacial tension of the liquid-vapor interface, and θ is the contact angle. γlv is also known as surface tension. These phases meet at a point called the triple point. The force balance given by the Young equation [10] at the triple point (Equation 1) determines the wettability of a solid phase by a liquid phase in the presence of a vapor phase. Figure 1 defines the contact angle and the wettability of liquid/solid systems.
Figure 1. Schematic representation of wetting
The experimentally measured pitch contact angle values for the cokes were obtained from the sessile-drop tests. In the sessile drop method, a drop of liquid pitch is formed on the particle bed of the test material at 170°C. The dynamic contact angle is determined by using video, and the contact angle is measured from the image using FTA 32 software [4, 11-15]. Inert nitrogen atmosphere is maintained during the experiment.
Substrate preparation: Coke particles were grounded, and an average particle size of 125 µm was used for the wetting tests. This particle size was also used by other researchers [14]. The particles were compacted to have a flat coke bed surface.
Linear Multivariable Analysis
A linear multivariable analysis was performed to identify the effect of individual properties of raw materials on wetting characteristics between the liquid and the solid. The basic concept behind the analysis is to express a property θ (contact angle) as a linear function of different independent parameters (X1, X2……XN), i.e. ∑ = = N i 1AiXi θ (2)
where Ai represents the coefficient associated with the value of an independent parameter i. If the sign of the coefficient Ai is positive, then it may be assumed that the change in property ‘i’ is proportional to the contact angle of coke/pitch (θ). On the other hand, if the coefficient Ai is negative then it may be assumed that the change in property ‘i’ is inversely proportional to the contact
angle of coke/pitch (θ). The absolute value of the coefficient gives an idea about the extent of contribution of the property ‘i’ to the contact angle (θ). If N is the total number of independent variables and M is the total number of experimental observations, then the input matrix B will be:
= M N, Z ... M 2, Z M 1, Z ... ... ... ... N,2 Z ... 2,2 Z 1,2 Z N,1 Z ... 2,1 Z 1,1 Z B (3)
where, Zi,j denotes the value of input parameter i for observation number j. For M observations, the matrix for the property θ (contact angle) is represented as
= M K ... ... 2 K 1 K C (4)
where Kj denotes the value of contact angle θ at observation number j. P is the matrix of coefficients defined as:
= N A ... ... 2 A 1 A P (5)
and it is calculated from:
P=(BTB)−1C (6) Though the method may not be highly accurate for all cases as there may not always be a linear relationship, it can still give an indication of the influence of a single independent parameter on the value of a dependent parameter. MATLAB®10 was used to solve the matrices.
Results and Discussions
A model was developed based on the solution of above equations (LMV model). It was applied to two cases: the prediction of initial contact angles (measured at 80s) and final contact angles (measured at 1500s) for the same system of coke-pitch pairs. In each case, some of the data sets (called the training sets) were used to determine the coefficients (weighting factors for input variables); and using these coefficients, the contact angles were calculated with the LMV model for the same sets to determine the quality and the predictive power of the model by comparing with the used experimental data. Then, the remaining data sets (called the test sets) were used to test again the quality as well as the extrapolative power of the model since these data have not been used to determine the coefficients. Raw material chemical compositions and impurities were taken as input parameters. Several calcined petroleum cokes and coal tar pitches were considered in the training of the model.
The full dataset for each case was divided into two groups: 40 data sets for training and 2 data sets for testing. The relationship between the experimental contact angle and the chemical compositions were determined. The measured and predicted
contact angles using only the training data sets for both cases are presented in Table 3.
Table 3. Experimental and calculated values of the initial and final contact angles for coke-pitch pairs using the training data sets Coke Pitch Exp.
FCA1 Calc. FCA2 Exp. ICA3 Calc. ICA4 Coke 1 Pitch 1 18.37 14.71 83.1 58.75 Coke 1 Pitch 2 12.26 13.08 81.86 67.29 Coke 1 Pitch 3 24.33 21.18 73.9 67.71 Coke 1 Pitch 4 21.54 21.17 73.12 65.45 Coke 1 Pitch 5 25.13 21.79 62.05 57.13 Coke 2 Pitch 1 47.745 46.45 78.9 77.13 Coke 2 Pitch 2 43.16 44.82 83.05 85.66 Coke 2 Pitch 3 48.07 52.93 78.15 86.08 Coke 2 Pitch 4 41.30 52.92 82.32 83.82 Coke 3 Pitch 1 35.92 30.03 83.34 74.93 Coke 3 Pitch 2 20.49 28.40 78.15 83.46 Coke 3 Pitch 3 36.68 36.50 85.05 83.88 Coke 3 Pitch 4 37.94 36.49 75.12 81.62 Coke 3 Pitch 5 37.5 37.11 75.54 73.31 Coke 4 Pitch 1 22.05 21.02 75.12 70.74 Coke 4 Pitch 2 15.95 19.39 76.67 79.27 Coke 4 Pitch 3 29.14 27.49 77.6 79.69 Coke 4 Pitch 4 27.89 27.48 76.56 77.43 Coke 4 Pitch 5 28.44 28.10 70.29 69.11 Coke 5 Pitch 1 28.49 23.50 78.12 72.02 Coke 5 Pitch 2 36.53 21.88 79.18 80.55 Coke 5 Pitch 4 39.02 29.97 80.13 78.71 Coke 5 Pitch 5 29.18 30.59 67.78 70.39 Coke 6 Pitch 1 29.33 26.05 78.23 72.27 Coke 6 Pitch 2 23.59 24.42 78.12 80.80 Coke 6 Pitch 3 32.41 32.53 83.88 81.22 Coke 6 Pitch 4 32.85 32.52 78.74 78.96 Coke 6 Pitch 5 30.47 33.13 64.93 70.64 Coke 1 Pitch 6 0 2.41 0 32.10 Coke 5 Pitch 6 0 11.21 47.5 45.36 Coke 2 Pitch 6 43.34 34.16 64.62 50.47 Coke 1 Pitch 7 0 7.29 35.42 61.03 Coke 5 Pitch 7 0 16.08 68.62 74.30 Coke 2 Pitch 7 46.68 39.03 75.53 79.41 Coke 7 Pitch 6 0 1.29 38.6 21.95 Coke 8 Pitch 6 0 -5.72 0 0.84 Coke 7 Pitch 7 21.03 6.16 57.73 50.89 Coke 8 Pitch 7 0 -0.85 58.1 29.77 Coke 7 Pitch 1 0 13.58 25.12 48.61 Coke 8 Pitch 1 0 6.57 0 27.49
1Experimental Final Contact Angle 2Calculated Final Contact Angle 3Experimental Initial Contact Angle 4Calculated Initial Contact Angle
Initial Contact Angles (at 80s)
The calculated vs. experimental initial contact angle values for the training and test sets are illustrated in Figure 2. The predictions of the initial contact angle by the LMV model are quite satisfactory for both training and test sets (see Table 3 and Figure 2). The standard deviation of predicted errors (SDPE) is 11.64°. In the ideal case, the R2 value should be 1 and the intercept should be 0. Use of more data for training could improve the accuracy.
Figure 2. Experimental vs. calculated values for the initial coke-pitch contact angle (at 80s).
The weighting factors (coefficients) obtained for the material properties included in the training sets for the initial contact angle are given in Figure 3.
Figure 3. Weighting factors for the correlation of coke and pitch chemical properties with the initial contact angle (at 80s)
The results in Figure 3 illustrate that the following chemical properties with large negative coefficients are: coke oxygen (O) content, pitch calcium (Ca) content, pitch lead (Pb) content, and coke silicon (Si) content. The negative coefficients indicate that these properties are inversely correlated with the contact angle and an increase in these compositions in raw materials would reduce the contact angle and improve wetting. The chemical components of raw materials that have large positive coefficients and thus increase the calculated/predicted contact angle values are: coke sulfur (S) content, coke nitrogen (N) content, coke sodium (Na) content, transition metal impurities of coke (Ni, V, Fe), and pitch oxygen (O) content. In addition, higher coke carbon content seems to increase the value of the initial contact angle (lower the wettability).
Final Contact Angles (at 1500s)
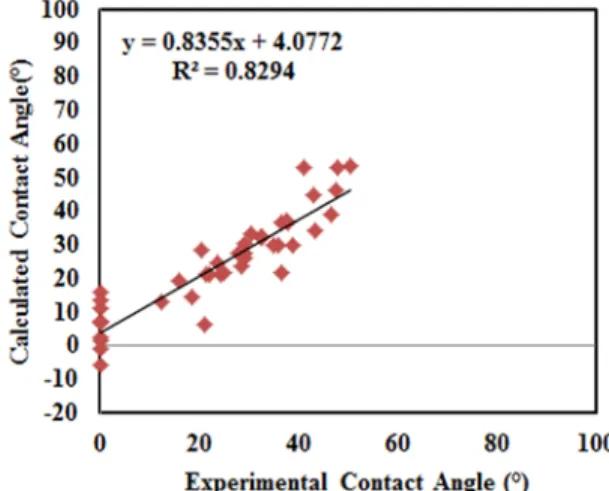
A similar procedure followed to predict the final contact angles at 1500s. The calculated and experimental final contact angle (1500s) values for both the training and test sets are given in Figure 4. The R2 value is higher and the intercept value is much lower (much closer to 0) than the previous case as seen from the Figures 2 and 4. The standard deviation of predicted errors (SDPE) for this case is 6.47°. Thus, the predictions for the second case are somewhat better. The negative values of contact angles seen in Figure 4 are due to the error in the prediction of low contact angles.
Figure 4. Experimental versus calculated values for the final coke-pitch contact angle (at 1500s).
The weighting factors (coefficients) obtained for the material properties included in the training sets for the final contact angles are shown in Figure 5.
Figure 5. Weighting factors for the correlation of coke and pitch chemical properties with final contact angle (1500s)
The LMV coefficients indicate that the most significant components which have positive coefficients and thus are proportionally correlated with the contact angle values are coke sulfur (S) content, coke vanadium (V) content, and coke nitrogen (N) content. Also, coke nickel (Ni) content, coke carbon (C) content, and pitch oxygen (O) content are correlated positively with the final contact angle. An increase in these components increases the final contact angle and reduces the wettability. The components that are inversely correlating and thus decreasing the contact angle (favors wetting) are coke oxygen (O) content, pitch lead (Pb) content, and pitch calcium (Ca) content.
Prediction of Contact Angles
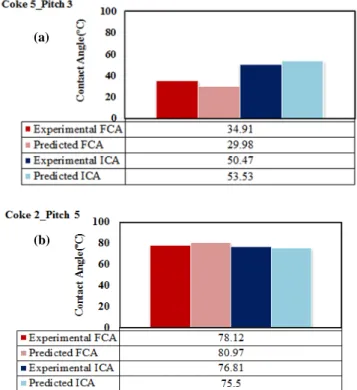
The predictive ability of the LMV model derived from the training sets was validated by using the test sets, which enables the reliable evaluation and interpretation of the model. Therefore, the results of the test sets are scrutinized in more detail. The initial and final contact angles for two test sets (one per each case) were calculated, and the results are presented in Figure 5 which gives a comparison of the experimental and predicted values.
The prediction for the initial and final contact angles is quite satisfactory. The percent maximum error for initial contact angle is 4% (3° in contact angle) and for the final contact angle is 14% (5° in contact angle).
Figure 5. Predicted values of (a) the initial contact angle and (b) the final contact angle using the test sets for the two cases
Conclusions
In this study, a model based on the linear multivariable analysis was developed to predict the initial and final contact angles for different pitch-coke pairs on the basis of their surface chemical composition and presence of impurities. The model has good predictive ability.
The model results showed that increase in the sulfur and nitrogen content in petroleum coke generally gives rise to an increase in contact angle. On the contrary, the presence of oxygen in coke as well as calcium and lead in pitch lowers the contact angle. The current predictive model, built using contact angles, demonstrates how the raw material interactions occurring during anode paste preparation could be predicted on the basis of their surface chemical properties and impurity contents without the need for further experiments.
This novel approach to study the surface characteristics of pitch and coke could have utility in evaluating the interaction potential of the constituents of different paste formulations during pre-assessment of various anode recipes. The predictive ability of the LMV model can be improved by introducing more training sets of data.
Acknowledgements
The technical and financial support of Aluminerie Alouette Inc. and the financial support of the Natural Sciences and Engineering Research Council of Canada (NSERC), Développement économique Sept-Îles, the University of Québec at Chicoutimi (UQAC), and the Foundation of the University of Québec at Chicoutimi (FUQAC) are greatly appreciated.
References
[1] W.G. Cook, I.J. Hardy, “Predictive and correlative techniques for the design, optimisation and manufacture of solid dosage forms”, Journal of Pharmacy and Pharmacology, 55 (2003), 3– 18.
[2] C.F. Lerk, A.J.F. Schoonen, J.T. Fell,“Contact angles and wetting of pharmaceutical powders”, Journal of Pharmacutical Sciences, 65 (1976), 843–847.
[3] C.F. Lerk, M. Lagas, J.P Boesltra, P. Broersma,“Contact angles of pharmaceutical powders”, Journal of Pharmacutical Sciences, 66 (1977), 1480–1481.
[4] J. Lahaye, P. Ehrburger, “Pitch-coke interactions”, Fuel, 64 (1985), 1187-1191.
[5] A.N. Adams, , H.H. Schobert, “Characterization of the surface properties of anode raw materials”, Light Metals, (2004), 495-498. [6] K.N. Tran, A.J. Berkovich, A. Tomsett, S.K. Bhatia, “Influence of sulfur and metal microconstituents on the reactivity of carbon anodes”, Energy and Fuels, 23 (2009), 1909-1924. [7] X.L. Zhang, Y. Zhang, F.S. Ding, Q.J. Huang, Y. Li, “Effect of the surface properties of an activated coke on its desulphurization performance”, Mining Science and Technology (China), 19 (2009), 769-774.
[8] R.I.R. Blyth, H. Buqa, F.P. Netzer, M.G. Ramsey, J.O. Besenhard, P. Golob, M. Winter, “XPS studies of graphite electrode materials for lithium ion batteries”, Applied Surface Science, 167 (2000), 99-106.
[9] R.I.R. Blyth, H. Buqa, F.P. Netzer, M.G. Ramsey, J.O. Besenhard, M. Winter, M., “X-ray photoemission studies of surface pre-treated graphite electrodes”, Journal of Power Source., 97-98 (2001), 171-173.
[10] Aurthur W. Adamson, Alice P. Gast, Physical chemistry of surfaces (New York, NY: John Wiley & Sons Inc 1997), 4-8. [11] A.A. Mirchi, G. Savard, J. P. Tremblay, M. Simard, “Alcan characterisation of pitch performance for pitch binder evaluation and process changes in an aluminium smelter”, Light Metals, (2002), 525-533.
(a)
[12] P. Couderc, P. Hyvernat, J. L. Lemarchand, “Correlations between ability of pitch to penetrate coke and the physical characteristics of prebaked anodes for the aluminium industry”, Fuel, 65 (1986), 281-287.
[13] V.G. Rocha, C. Blanco, R. Santamaría, E.I. Diestre, R., Menéndez, M. Granda, “Pitch/coke wetting behaviour”, Fuel, 84 (2005), 1550-1556.
[14] V.G. Rocha, C. Blanco, R. Santamaría, E.I. Diestre, R., Menéndez, M. Granda, “An insight into pitch/substrate wetting behaviour. The effect of the substrate processing temperature on pitch wetting capacity”, Fuel, 86 (2007), 1046-1052.
[15] V.G. Rocha, C. Blanco, R. Santamaría, E.I. Diestre, R., Menéndez, M. Granda, “The effect of the substrate on pitch wetting behaviour”, Fuel Processing Technology, 91 (2010), 1373-1377.