HAL Id: tel-00689788
https://tel.archives-ouvertes.fr/tel-00689788
Submitted on 20 Apr 2012
HAL is a multi-disciplinary open access archive for the deposit and dissemination of sci-entific research documents, whether they are pub-lished or not. The documents may come from teaching and research institutions in France or abroad, or from public or private research centers.
L’archive ouverte pluridisciplinaire HAL, est destinée au dépôt et à la diffusion de documents scientifiques de niveau recherche, publiés ou non, émanant des établissements d’enseignement et de recherche français ou étrangers, des laboratoires publics ou privés.
Study of the transferability of microsatellite markers
derived from bread wheat (T. aestivum) or rice ( O.
sativa) ESTs (EST-SSRs) to their close and wild relative
and evaluation of their potential for the organisation of
genetic resources in the grass family
Liyi Zhang
To cite this version:
Liyi Zhang. Study of the transferability of microsatellite markers derived from bread wheat (T. aestivum) or rice ( O. sativa) ESTs (EST-SSRs) to their close and wild relative and evaluation of their potential for the organisation of genetic resources in the grass family. Vegetal Biology. Université Blaise Pascal - Clermont-Ferrand II; Université d’Auvergne - Clermont-Ferrand I, 2006. English. �NNT : 2006CLF21650�. �tel-00689788�
Etude de la portabilité de marqueurs microsatellites issus
d’EST de blé tendre (T. aestivum) ou de riz (O.sativa) vers
des espèces apparentées et évaluation de leur intérêt pour la
structuration des ressources génétiques
chez les graminées
Année 2006
E
COLE
D
OCTORALE
DES
S
CIENCS DE LA
V
IE & DE LA
S
ANTE
T
H E S E
Présentée à l’Université Blaise Pascal
pour l’obtention du titre de
D O C T E U R D ’ U N I V E R S I T E
(Spécialité : Biologie Moléculaire Végétale)
Soutenance le 23 mai 2006Liyi ZHANG
Président :
Examinateurs:
Rapporteur :
Directeur de thèse :
U.M.R. INRA/UBP Amélioration et Santé des Plantes – INRA de Clermont-Ferrand
P. NICOLAS
M. BERNARD
P. BARRE (Invité)
D. CROUZILLAT
F. QUETIER
P. DEVAUX
P. SOURDILLE
Nod’ordre 437Study of the transferability of microsatellite markers derived
from bread wheat (T. aestivum) or rice (O. sativa) ESTs
(EST-SSRs) to their close and wild relatives and evaluation of their
potential for the organization of genetic resources
in the grass family
Année 2006
E
COLE
D
OCTORALE
DES
S
CIENCS DE LA
V
IE & DE LA
S
ANTE
T
H E S E
Présentée à l’Université Blaise Pascal
pour l’obtention du titre de
D O C T E U R D ’ U N I V E R S I T E
(Spécialité : Biologie Moléculaire Végétale)
Soutenance le 23 mai 2006Liyi ZHANG
Président :
Examinateurs:
Rapporteur :
Directeur de thèse :
U.M.R. INRA/UBP Amélioration et Santé des Plantes – INRA de Clermont-Ferrand
P. NICOLAS
M. BERNARD
P. BARRE (Invité)
D. CROUZILLAT
F. QUETIER
P. DEVAUX
P. SOURDILLE
Nod’ordre 437Cette thèse a été réalisée avec l’aide d’une bourse de China Scholarship Council (CSC) Je tiens tout d’abord à remercier Michel Beckert et Gilles Charmet, directeurs successifs de la station d’Amélioration des Plantes de l’INRA de Clermont-Ferrand, pour leur accueil au sein de leur établissement.
Mes remerciements sont adressés à Michel Bernard et Catherine Feuillet qui m’ont accueillie dans leur équipe et pour leur critique des publications.
Mes remerciements sont particulièrement adressés à Pierre Sourdille qui m’a encadrée au laboratoire et m’a aidé pour la rédaction de ma thèse et des publications avec beaucoup de patience et de façon très constructive. Nos échanges scientifiques sur les marqueurs microsatellites ont été passionnants et fructueux.
J’adresse également toute ma reconnaissance à Sylvie Bernard pour son aide pour la prononciation du français et à Philippe Leroy qui m’a initiée aux blast contre les séquences génomiques chez le riz et le blé. Merci encore à Catherine Ravel pour m’avoir aidée dans les analyses statistiques et la construction des arbres phylogénétiques et à François Balfourier pour ses conseils dans les analyses de diversité et pour la fourniture de toutes les espèces cultivées ou sauvages de graminées. Merci enfin à Christiane, Jérome et Pierre B pour leurs précieux conseils et à Gilles B et Nicolas pour m’avoir aidé à analyser les produits PCR sur Genescan et Genotyper
Une pensée toute particulière à tous ceux qui sont passés au labo BM et Génotypage, qui sont partis ou y sont encore : Bouzid, Delphine B, Cécile, Vincent, Nathalie N, Valérie, Fatou, Elisabeth, Delphine R, Etienne, Walid, Cyril, Caroline, Nathalie M, Séverine, Lydia, Pierre D, Jacqueline et Stéphane.
Merci à Pascal pour avoir arrangé beaucoup de choses et à Jeff pour le coup de main avec le PC et les problèmes d’imprimante.
Merci à ma famille et surtout à ma mère et mon père pour m’avoir encouragée et soutenue. Enfin, merci à mon mari et mon fils pour leur soutien, et surtout à mon fils pour m’avoir accompagnée pendant tout ce temps en France.
DNA:DeoxyriboNucleic Acid
AFLP: Amplified Fragment Length Polymorphism CDS: Coding DNA Sequence
CTAB: Cetyl Trimethyl Amonium Bromide
CIMMYT : Centro International de Mejoranniento de Maiz Y Trigo (Mexique) BLAST: Basic Local Alignment Search Tool
EDTA: Ethylene Dinitrilo Tetraacetic Acid EST: Expressed Sequence Tag
EST-SSR: Simple Sequence Repeats derived from Expressed Sequence Tag FAO: Food and Agriculture Organization
H2OUP: ultra pure water
ISSR: Inter Simple Sequence Repeats
ITMI: International Triticeae Mapping Initiative kb: kilobase
ORF: Open Reading Frame MAS: Marker Assisted Selection NIRS: Near Infrared Spectroscope pb: pair of bases
PCR: Polymerase Chain Reaction
PIC: Polymorphism Information Content QTL: Quantitative Trait Locus
RAPD: Random Amplified Polymorphic DNA RFLP: Restriction Fragment Length Polymorphism SCAR: Sequence-Characterized Amplified Region SDS: Sodium Dodecyl Sulfate
SNP: Single Nucleotide Polymorphism
SSLP: Simple Sequence Length Polymorphism
SSCP: Simple Sequence Conformation Polymorphism SSR: Simple Sequence Repeat
STS: Sequence Tagged Site TBE: Tris Borate EDTA TE: Tris EDTA
TEMED: Tetra Methyl Ethylene Diamine TIGR: The Institute for Genomic Research 5’-UTR: 5’- UnTranslated Regions
Introduction
……….…1Chapter I: Bibliography
………..………….……….…31. Hexaploid wheat………..………...3
1.1 Economical importance of wheat……...…….………...…3
1.2 Classification of the hexaploid wheat………...……….4
1.3 Origins of bread wheat………...……….…...5
1.4 Genetic specificity of bread wheat………...………5
2. Simple sequence repeats (SSRs) ………...……..……….….…..7
2.1 Definition and classification ………...……….7
2.2 Advantages of SSRs compare to other markers……….……….….7
2.3 SSRs within genomes………...……….…8
2.3.1 Abundance in genomes……….……….….8
2.3.2 Dispersion within genomes……….……….….9
2.3.3 Composition ……….………..10 2.3.4 Number of repeats………...………12 2.4 SSRs within cereals………...……….12 2.5 Level of polymorphism of SSRs………..……….13 2.5.1 Definition of SSR polymorphism………...……….13 2.5.2 Mutational mechanisms of SSRs……….………14 2.5.2.1 Replication slippage………...………..14 2.5.2.2 Unequal Recombination…………...………..………...14
2.5.2.3 Interaction replication slippage and recombination………...…………..15
2.5.3 Polymorphism of g-SSRs………...……….…15
2.5.4 Polymorphism of EST-SSRs………...16
2.6 Role and function of the SSRs………....16
2.6.1 DNA conformation……….……….…16
2.6.2 Promoter regulation………...……….….16
2.6.3 Meiosis and mitosis………...………..17
2.7.2 Genetic diversity……….…..18
2.7.3 Comparative mapping………...……….….19
2.7.4 Phylogenic studying………..………...20
2.7.5 MAS breeding……….………....20
3. Organizations of genetic resources ………..…22
3.1 History………....22
3.2 Definition and classification………..………….…22
3.3 Collections……….………...23
3.3.1 Landraces………..………23
3.3.2 Wild species……….……….24
3.4 Evaluation for genetic resources………..24
3.4.1 Agronomic and morphologic data……….25
3.4.2 Isozymes data………..……….25 3.4.3 NIRS data……….…26 3.4.4 Molecular data……….……….…27 3.4.4.1 RFLP……….………..27 3.4.4.2 RAPD………...……….….27 3.4.4.3 AFLP………..………...28 3.4.4.4 Microsatellites……….29 3.4.4.5 ISSR………30 3.4.4.6 STS……….30 3.4.4.7 SNPs………...31 3.4.4.8 ESTs………31
3.4.4.9 Comparison between the different types of markers for diversity……….32
3.5 Aims of the thesis……….………..34
3.5.1 Scientific question……….………34
3.5.2 Methodology………34
1. Plant material and extraction………..………36
1.1 Hexaploid wheats for polymorphism evaluation………...………..36
1.2 Grass species for transferability studies……….………36
1.3 Aneuploid lines………37
1.4 Segregating populations……….………37
1.4.1 ITMI population……….…………..37
1.4.2 Courtot X Chinese Spring population……….……….37
1.5 DNA extractions……….………...38
2. Wheat and rice EST-SSRs……….……….38
2.1 Analysis of the wheat ESTs………..38
2.2 Primer design………..………..39
2.3 Rice EST-SSRs………...………..39
2.4 EST-SSR detection………...………..40
2.4.1 Principle of the M13-tailed primer method………..40
2.4.2 PCR reaction and detection………..40
3. Data analysis……….……….41
3.1 Genetic and cytogenetic mapping of EST-SSRs………...……….41
3.1.1 Chromosomal assignment………...……….41
3.1.2 Genetic mapping………..……….41
3.2 Transferability of the EST-SSRs to wheat related species……….42
3.3 In silico analysis of EST-SSRs………...………42
3.4 Distribution of EST-SSRs on the rice genome……….………..43
3.5 Determination of Polymorphism Information Content (PIC) values………...…..43
3.6 Determination of the Jaccard similarity coefficient ……….……….43
3.7 Unweighted Pair Group Method with Arithmetic Mean (UPGMA)……….…….44
Chapter III: Results and discussion
………..……….451 Analysis of the wheat ESTs………..……….……45
1.4 Discussion………...………...47
2 Transferability of the wheat EST-SSRs to grass species………...…………50
2.1 Publication 1: High transferability of bread wheat EST-derived SSRs to other cereals (2005, Theor Appl Genet 111:677-687)………...………...51
2.2 Publication 2: Transferable bread wheat EST-SSRs demonstrated that grass species can be a reservoir of new alleles for wheat improvement (Plant Breeding in press)………..………61
2.3 Comments and perspectives………...………...….76
3 Transferability of EST-SSRs between wheat and rice…………...………77
3.1 Transferability from bread wheat to rice…………..………..77
3.2 Transferability from rice to bread wheat………..………..77
3.3 Discussion, comments and perspectives……….………...………...80
4 Phylogenetic studies of Triticeae using wheat EST-SSRs…………...………..83
4.1 Publication 3: Transferable bread wheat EST-SSRs can be useful for phylogenetic studies among the Triticeae species (Theor Appl Genet, on line first, DOI: 10.1007/s00122-006-0304-4)……….… 84
4.2 Comparison of the classification of T. aestivum lines obtained using g-SSRs and EST-SSRs………..….………..….96
4.3 Genetic diversity of Triticale species………..….97
4.4 Phylogenetic relationship for species with D genome………..…………...98
4.5 Phylogenetic relationship between all the species………...………...98
4.6 Discussion……….………..99
4.7 Comments and perspectives………..………...101
General Conclusion
………...……….1021. Analysis of the wheat ESTs………..………102
1.1 Main results………...………...……102
1.2 Perspectives………...………..102
2. Transferability of the wheat EST-SSRs………..………..103
2.1 Main results………...………...………103
2.2 Perspectives………..…………...……104
4. Transferability of rice EST-SSRs………..………...105 4.1 Main results……….………105 4.2 Perspectives………..………106 5. Conclusion………..………..106
References
...108Annexes
Annex 1: Fifteen international agricultural research centres supported by the CGIAR
Annex 2: The list of plant genotypes used for transferability assessment and phylogenetic analysis
Annex 3: List of EST-SSRs developed from common wheat
Annex 4: Result of amplification, polymorphism and transferability for 301 EST-SSRs Annex 5: Genetic map from ITMI and CTCS segregating populations
- 1 -
Introduction
Since humans have domesticated and cultivated the plant species that were necessary for their own or cattle feedings or for their material needs, they have been confronted to numerous plant development harmful events. Those events are abiotic stresses such as drought or soil salinity as well as biotic stresses like devastating insects or diseases. In order to face these constraints, several cultural practices aiming at correcting the environment such as irrigation, fertilizer supplies, or phytosanitary treatments were developed. At the same time, knowledge in plant genetics and especially cereals that have dramatically increased since the beginning of the 20th century, have been extensively exploited in order to genetically improve cultivated crops (Green Revolution during the sixties). Especially, criteria that are the most largely taken into account in genetic breeding are yield, environment adaptation (earliness, drought resistance…) and disease resistances. Until now, the cereals world production has covered the human needs, even outpacing population growth leading to surpluses in the past twenty years. However, the demographic increase that is estimated for the next 50 years will induce a simultaneous increase in the world cereal demand for feeding. If cultivating more and more lands has been the traditional answer to address the growing needs of the population, this will no longer be the case because of the decrease of agricultural land areas, especially in the developing countries, leading thus probably to stock depletions.
In addition, agriculture has also now to face ecological constraints. Intensive agriculture has induced huge modifications of the environment (deforestation, suppression of the hedges and ditches…) leading in soil degradation and in flooding. Also, intensive use of fertilizers, herbicides, insecticides and fungal treatments has conducted simultaneously to deplete the animal as well as floral genetic variability, to pollute phreatic water and to contribute to the eutrophy of lakes and rivers.
Thus, improvement of cereal yield in the context of sustainable agriculture has to be reached in the next decades to meet human needs by 2050. Significant advances in the understanding of the plant biology as well as in the management and exploitation of genetic resources must be achieved to face this challenge. Concerning this latter point, genetic variability in cereals and especially in wheat is extremely extended but remains largely underexploited. This is due: (1) to the poor knowledge of the capacities of these
- 2 -
resources in terms of biotic and abiotic resistances as well as their potential for bread making quality or yield performances; (2) to the fact that they are bearing many traits of low agronomical interest such as plant height, lodging susceptibility, free threshing, hulled kernels… Because of this, low attentions have been paid on the study of wheat related species especially in genomic areas while genomics has exploded in wheat in the last five years leading to better marker-assisted selection and to the positional cloning of a number of genes of agronomic interest.
The first aim of the thesis was to develop efficient genomic tools to study a wide range of wheat related species. Especially, we decided to focus our efforts in the development of molecular markers that can be used on wheat as well as on a large range of wild and cultivated wheat-related species that can be of interest for wheat genetic improvement. These markers would further be used to follow introgressions of genes of agronomical interest issued from these species, and to reduce the linkage drag of unfavourable alleles that they carry. The second aim was to use these markers to study the genetic variability existing within these species in comparison to wheat, in order to see whether they can be used as source of new alleles. We also assessed the relationships between and within these species. All this work will support the research towards the improvement of wheat and a better understanding of the organisation, function and evolution of the wheat genome.
Tab 1-1. World wheat production (million tonnes)
Fig1-1. Wheat production worldwide compared with the area sown to wheat from 1961 to 2000.
- 3 -
Chapter I: Bibliography
1. Hexaploid wheat
Small grain cereals offer the decisive advantage of constituting supplies that can be stored as grains, which have a high nutritional value due to their starch as well as protein contents. In addition, they can be easily transformed by cooking under numerous forms. First archeological evidences of cereal harvests date about 10,000 years ago and were found in the Middle-East, in the “Fertile Crescent” (Feldman, 1976) where einkorn (T. boeoticum) and wild durum species (T. dicoccoides) were subjected to gathering. Among the cereals, bread wheat (Triticum aestivum L.) occupies arguably the most important place. It appeared in the same region about 8,000 years ago and was one of the first domesticated crops. Then it was dispersed all over the world from Greece and Europe and has served as staple food for the major civilizations in Europe, West Asia and North Africa. At the present time, wheat remains the most important food source for humans and one of the most important merchandise for economical exchanges.
1.1
Economical importance of wheat
Wheat is grown as a commercial crop in 120 countries on an area of 217 million hectares in 2004 (FAO source) which represents about one third of the total cereal-cultivated areas. Wheat is also the most productive among the cereals and the combined harvests in 2004 were 627 million metric tonnes. The major producers in 2004 were China, European Union (25 countries), India, U.S.A., Russian Federation, Canada and Australia. The world wheat production in 2005 is expected to be 612 million tonnes, 15 million tonnes lower than the record in 2004 but still well above than the average of the past five years (Tab. 1-1) (FAO; http://www.fao.org/).
Improvement of cultural practices and genetic breeding since the beginning of the 20th century largely contributed to increase the world yields from 0.9 t/ha in 1900 to 2.9 t/ha in 2004. For example, since the early 1960s there has been little increase in the area sown with wheat, but over the same period, yields have increased almost 3-fold (Fig. 1-1). However, yields remain very different among the countries and if they can reach a mean of 7.8 t/ha in the Netherlands, they are only of 0.34 t/ha in Somalia.
Fig 1-2. Wheat import by region Fig 1-3. Wheat export price (US No.2 Hard Winter, Gulf)
- 4 -
World trade in wheat in the current 2004/2005 marketing year is now forecast to reach 103 million tonnes (FAO; http://www.fao.org/). Fig. 1-2 and 1-3 indicate the situation of wheat import of each region in the whole world and the price of wheat export in 2004 and 2005, respectively.
Wheat is primarily grown for its grain which is mainly used in bakery but it has other uses in the livestock feed and industry. Bread wheat can be roughly classified into several types, based on the growth habit (spring vs winter) and the hardness of the kernel endosperms (hard vs soft). The hard types of bread wheat often show high protein contents, especially gliadins and glutenins. They are mainly utilized for the production of a large variety of leavened and flat breads. The high level of these protein fractions in the flour imparts elasticity to bread dough and allow it to expand during leavening and baking. On the contrary, soft wheats are generally low in protein content, and are thus mostly milled into flour for use in a wide variety of bakery products such as cakes, pastries, and unleavened breads.
1.2
Classification of the hexaploid wheat
Botanically, wheat (Triticum aestivum L. em Thell) belongs to the sub-family of the
Pooideae within the grass family (Poaceae) which also includes the sub-families of the Bambusoideae that comprises rice (Oryza sativa) and of the Panicoideae that comprises
maize (Zea mays), sorghum (Sorghum bicolor) and sugar cane (Saccharum officinarum). Within the Pooideae sub-family, wheat belongs to the Triticodeae super-tribe and to the
Triticeae tribe. This latter tribe includes three important sub-tribes: the Triticineae with the Triticum and Aegilops species, the Secalineae with rye (Secale cereale) and the Hordineae
with barley (Hordeum vulgare). Over two dozen individual species have been characterized as members of the genus Triticum among which only T. monococcum L., T.
turgidum L., T. aestivum L. are widely cultivated and only the two latter are common.
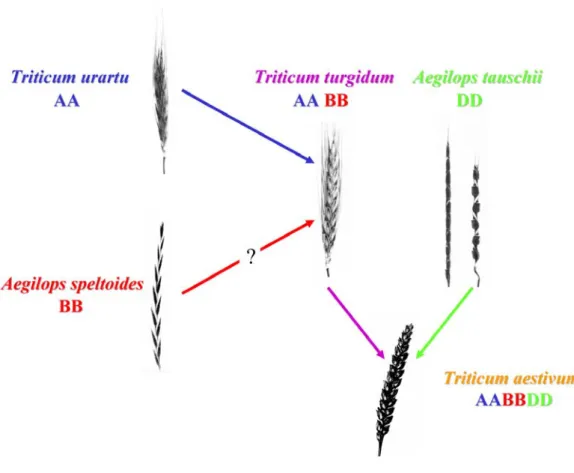
Relationships between T. aestivum and its close and wild relatives are listed in Fig. 1-4. It was early demonstrated that wheats formed polyploid series (Sakamura, 1918). The diploid species contain eight distinct genomes that were given a letter as names often followed by an additional letter representing the sub-species: A (T. monococcum ssp.
boeoticum, Ab; ssp. monococcum, Am; ssp. urartu, Au), C, D, M, N, S (Sitopsis section: Ae.
speltoides, Ss; Ae. bicornis, Sb; Ae. longissima, Sl; Ae. sharonensis Ssh), T and U. Two of
Fig. 1-5: Phylogenetic relationship of T. aestivum
- 5 -
diploid progenitors were not known. Some of the diploid species contributed to the genomes of polyploid species. The Triticum and Aegilops species gather diploid as well as polyploid species among which hexaploid bread wheat (Triticum aestivum) occupies the most important place of the Triticeae tribe.
1.3
Origins of bread wheat
Hexaploid bread wheat (Triticum aestivum L.em.Thell. 2n = 6x = 42) is an allopolyploid species which arose under cultivation 8,000 years ago from hybridization, followed by spontaneous chromosome doubling, between T. turgidum ssp. dicoccum and the diploid goatgrass Aegilops tauschii ssp. strangulate (2n= 6x =14, DD-genome; McFaddenet al. 1946; Jaaska 1980). Early cytogenetic studies suggested that the A genomes of the polyploids were contributed by T. monococcum (Sax1922; Lilienfeld and Kihara1934) but more recent studies evidenced that T. urartu was the real donor of the A genome (Natarajan et al. 1974; Huang et al. 2002). The origins of the B genome remain uncertain and controversial (Kerby and Kuspira, 1987). At least six different diploid Aegilops species from the Sitopsis section were proposed as possible source of the B genome. Other studies suggest a possible polyphyletic origin of the B genome. Two different allotetraploids with a common A genome (AAXX and AAYY) could have hybridized and within their descent, the X and Y genomes could have rearranged and gave rise to the actual B genome. However, Ae. speltoides is at the present time the most likely living relative of an extinct or yet to be discovered B genome donor species (Fig. 1-5, Sarkar and Stebbins 1956; Riley et al. 1958; Rees and Walters 1965; Natarajan and Sharma 1974; Chen et al. 1975; Jaaska 1980; Hassan and Gustafson 1996, Maestra and Naranjo 1998).
1.4
Genetic specificity of bread wheat
The wheat genome is hexaploid and is made by the juxtaposition of three simple genomes named A, B and D also called homoeologues. DNA is organized into 21 pairs of chromosomes (Fig. 1-6), seven pairs belonging to each of the A, B and D genomes (Sears 1954; Okamoto 1962). Within each diploid genome, the chromosomes are designated from 1 to 7. The size of each diploid genome varies between 4,500 and 6,000 mega bases (Mb, Bennet and Leitch, 1995) depending on the species. The bread wheat genome size was thus estimated to be 16,974 Mb (1C, Bennet and Smith, 1991) which represents 4, 40 and 130 times more than the human, rice and Arabidopsis thaliana genomes respectively. Wheat
- 6 -
genome is very complex and consists of unique or low-copy sequences surrounded by regions of highly repetitive DNA which represents about 70-80% of the genome (Flavell et al., 1977; Vedel and Delseny, 1987; Wicker et al., 2003). Although early studies indicated gene clustering in gene-rich islands located in distal parts of the chromosomes (telomeres), it is now believed that the islands are dispersed throughout the whole length of the chromosomes (Akhunov et al., 2003). Repetitive DNA mainly consists of transposable elements (e.g. Fatima, Caspar and Angela, Sabot et al., 2005) but Simple Sequence Repeats (SSRs) located in non-coding as well as in coding sequences are also frequent.
Fig 1-7: Examples of different types of SSRs
a. Perfect repeats without interruptions
GAGAGAGAGAGAGAGAGAGAGAGAGAGAGAGA
b. Imperfect repeats with one or more interruptions
GAGAGAGAGAGAGAGCGAGAGAGAGAGAGAGA
c. Compound repeats with adjacent tandem simple repeats of a different repeat:
Perfect compound repeats: GAGAGAGAGAGAGAGAGTGTGTGTGGTGTGTGTG Imperfect compound repeats: GAGAGAGAGAGAGAGGGGTGTGTGGTGTGTGT
- 7 -
2 Simple Sequence Repeats (SSRs)
2.1 Definition and classification
Microsatellites, also referred to as Simple Sequence Repeats (SSRs), Variable Number of Tandem Repeats (VNTRs) or Variable Simple Sequence Motif (VSSM), were first described in eukaryotes in the early eighties (Hamada et al. 1982). They are defined as stretches of DNA, which consist of only one or a few (maximum of six) tandemly, repeated nucleotides, such as poly (A/T) or poly(GT/CA) of less than 100 bp in length with a minimal length of 12 bp (Tautz and Rentz, 1984; Tautz 1993). These types of simple sequence were shownto be repetitive and interspersed in many eukaryotic genomes (Tautz et al. 1986). Several othertypes were found by sequencing eukaryotic DNA. They were reported in the genome of diverse species (Hamada et al. 1982; Tautz and Rentz 1984; Greaves and Patient 1985; Dover and Tautz 1986) and have been implicated in a range of functions including gene regulation (Wang et al. 1979; Weintraub and Groudine 1976; Hentschel 1982; Shen et al. 1981), signals for gene conversion and recombination (Shen et al. 1981; Goodman 1996; Jeffreys et al. 1985), and the replication of telomeres (Blackburn and Szostak, 1984).
SSRs are divided into different categories according to their composition (Fig 1-7; Weber 1990): perfect, imperfect or compound repeats. They are also classified into two classes based on their origins. Some are developed from enriched genomic DNA libraries (Edwards et al. 1996; Ostrander et al. 1992) and are thus named genomic SSRs (g-SSRs). Most of them have neither genic function nor close linkage to coding regions (Metzgar et al. 2000), and their developing process is very tedious and expensive. The second class of SSRs is derived from EST sequences originating from the expressed regions of the genome and is named EST-SSRs. In general, EST-SSR markers produce high quality patterns, but give a lower level of polymorphism compared to that from genomic SSRs (Holton et al. 2000; Thiel et al. 2003). An important feature of the EST-SSR markers is that they can be rapidly developed from the EST databases at low cost, and due to their existence in expressed regions, this will increase the efficiency of selecting genes of interest through marker assisted selection (MAS).
2.2 Advantages of SSRs compared to other markers
- 8 -
and Olivieri 1993; Rafalski and Tingey 1993; Powell et al. 1996). One of the main advantages of the microsatellites compared with other markers is their highly polymorphic rate due to the variability of the number of repeats at a given locus (Poulsen et al. 1993; Schmidt et al. 1993; Thomas and Scott 1993; Senior and Heun 1993; Becker and Heun 1995; Rongwen et al. 1995). However, they remain sufficiently stable to avoid somatic variations (Barret 1993). The polymorphism can be evaluated through the polymorphism information content value (PIC value), a criterion that was first introduced by Nei et al. (1973) in human genetics. These are also mainly co-dominant markers with a Mendelian inheritance, which can reveal homozygous as well as heterozygous lines and which can be used on a wide range of segregating population (Morgante and Olivieri 1993). In addition, they show a high reproducibility compared to other markers such as RAPDs. When polyploid plants like rapeseed and wheat are considered, microsatellites are also frequently specific of the genome and give a single signal compared to RFLPs (Poulsen et al. 1993; Röder et al. 1995). Finally, they can be easily automated and used on high throughput genotyping platforms (Nicot et al. 2004).
2.3 SSRs within genomes
2.3.1 Abundance in genomes
Abundance and polymorphism of the SSRs, especially of the dinucleotides (TG)n, (AC)n and (AT)n was demonstrated in human and other eukaryotes (Weber and May 1989; Tautz 1989; Litt and Luty 1989). In general, plants have a lower proportion of sequences that account for SSRs than do vertebrates but a higher proportion compared with invertebrates and fungi. The range for plants is between 0.85% (Arabidopsis) and 0.37% (maize) of the genome (Morgante et al. 2002), whereas estimates for the fish species Tetraodon
nigroviridis and Fugu rubipres are respectively 3.21% (Crollius et al. 2000) and 2.12%
(Elgar et al. 1999), 1.07% for human chromosome 22, 0.21% for Caenorhabditis elegans
and 0.30% for Saccharomyces cerevisiae (Toth et al. 2000). Within higher plants, Morgante and Olivieri (1993) estimated that the frequency of the microsatellites was one every 50 kb which contrasts with what is observed in human, with an estimated average density of one SSR every 6 kb (Beckman and Weber. 1992). Only few SSRs were detected within the organellar genome (Wang et al. 1994). The different types of SSRs exist in different density throughout the genome with slight variations according to the species. In primates, mononucleotides (mainly, poly (A/T) tracts) are the most copious classes of SSRs (Toth et
- 9 -
al. 2000; Wren et al. 2000). Dinucleotide (AT)n motifs were found to be rare within animal genomes while (CA)n were the most common SSRs (Moore et al. 1991). Most of the SSRs (48-67%) found in plant species are dinucleotide repeats while mono- and tetranucleotide repeats are the least common (Wang et al. 1994; Schug et al. 1998). A mean of one SSR every 64.6 kb and 21.2 kb was detected for monocotyledons and dicotyledons species respectively. However, frequency can vary from one every 3 kb in barley (Becker and Heun 1995) to one every 80 kb in rice (Panaud et al. 1995). At the centimorgan level, the SSRs provide thus an important source of markers for genetic mapping in eukaryotes. The utilization of microsatellites as genetic markers for a global approach of the genetic mapping in eukaryotes was proposed (Beckman and Soller 1990) and they have been thus extensively used to elaborate genetic maps in human (Weissenbach et al. 1992), pig (Rohrer et al. 1994) and other mammals and plants.
2.3.2 Dispersion within genomes
Microsatellites were found to be widely and randomly distributed in coding as well as non coding regions of the genome. A high proportion of SSRs is associated to Alu and SINE elements in primates and human (Arcot et al. 1995; Nadir et al. 1996) and thus forms a rather large portion of non-coding DNA regions. It was also demonstrated that they are frequently associated with retro-transposons and other dispersed repetitive elements in barley (Ramsay et al. 1999) as well as in other plant species (Wang et al. 1994). Di- and tetranucleotide SSRs are more frequent in non coding regions compared with trinucleotides. Dinucleotides are about 20 times more frequent in random genomic clones of Norway spruce (Picea abies, Scotti et al. 2000) compared to expressed sequences while Morgante et al. (2002) reported that all SSR types except tri- and hexa-nucleotides are significantly more frequent in the non coding fraction of six plant species compare to 25,762 predicted protein-coding sequences. In some cases, it was suggested that they could be clustered in some region of the genome (Condit and Hubbel 1991; Panaud et al. 1995; Arens et al. 1995).
Other evidences show that dinucleotide motifs seem to be located closer to the coding regions, in the 5’ UTRs or in the introns while one third of the trinucleotide motifs are located in the coding fraction of the genes (Morgante and Olivieri 1993). Introns have a similar repeat-unit profile to genomic DNA with various biases depending on species and
Tab 1-2: Various types of microsatellites (from Jin et al. 1994) Mononucleotide motif (2): A C Dinucleotide motif (4): AC AG AT CG Trinucleotide motif (10):
AAC AAG AAT ACC ACG ACT AGC AGG
ATC CCG Tetranucleotide motif (33):
AAAC AAAG AAAT AACC AACG AACT AAGC AAGG AAGT AATC AATG AATT ACAG ACAT ACCC ACCG ACCT ACGC ACGG ACGT ACTC ACTG AGAT AGCC AGCG AGCT AGGC AGGG ATCC ATCG ATGC CCCG CCGG
Pentanucleotide motif (102):
AAAAC AAAAG AAAAT AAACC AAACG AAACT AAAGC AAAGG AAAGT AAATC AAATG AAATT AACAC AACAG AACAT AACCC AACCG AACCT AACGC AACGG AACGT AACTC AACTG AACTT AAGAC AAGAG AAGAT AAGCC AAGCG AAGCT AAGGC AAGGG AAGGT AAGTC AAGTG AATAC AATAG AATAT AATCC AATCG AATCT AATGC AATGG AATGT AATTC ACACC ACACG ACACT ACAGC ACAGG ACAGT ACATC ACATG ACCAG ACCAT ACCCC ACCCG ACCCT ACCGC ACCGG ACCGT ACCTC ACCTG ACGAG ACGAT ACGCC ACGCG ACGCT ACGGC ACGGG ACGTC ACTAG ACTAT ACTCC ACTCG ACTCT ACTGC ACTGG AGAGC AGAGG AGATC AGATG AGCAT AGCCC AGCCG AGCCT AGCGC AGCGG AGCTC AGGAT AGGCC AGGCG AGGGC AGGGG ATATC ATCCC ATCCG ATCGC ATGCC CCCCG CCCGG CCGCG
- 10 -
motifs (Toth et al. 2000). Despite the fact that numerous SSRs exist in the open reading frames (ORFs) of higher eukaryotes including Drosophila, Caenorhabditis elegans, mammals, humans, plants and yeast (Toth et al. 2000; Katti et al. 2001; Kantety et al. 2002; Morgante et al. 2002), their occurrence in coding regions seems to be limited by non-perturbation of ORFs (Metzgar et al. 2000). In human cDNA databases, more than 92% of the predicted SSR polymorphisms within coding sequences have repeat-unit sizes that are a multiple of three (Wren et al. 2000). Thus, in many species, exons contain rare dinucleotide and tetranucleotide SSRs, but have many more trinucleotide and hexanucleotide SSRs than other repeats. Trinucleotide repeats show approximately a two fold greater frequency in exonic regions than in intronic and intergenic regions in all human chromosomes except the Y chromosome (Subramanian et al. 2003).
Within transcribed regions, UTRs harbor more SSRs than the coding regions themselves (Wren et al. 2000; Morgante et al. 2002). In Arabidopsis, the 5’-UTRs, exhibit a strong bias toward AG/CT contrary to human where 3’-UTRs show a bias toward AC/GT. Also, the 5’-UTRs contained more trinucleotide repeats than the 3’-UTRs in humans (31.1% vs. 4.6%; Stallings 1994; Wren et al. 2000) as well as in barley (67% vs. 26%; Thiel et al. 2003).
2.3.3 Composition
Because of permutations that give complementary repeats, only 501 different types of SSR motifs can be encountered from the mono- to hexa-nucleotides (Tab 1-2 derived from Jin et al. 1994). For example, the (AAC)n motif includes AAC, ACA and CAA repeats for the forward sense and GGT, TGT and TTG repeats for the reverse sense. There are thus two mono-, four di-, 10 tri-, 31 tetra-, 98 penta- and 356 hexa-nucleotide motifs.
Contrary to plants, mononucleotides are the most frequent in primate genomes (Toth et al. 2000) and there is a prevalence of A/T repeats (11.8%) compared with G/C repeats (0.7%) in human coding regions (Olivero et al. 2003). However, the majority of SSRs (48 – 67%) found in many species are dinucleotides (Wang et al. 1994; Schug et al. 1998). Compared with animals, it was noticed that in higher plants, there is a lack of (CA)n repeats while (AT)n are the most frequent SSRs (Akkaya et al. 1992; Morgante and Olivieri 1993; Lagerkrantz et al. 1993; Bell and Ecker 1994). This pattern may be related to higher frequencies of certain amino acids in plants than in animal (Toth et al. 2000). The motif (GC)n was only slightly detected in plants (Becker and Heun 1995; Morgante and Olivieri
- 11 -
1993). On the contrary, the (GA)n repeats are more abundant than the (CA)n repeats which seems to be characteristic of the plant genomes (Condit and Hubbel 1991). Exons and ESTs show higher frequency for GA/CT repeat than for AT repeat in Arabidopsis thaliana and cereals (Morgante et al. 2002; Kantety et al. 2002). However, the proportion of the different types of microsatellites depends on the species. For example, in Arabidopsis, frequencies of the (CA)n and (GA)n repeats are lower compared to what is estimated in other plants (Bell and Ecker 1994). In rice, microsatellites (GA)n are the most frequent (Panaud et al. 1995). The proportion of dinucleotide repeats was greater among genomic DNA than among EST, and this proportion increased with longer SSRs (La Rota et al. 2004).
Concerning the trinucleotide motifs, microsatellites (TAT)n are the most frequently detected in animals as well as in plants (27.5%) followed by (TCT)n motif (25%; Morgante and Olivieri 1993). However, similarly to the dinucleotides, frequency varies among the species. In barley, the (AGC)n and (CCT)n motifs are the most frequent (Becker and Heun 1995) while in rice, it is the (TTG)n motif (Panaud et al. 1995). Trinucleotide repeats are significantly more abundant in EST sequences compared to genomic sequences. In the animals, (AGC)n repeat is the most common motif (40.9% - 60.9%) while in plants, monocotyledons are richer in GC-rich trinucleotide repeats compared to dicotyledons (Cordeiro et al. 2001; Varshney et al. 2002; Thiel et al. 2003; Gupta et al. 2003). The most frequent trinucleotide motif in A. thaliana, grape and endophytes is AAG (28.3% - 42.1%). Abundance of CCG repeats in monocot genomes may be due to their increased GC content (Morgante et al. 2002). The AAT motifs were the least common (<1%) in monocot species and in other species ranging from 17.4% in S. cerevisiae to 0 in primates (Cordeiro et al. 2002; Varshney et al. 2002). This may be explained by the fact that TAA-based variants code for stop codons that have a direct effect in protein synthesis in eukaryotes.
Other types of motifs (tetra-, penta- and hexa-nucleotides) are less studied. However, they can sometime be very frequent such as tetranucleotide repeats which exceed trinucleotide repeats in vertebrate introns and intergenic regions. Poly (A/T) motifs are the most abundant especially in plants but tetranucleotides are rare in ESTs (Toth et al. 2000; Gupta et al. 2004). Similarly the most frequent pentanucleotide motifs are A/T rich in vertebrates but are under-represented in coding regions (Toth et al. 2000). Hexanucleotide repeats constitute the second most frequent type after trinucleotide repeats in exons (Toth et al.
- 12 -
2000), whereas they are less frequent (<1%) in the whole genome of plants (Varshney et al. 2002; Cardle L. 2000), a dominance of (A+T)-rich repeats in introns and intergenic regions being observed in most of the species (Toth et al. 2000).
2.3.4 Number of repeats
The number of repeats is characteristic of an allelic variant at a given locus. This number depends on the type and of the size of the motif. A minimum number of six repeats is generally considered as appropriate for dinucleotides (Tautz 1993). In rice genome 72% of SSRs longer than 30 bp were of the dinucleotide type. In human, most of dinucleotide repeats had between 12 and 15 units (Weber et al. 1990). In general, g-SSRs have more repeats than EST-SSRs. For example, the mean number of units for rice g-SSRs is 16.5 while the mean number for EST-SSRs is 15.3 indicating that longer SSRs are mainly located in non coding regions (La Rota et al. 2005).
Similarly, in cereal ESTs, the frequency of SSRs decreases with increasing repeat length for all the species and every class of SSRs. In maize, the six repeat unit SSRs represent 56.9% of the total number of dinucleotide repeats SSRs and among the trinucleotide repeat SSRs, five repeat units share as much as 64.5% of total class. If all EST-SSRs of different types are classified into categories of <10 and >10 repeat units, the category of >10 repeats contributes only as much as 25% to the total number of SSRs. In the tetra- to hexanucleotide repeats SSR classes, all the EST-SSRs (100%) fall into the category of <10 repeat units (Varshney et al 2002).
2.4 SSRs within cereals
During the last decade, SSR markers were developed and investigated in a large number of plants including major cereal species such as barley (Thiel et al. 2003), maize (Chin 1996; Yu et al. 2001), oats (Li et al. 2000), rice (Gao et al. 2003), rye (Saal and Wricke, 1999), Sorghum (Bhattramakki et al. 2000) and wheat (Röder et al. 1998; Varshney et al. 2000; Guyomarc’h et al. 2002a, b; Gupta et al. 2002). In the majority of these, the two most common SSRs, whose density in the genome were determined while screening genomic libraries included GA and GT. The density of GA (38% to 59%) and GT (20% to 34%) in these different species ranged from one SSR every 212 kb to 704 kb (Varshney et al. 2002). Estimates of the total number of SSRs at the genome level were also performed in several
- 13 -
crops. The frequencies per haploid genome were one SSR each 3.6 X 10⁴ bp for (GA)n and for 2.3 X 10⁴ bp for (GT)n in bread wheat (Röder et al. 1995), and were estimated to be one SSR each 1.36 X 10³ bp for (GA)n and for 1.23 X 10³ bp for (GT)n in rice (Panaud et al. 1995).
In a recent survey of EST and genomic sequences, densities of SSRs were higher in the coding regions compared to non-coding regions of the genomes (Morgante et al. 2002). In EST sequences of several cereal species, it was estimated that the frequency ranged from one SSR every 3.9 kb in rice to one SSR every 7.5 kb in maize (Varshney et al. 2002). In wheat, the same authors mentioned one SSR every 6.2 kb while Gupta et al. (2003) reported one SSR each 9.2 kb.
Overall, an average of one SSR every 6-7 kb seems to be a good estimate for SSR frequency in the whole genome of plants (Cardle et al. 2000).
2.5 Level of polymorphism of SSRs
2.5.1 Definition of SSR polymorphism
SSR polymorphism can be defined as the difference in the number of DNA repeats at a given locus, and can be easily analyzed through electrophoresis after PCR amplification. The level of polymorphism is generally evaluated through the Polymorphism Information Content (PIC) value (Nei et al. 1973) or diversity index (Akagi et al. 1998). However, it must be noticed that these values mostly depend on the sample studied (size and variability) and just allow comparison within the samples but not among different studies.
The sequences flanking specific SSR loci in a genome are supposed to be highly conserved within a species, but also in some cases across species, within a genus and rarely across related genera. These conserved sequences are therefore used to design primers for individual SSR loci. In human and various animals, SSRs have high mutation rates, ranging from 10-3 to 10-6, which is superior to that of other regions in the genome (Bachtrog et al. 1999). In plants, the mutation rate at microsatellite loci is even higher than in animals, with the range of 10-2 to 10-3 in chickpea (Cicer arietinum, Udupa et al. 2001), or 10-3 to 10-4 in durum wheat (Triticum turgidum, Thuillet et al. 2002). SSR mutation rates are influenced by several factors, including motif type, perfection and number of repeats, among which the repeat number was best characterized (Schlötterer et al. 1998; Thuillet et al. 2004). In a variety of organisms, it was demonstrated that SSR mutation rates are
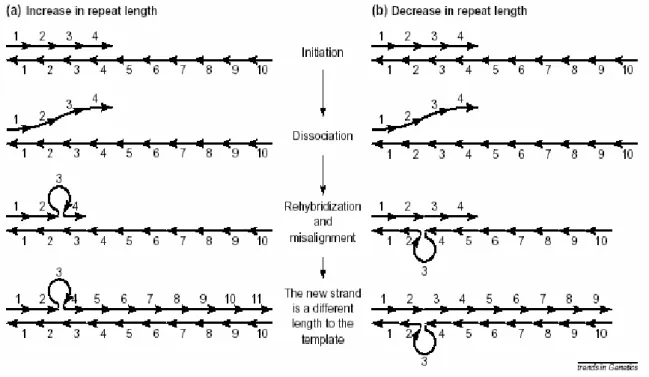
Figure 1-8 Model of SSR mutation by replication slippage (slipped-stand mispairing)
Repeat units are denoted by arrows. Numbers refer to the repeat unit number within each strand. (a) When the repetitive region is being synthesized the two strands can dissociate. Sometimes the strands are misaligned upon reassociation; that is, the nascent strand might incorrectly realign with repeat units downstream on the template strand. In such cases, a loop is formed on the nascent strand, and when synthesis of the new strand is initiated again it will become one repeat unit longer than the template strand. (b) As in (a), but the incorrect alignment occurs upstream on the template strand, and the new strand will therefore become one repeat unit shorter than the template strand.
- 14 -
positively correlated with repeat numbers and that the most polymorphic SSRs are the longest ones (Sia et al. 1997; Schlötterer et al. 1998; Thuillet et al. 2004). Weber (1990) reported that SSRs with 12 or fewer repeats were monomorphic in human (PIC = 0) and that the PIC value increased simultaneously to the average number of repeats, especially in the range of about 11 – 17 repeats.
2.5.2 Mutational mechanisms of SSRs
Two hypotheses are currently admitted to explain the variability of SSRs. The first one involves unequal crossing over between sister chromatides either during mitosis or after homologous pairing of chromosomes at meiosis (Wolf et al. 1989; Harding et al. 1992). However, they are most likely thought to accumulate by DNA slippage (Wells et al. 1965; Streisinger et al. 1966; Morgan et al. 1974; Efstratiadis et al. 1980; Drake et al. 1983; Levinson and Gutman 1987) and mispairing during replication and recombination or extension of single-strand ends (Tautz and Rentz 1984; Dover and Tautz 1986; Jeffreys et al. 1985; Wells et al. 1965).
2.5.2.1 Replication slippage
A model for SSR mutation based on replication slippage was formulated by Levinson and Gutman (1987). Replication slippage or slipped strand mispairing refers to the out-of-register alignment of the two DNA strands following dissociation at the time when the DNA polymerase traverses the repetitive region. This slippage implies the formation of a single-strand loop during DNA synthesis and addition (or suppression depending on the strand concerned with the loop) of a motif. If the most 3’ repeat unit of the nascent strand re-hybridizes with a complementary repeat unit downstream along the template strand, a loop will be formed in the nascent strand and the new sequence will become longer than the template sequence upon elongation (Fig1-8a). On the contrary, if the incorrect alignment occurs upstream along the template strand, the new strand will become shorter than the template sequence (Fig1-8b). Most of these primary mutations are corrected by the mismatch repaired system, and only the small fraction that was not repaired ends up as microsatellite mutation events (Schlotterer and Tautz 1992).
2.5.2.2 Unequal recombination
Recombination could potentially change the SSR length by unequal crossing over or by gene conversion, which introduce mutation in the satellite sequence. In the version of the
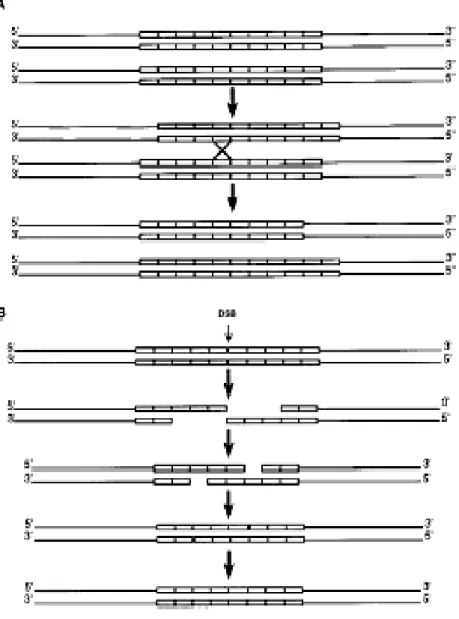
Figure 1-9. Model of SSR mutation by recombination
The open rectangles represent individual repeat units. (A) Homologous recombination between misaligned arrays of 10 repeats results in one DNA molecule with a repeated tract one repeat unit longer than the original tract and one molecule that is one repeat unit shorter than the original tract. (B) A double strand break occurs within the repeated tract. This break is followed by exonuclease degradation that exposes complementary single-stranded regions. Hybridization of these regions followed by DNA synthesis and religation results in a reduction in repeat units. Alternatively, the broken ends could invade an array on another DNA molecule leading to an expansion in the tract.
- 15 -
recombination model shown in Fig1-9A, simple repeats located on different DNA molecules pair in a misaligned configuration and a crossover occurs, resulting in arrays with reciprocal additions and deletions. Other recombination models in which the additions or deletions are not reciprocal are also possible (Fig1-9B). There is little evidence that recombination would also contribute to microsatellite mutation. Genomic SSR distributions are associated with sites of recombination, most probably as a consequence of repetitive sequences being involved in recombination rather than being a consequence of it (Treco and Arnheim 1986; Majewski and Ott 2000)
2.5.2.3 Interaction between replication slippage and recombination
Other possible SSR mutation model was proposed by Li et al. (2002). When studying SSR diversity in wild emmer wheat, they found a strong interaction between mean repeat length and SSR locus distance from centromere. This interaction has an effect on the number of alleles and variance in repeat size at SSR loci. SSR mutation might thus be the result from the possible influence of replication slippage during recombination-dependent DNA repair. In fact, strand exchange between two homologous chromosomes should create a four-stranded configuration, called a Holliday structure, associated with mismatched (heteroduplex) DNA region. These regions undergo replication-dependent correction. Hence, a slippage mechanism may also work in recombination tracts involving SSR arrays (Gendral et al. 2000; Li et al 2002)
2.5.3 Polymorphism of g-SSRs
Numerous studies demonstrated that g-SSRs show a high level of polymorphism compared to other types of molecular markers. Kölliker et al. (2001) reported that SSR markers developed from white clover were highly polymorphic, 88% detecting polymorphism across seven genotypes with an average allele number of 4.8. In maize, PIC values ranged between 0.06 and 0.91 with a mean of 0.62 (Smith et al. 1997) which was similar to what is mentioned for RFLPs (Senior and Heun 1993). In barley, it was demonstrated that even if SSRs show lower diversity index compared to AFLP (0.521 and 0.937 respectively), they reveal a high number of allele at each locus making them very effective to study genetic relationships (Russell et al. 1997). In cultivated spelt wheat, Bertin et al. (2001) found that the mean PIC value was 0.64 while in common wheat; it was assessed to be 0.71. Even if lower PIC value (0.57) are also reported for common wheat (Stachel et al. 2000), this is twice higher than what is revealed by RFLPs (Chao et al. 1989; Cadalen et al.
- 16 -
1997).
2.5.4 Polymorphism of EST-SSRs
Assessments of polymorphism of EST-SSRs have been carried out in rice (Cho et al. 2000), grape (Scott et al. 2000), sugarcane (Grivet et al. 2003), tomato (Areshchenkova and Ganal, 2002), Alpine Lady-fern (Woodhead et al. 2003), pasture grass endophytes (Jong et al. 2002), barley (Thiel et al. 2003) and rye (Hackauf and Wehling 2002). In common wheat, EST-SSRs give better profiles compared to the g-SSRs (Holton et al. 2002) but the polymorphism level among EST-SSRs ranged from 7% to 55% (Holton et al. 2002; Eujayl et al. 2002; Gupta et al. 2003; Leigh et al. 2003; Nicot et al. 2004) which was lower compared to g-SSRs (61%, Sourdille et al. 2001; 100% Prasad et al. 2000). However, despite the fact that EST-SSRs show less polymorphism than g-SSRs, they are still informative for assessing genetic relationships (Eujayl et al. 2001, 2002; Gupta et al. 2003).
2.6 Role and function of the SSRs
2.6.1 DNA conformation
Alternations of purins and pyrimidins such as in (CG)n or (CA)n microsatellites favour the formation of Z-DNA (Bull et al. 1999). Z-DNA formed a double left-turned helix, which is more condensed compare to B-DNA because it contains 12 bp at each turn instead of 10.4 bp (for reviews see Loridon et al. 1998). Z-DNA is involved in recombination, gene expression regulation during transcription. On the contrary, homopurin and homopyrimidin sequences form H-DNA. Negative super-coiling of the DNA allows the formation of a triple helix resulting from the addition of a third DNA strand within the large groove of the double helix (Loridon et al. 1998). Other microsatellites may confer a hairpin loop structure and can thus play a role in the replication, the transcription, the translation and the interactions between DNA and proteins.
2.6.2 Promoter regulation
Microsatellites are frequently associated with regulatory elements (Levinson and Gutman 1987; Barrier et al. 2000). Hot spots for microsatellite formation within development homeotic genes such as the antennapedia and dorsal genes in Drosophila and apetala gene involved in floral regulation in plants can be identified (Barrier et al. 2000). Also, nuclear proteins specifically bind to repeated sequences such as (CCG)n which are frequently
- 17 -
encountered in the 5’URTs of the genes and which have thus an effect on mRNA transcription (Debrauwere et al. 1997).
2.6.3 Meiosis and mitosis
Microsatellites may also be involved in chromosome pairing at meiosis (Samadi et al. 1998) and in the centromere function (Levinson and Gutman 1987). It was also demonstrated that the tetranucleotide repeats (GACA)n were tightly linked to the nucleoli organizer in primates (Arens et al. 1995). Moreover, (GT)n SSRs have no effect on simple crossing over but increase multiple crossing over (Gendrel et al. 2000). The microsatellites inhibit Strand exchanges, which are promoted by RecA.
2.6.4 Coding function
Most of the microsatellites are distributed in euchromatin in coding as well non coding regions. Trinucleotide repeats locating in ORFs are coding for tandemly repeated amino acids that interfere with the protein function (Richard and Dujon, 1997). They can thus form proteic domains that are enriched in specific amino acids (Gortner et al, 1996). The most frequent codons are those coding for glutamine, asparagine and glycin.
In wheat, five microsatellites were initially identified in genes (Devos et al. 1995). Similarly, four genes bearing a microsatellite were reported in barley (Saghai-Maroof et al. 1994) and 27 in rice (Cho et al. 2000). With the rapid increase of ESTs in the databases (http://www.ncbi.nlm.nih.gov/dbEST), it is now well known that about 10% of the genes contain a microsatellite motif (Morgante et al. 2002, Nicot et al. 2004).
2.7 Application of SSRs to plant genetic studies
2.7.1 Genetic mapping
Breeding and genomics research efforts can make use of genetic maps to facilitate plant selection and to position BAC clones along physical maps of the genomes. In both cases, high throughput accurate marker technology is essential to avoid errors in genotyping and to enable processing of hundred or thousands of DNA samples in a short time. Microsatellites offer an easy tool and an abundant source of genetic markers. Consequently, SSR linkage maps have become available for a variety of plant genomes including rice (Wu and Tanksley 1993), barley (Saghai-Maroof et al. 1994), maize (Senior and Heun 1993) and wheat (Röder et al 1998; Somers et al. 2004). All these maps were proven to be
Tab1-3: Genome mapping using EST-SSR markers
a Abbreviations: BC
1, backcross population; DHs, doubled haploids; RILs, recombinant inbred lines.
Plant species Number of genic
SSR loci mapped Mapping population used Refs
Barley 185 3 DHsa (Igri×Franka, Steptoe×Morex, OWBDom×OWBRec) Thiel et al.2003 39 F2s (Lerche×BGR41936), DHs (Igri×Franka), wheat–barley addition lines Pillen et al. 2000
Cotton 111 BC1
b lines (TM1×Hai7124)×TM1) Han et al. 2004
Kiwifruit 138 Intraspecific cross Fraser et al. 2004
Raspberry 8 Full-sib family (Glen Moy×Latham) Graham et al. 2004
Rice 91 DHs (IR64×Azucena), RILs
c (Milyang 23×Gihobyeo, Lemont×Teqing, BS125×WL0Genome
mapping using EST-SSRs 2) Temnykh et al. 2000
Rye 39 4 mapping populations derived from reciprocal crosses (P87×P105, N6×N2, N7×N2,
N7×N6) Khlestkina et al. 2004
Ryegrass 91 Three-generation population (Floregon×Manhattan) Warnke et al. 2004 Tall fescue
(Festuca spp.) 91 Pseudo-test cross-population (HD28–56×R43–64) Saha et al. 2004
Wheat 149 RILs (W7984×Opata85) Yu et al.2004
126 RILs (W7984×Opata85) Nicot et al. 2004
101 RILs (W7984×Opata85, Wenmai 6×Shanhongmai), DHs (Lumai14×Hanxuan 10) Gao et al. 2004 White clover 449 Pseudotest cross-population (6525/5×364/7) Barrett et al. 2004
- 18 -
useful for QTL detection of numerous traits of agronomic interest and positional cloning of genes underlying these QTLs. Recently, the EST-SSR loci have been integrated for a wide range of species (Tab 1-3). Contrary to g-SSRs, EST-SSRs were not clustered around the centromere but, as expected, were concentrated in gene-rich regions (Thiel et al. 2003; Yu et al. 2004; Gao et al 2004). It is believed that the distribution of EST-SSRs in the genetic maps mirrors the distribution of genes along the genetic map. Moreover, EST-SSRs may affect the genes’ function and thus constitute gene-targeted markers with the potential of representing functional markers in those cases where polymorphisms in the repeat motifs affect the function of the gene in which they reside (Anderson et al. 2003). They can contribute to ‘direct allele selection’, when completely associated or even responsible for a targeted trait (Sorrells et al. 1997). Recently, for example, a Dof homolog (DAG1) gene that showed a strong effect on seed germination in Arabidopsis has been mapped on chromosome 1B of wheat by using wheat EST-SSR primers (Gao et al. 2004). Similarly, Yu et al. (2004) identified two EST-SSR markers linked to the photoperiod response gene (ppd) in wheat. In both cases, these may constitute candidate genes or this may help in positional cloning of the gene because of the likely existence of gene rich islands where several genes are clustered. Finally, mapping EST-SSRs can facilitate genome alignment across distantly related species (Yu et al. 2004; Varshney et al 2005) as classical RFLP markers are currently less used for that.
2.7.2 Genetic diversity
Characterization of genetic variation within natural populations and among breeding lines is crucial for effective conservation and exploitation of genetic resources for crop improvement programs. SSRs have proven to be useful for assessment of genetic variation in germplasm collections of various species (Brown et al. 1996; Struss et al. 1998; Djè et al. 2000; Ghebru et al. 2002; Matsuoka et al. 2002; Ni et al. 2002; Sjakste et al. 2002; Chebotar et al. 2003; Russell et al. 2003; Yu et al. 2003; Zhou et al, 2003; Tarter et al 2004; Casa et al. 2005; Clerc et al. 2005; Menkir et al. 2005; Mohammadi et al. 2005). However most of the markers derived from genomic DNA assay polymorphisms potentially carried by non-coding regions of the genome and are poorly conserved among species (Brown et al. 2001). Therefore, these markers overestimate the “useful” genetic diversity available in the gene pool. In contrast, EST-SSRs generally assay polymorphism potentially carried by the coding regions of the genome and can detect the “true functional genetic diversity”
- 19 -
(Maestri et al. 2002; Yamanaka et al. 2003; Gupta et al. 2003). In recent years, EST-SSRs have also been used for diversity estimations in several plant systems including durum wheat (Eujayl et al. 2001), Pisum sp. (Burstin et al. 2001), barley (Thiel et al. 2003; Holton et al. 2002), bread wheat (Holton et al. 2002; Gupta et al. 2003; Gao et al. 2003), rye (Hackauf and Wehling 2002). In comparison to genomic SSRs, EST-SSRs revealed less polymorphism in germplasm characterization and genetic diversity studies (Scott et al. 2000; Thiel et al. 2003; Cho et al. 2000, Russell et al 2004). Therefore, evaluation of germplasm with EST-SSRs enhance the role of genetic markers by assaying the variation in transcribed regions, although there is a higher probability of bias owing to selection. Thereby, the genetic diversity presented by combining two types of markers might be representative of the entire genome. In addition, EST-SSRs also provide opportunities to examine functional diversity in relation to adaptive variation (Eujayl et al 2001; Russell et al 2004).
2.7.3 Comparative mapping
Numerous studies demonstrated that g-SSRs are frequently locus specific without corresponding homoeoloci on the other related genomes (Bryan et al. 1997; Stephenson et al. 1998; Röder et al. 1998). Thus, they appeared to have a limited transferability to related species (Sourdille et al. 2001; Varshney et al. 2000) suggesting that they are of limited utility, when used for comparative mapping. On the contrary, numerous studies revealed that EST-SSRs showed a high level of transferability to close and wild relatives because they are derived from conserved coding regions (Holton et al. 2002; Gupta et al. 2003; Eujayl et al. 2001, 2002; Bandopadhyay et al. 2004). Recently, the potential use of EST-SSRs developed for barley and wheat has been demonstrated for comparative mapping in wheat, rye and rice (Yu et al. 2004; Varshney et al 2005). These studies suggested that EST-SSR markers could be used in related plant species for which little information is available on SSRs or ESTs. In addition, the EST-SSRs are good candidates for the development of conserved orthologous markers for genetic analysis and breeding of different species. For example, a set of 12 barley EST-SSR markers was identified that showed significant homology with the ESTs of four monocotyledonous species (wheat, maize, sorghum and rice) and two dicotyledonous species (Arabidopsis and Medicago) and could potentially be used across these species (Varshney et al 2005).
- 20 -
sequences and genome location across species (Yu et al. 2004; Varshney et al 2005). For example, Saha et al. (2004) who sequenced the products of one EST-SSR primer pair for three fescue species, ryegrass, rice and wheat reported that sequences were >85% similar. Sequence-based comparison of mapped barley EST-SSRs with genetically and/or physically mapped markers in wheat, rye and rice revealed several markers that showed an orthologous relationship between examined cereal species (Varshney et al 2005). Comparison of genome locations of polymorphic EST-SSR markers mapped in both wheat and rice also confirmed previously known genome relationships with most of the markers examined (Yu et al. 2004). However, the assessment of colinearity was complicated by the detection of multiple polymorphic loci in either wheat or rice for 85% of the primer pairs suggesting sequence divergence or differential gene duplication.
2.7.4 Phylogenetic studies
Genomic SSRs were extensively explored in plant evolutionary studies because of their high polymorphism level, their co-dominant inheritance, and their reproducibility (Plaschke et al. 1995; Prasad et al. 2000; Manifesto et al. 2001; Ben Amer et al. 2001; Leisova and Ovesna 2001; Zhang et al. 2002). However, interspecific phylogenetic studies in using SSRs were often restricted because of the limited transferability of genomic SSRs to related species (Lelley et al. 2000) and the high mutation rate. Because being highly transferable to distantly related species, EST-SSRs are thought to be more suitable for this purpose. EST-SSRs had been used to investigate their potential in providing useful information for phylogeny (Rossetto et al. 2002). Three EST-derived microsatellite loci from Vitis vinifera were amplified and sequenced across eight species of Vitaceae from four different genera. Phylogenetic analysis of the microsatellite's flanking regions produced informative results in congruence with previous studies. Based on EST-SSRs allelic polymorphism among 18 species of Triticum-Aegilops complex using 64 common wheat EST-SSRs, Bandopadhyay et al. (2004) were able to construct a dendrogram separating the diploid and tetraploid species.
2.7.5 Marker Assisted Selection (MAS)
Application of MAS has been shown to increase selection efficiency, particularly for traits with low heritability (Bernardo et al. 2001). It will be increasingly applied to accelerate selection of traits that are difficult to manage via phenotype, owing to low penetrance and/or complex inheritance. It will also serve to maintain recessive alleles in backcrossing
- 21 -
pedigrees, to pyramid disease-resistance genes and to aid in the choice of parents in crossing programs, to ensure minimal levels of duplication of alleles across sets of genes targeted for selection, and to promote fixation.
Recently, increasing numbers of agronomically significant genes have been tagged with linked SSR assays (Huang et al. 2000; Raupp et al. 2001; Bariana et al. 2001). Most of these are resistance genes because single-gene control of this class of character is widespread. For example, Hurtado et al. (2002) demonstrated that SSRs tightly linked to sharka resistance facilitated MAS in breeding for resistance in apricot.
However, most traits of agronomical interest are under polygenic control such as the resistance to fusarium head blight (FHB), which is a major objective for many private as well as public laboratories in the world. For practical reasons, FHB is a difficult disease to handle by conventional pathology testing, and genetic analysis of the primary sources of resistance has shown that a significant proportion of the effect can be attributed to three QTL, mapping to different chromosomes, with each of the relevant genomic sites tagged with the genomic SSR locus (Anderson et al. 2001). Similarly in rice, numerous g-SSRs were found to be closely associated with low glutelin content and their effectiveness in MAS breeding was illustrated (Wang et al. 2002). EST-SSRs are more likely to exhibit perfect marker-trait association, provided that the gene containing SSR is the QTL itself. This perfect marker-trait association must be assessed by fine association mapping (linkage disequilibrium = LD) prior to MAS. Through marker-trait association, these so-called “perfect markers” can be developed for a variety of traits in a large number of plant systems, once candidate genes have been found.