THÈSE PRÉSENTÉE À
L'UNIVERSITÉ DU QUÉBEC À TROIS-RIVIÈRES
COMME EXIGENCE PARTIELLE DU DOCTORAT EN GÉNIE PAPETIER
PAR
DANIEL MATTE
PRECOAT'S INFLUENCE ON TOPCOAT'S PHYSICAL PROPERTIES AND PRINTABILITY
Université du Québec à Trois-Rivières
Service de la bibliothèque
Avertissement
L’auteur de ce mémoire ou de cette thèse a autorisé l’Université du Québec
à Trois-Rivières à diffuser, à des fins non lucratives, une copie de son
mémoire ou de sa thèse.
Cette diffusion n’entraîne pas une renonciation de la part de l’auteur à ses
droits de propriété intellectuelle, incluant le droit d’auteur, sur ce mémoire
ou cette thèse. Notamment, la reproduction ou la publication de la totalité
ou d’une partie importante de ce mémoire ou de cette thèse requiert son
autorisation.
UNIVERSITÉ DU QUÉBEC À TROIS-RIVIÈRES
DOCTORAT EN GÉNIE PAPETIER (PH. O.)
Programme offert par l'Université du QUÉBEC À TROIS-RIVIÉRES
PRECOAT'S INFLUENCE ON TOPCOAT'S PHYSICAL PROPERTIES AND PRINTABILITY
INFLUENCE DE LA PRÉ-COUCHE SUR LES PROPRIÉTÉS PHYSIQUES ET D'IMPRESSION DE LA COUCHE SUPÉRIEURE
Claude DANEAUL T Directeur de recherche Bruno CHABOT Président du jury Patrice MANGIN Co-directeur de recherche Jean-Philippe BOISVERT Évaluateur externe François BERTRAND Évaluateur externe
Thèse soutenue le 20 décembre 2011
PAR
Daniel Matte
Université du Québec à Trois-Rivières
Université du Québec à Trois-Rivières
Université du Québec à Trois-Rivières
Centre de recherche Lafarge, St-Quentin Fallavier, France
École Polytechnique de Montréal, Département de génie chimique
Preface
The objective of present thesis is to verify the possibility to establish interactions be-tween different properties of the precoat and/or topcoat layers in order to relate these properties to printability. To reach the thesis objective we designed an experiment based on the analysis of various groups of coated samples. The study is divided in 4 different groups representing for each one a different precoat, coating layer, pigment-latex, and calendering combinations.
The first group (Group 1) is used to study the replacement of 20 parts of GCC (Ground Calcium Carbonate; 1.4 ~m average particle size) by 4 clays of different average particle size. The second group (Group 2) serves to study the calendering effect on the base pa-per or on the precoated layer. Two tempa-perature conditions combined with 2 different pressures for a total of 8 conditions are included in Group 2. The third group (Group 3) has only 2 conditions: for the first condition, the latex S/B (Styrene/Butadiene) is re-placed by an acrylic in the precoat; for the second condition, the CMC (Carboxy Methyl Cellulose) is replaced by an amphoteric protein. Finally, the last group (Group 4) is used to study what occurs when the GCC pigment is totally replaced in the precoat for-mulation by other pigments. Group 4 has five different forfor-mulations: one with PCC (Precipitated Calcium Carbonate), one with Brazilian Clay and 3 with GCC different particle size and different particle size distribution. The topcoat applied over each of these 20 precoat conditions is exactly the same.
The latex is changed for the topcoat using 3 different latexes for a total of 60 conditions. The latexes used are Styrene/Butadienel Acrylonitrile (S/BI ACN), Styrenel Acrylic (SI A), Styrenel Acrylicl Acrylonitrile (SIAl ACN). AlI these conditions are analyzed for pore structure, contact angle, SEM (Scanning electron microscopy), and offset printability test (DELTACK).
Acknowledgements
My first thoughts go to my family who believed in me from the very beginning of this project. Their support and help were a huge part in supporting me to successfuUy com-plete such a huge undertaking. l want to thank aU my family members, my wife Jo-hanne, and my children Kathleen, Marilyn, Pier-Luc, and Jean-Christophe, for their sup-port and their good comments during aU the time and the long hours l worked on my thesis.
Big thanks are due to Professors Claude Daneault and Patrice Mangin for their com-ments, support, and help. Without them, l would certainly have not been able to com-plete the work in its present form. They showed me various ways to improve myself in this "adventure". Very special thanks are due to Patrice Mangin for the time he spent with me to re-write and re-organise the document, and to teach me how to analyse data in further depth, with a scientific mind, before reaching the final defence of the thesis. AU his comments and suggestions surely improved this document to a high scientific level.
l also want to thank Centre International de Couchage (CIC) and the people at CIC for their support and their help. Thanks are due to Omya Development AG for the great support offered, especiaUy for aU the testing performed on my behalf, and finaUy thanks are due to Kamin LLC for aUowing me to utilise sorne results from their trials.
Very special thanks are due to Nancy Jacob, CIC for aU the data compilation and her patience with the changes in the direction of my research. Special thoughts are con-veyed to Charlie Mazza, CIC, and Patrice Mangin, CIPPIUQTR for their help in improv-ing the English structure of my document.
The author also wishes to thank Dr Patrick Gane and Dr Cathy Ridgway, Omya Devel-opment AG for their help and support in the mercury testing and their useful comments on the different methods. Discussions were particularly valuable in conducting and pre-paring the research work and strategy. Their input is very much appreciated.
The last words and thanks go for aIl the persons listed below who helped me in different ways and at different times during the project, namely:
Joseph Ishley for comments on the English document,
Sylvie St Amour for mercury intrusion and CLC testing,
Sylvie Sauriol for CLC testing and printability measurements,
Martin Dubé for profilometry, mathematical and pore analysis,
Agnès Lej eune for Scanning Electron Microscopy (SEM) wonderful pictures,
J osée Doucet for contact angle measurement,
Amy Dimmick for comments and corrections on the English document, and
Robert Lanouette for PLS analysis, comments, and useful discussions.
Résumé en français
La fabrication du papier enduit ou papier couché connaît des développements importants depuis une vingtaine d'années. Une partie de ces développements concerne les papiers enduits de plus d'une couche, communément appelés «papier multicouches.» Durant toutes ces années, la caractérisation de la structure des couches, les unes par rapport aux autres, n'a fait l'objet que de quelques études qui traitaient principalement de la couche finale appliquée sur le papier. L'influence de la pré-couche sur les caractéristiques fina-les d'impression n'a quant à elle pratiquement jamais été abordée de façon fondamenta-le. Une étude sur les interactions entre les couches pour un carton de pâte kraft blanchie mentionne l'effet de la pré-couche mais aucune étude systématique ne traite le papier sans bois (wood free).
L'objectif premier de ce travail a donc été de déterminer et de comprendre l'effet de la pré-couche sur les caractéristiques finales d'impression de la feuille. Pour ce faire, vingt (20) différentes conditions de préparation de pré-couche ont été analysées avant d'y ap-pliquer trois types d'enduits de surface différents. Les différentes conditions d'application des pré-couches ont été réalisés sur une coucheuse pilote selon des condi-tions d'opération industrielles normales pour ce type de papier. L'application de la cou-che supérieure a été réalisée sur un équipement de laboratoire qui reproduits des condi-tions industrielles d'opéracondi-tions: le CLC pour «Cylindrical Laboratory Coater». L'impression de type offset des papiers ainsi préparés a été faite à l'aide d'un appareil Prüfbau adapté pour la mesure du maximum de tirant lors de la prise d'encre (DELTACK). Les structures ont été déterminées par intrusion au mercure et par mi-croscopie électronique à balayage complétée par des mesures d'angle de contact. Outre les mesures normalisées sur les propriétés des papiers, ces mesures ont servi à évaluer les propriétés structurelles et de surface des papiers en vue de l'analyse et de la compré-hension des comportements des différentes pré-couches d'un point de vue structurel.
Le support de couche utilisé est un papier sans bois avec un grammage ou poids de base de 61 g/m2
, soit le papier commercial « Thermal Transfert» (Fraser Paper Company). Quatre différents groupes de papiers pré-couchés ont été produits en usine pilote afin
d'obtenir une qualité et une stabilité jugées primordiales avant l'application en laboratoi-re à l'aide du CLC d'une couche finale ou couche supérieure, au-dessus de la pré-couche. Toutes les formulations de pré-couche ont été ajustées à une concentration de départ de 66 % avec cependant parfois une dilution additionnelle afin de permettre une application de qualité lors de la production en usine pilote. La pré-couche de 12 g/m2
par côté, le coté rugueux étant couché en premier, a été appliquée avec la station de coucha-ge jet/lame de la coucheuse pilote. La vitesse de la coucheuse était de 1400 rn/min et la lame choisie pour le contrôle de poids de couche correspondait à une nomenclature in-dustrielle « 0.457 mm / 84 mm / 45° » (dimension et angle de la lame d'application).
Pour chacune des conditions expérimentales de l'étude, les tests d'intrusion au mercure ont été effectués sur le support de couche, sur le papier pré-couché, sur le papier double couche pré-couché et couché et sur le papier double couche calandré. L'objectif final de ces analyses était d'obtenir les renseignements sur la partie couchée, pré-couche et cou-che supérieure, uniquement. En effet, lorsque le test est effectué, la structure complète de la feuille est analysée, soit le support de couche et les deux couches. Une caractéris-tique spécifique de cette étude est d'avoir utilisé une particularité du programme Auto-pore® de la mesure d'intrusion au mercure pour optimiser l'analyse des données de la double-couche. En effet, le programme Autopore® permet de soustraire à l'analyse de porosité les données relatives à une mesure à vide du bulbe contenant l'échantillon afin de tenir compte de l'expansion du bulbe sous l'effet de la pression d'intrusion ainsi que du tube indiquant le volume d'intrusion lors du test à haute pression. Nous avons utili-ser cette particularité afin de « retrancher» les données de porosité du papier support de couche en le considérant alors comme une valeur de porosité de base ou une porosité hors étude « à enlever» pour faciliter l'analyse de la pré-couche. Ainsi, il devenait pos-sible de conserver uniquement les valeurs reliées directement à la pré-couche sans une distorsion qui serait causée par le support de couche. La même procédure a été appliquée pour la couche supérieure et la couche calandrée afin de pouvoir isoler les résultats per-tinents pour chacune des composantes expérimentales au niveau de la structure de la feuille. Cette nouvelle méthode, avec ses limites (la mesure étant destructive, ce n'est jamais « exactement le même échantillon de papier» qui peut être évalué avant et après couchage ou calandrage), permet cependant d'isoler chacune des couches les unes des
autres en plus d'avoir une vue d'ensemble complète de la structure étudiée. Il devient alors plus facile d'analyser les résultats des traitements mécaniques ou modifications appliqués.
Le tableau suivant présente la liste de toutes les conditions qui composent les 4 groupes de l'étude, conçus avec pour objectif principal l'étude des différentes modifications de la pré-couche, soit: (1) 20 parties de substitution de kaolin de la pré-couche, (2) pré-calandrage du support de couche et de la pré-couche, (3) substitution du latex et de l'épaississant de la pré-couche et (4) 100 parties de substitution du/des pigments de la pré-couche. Nous avons choisi de présenter dans ce sommaire étendu en plus en détail les résultats et l'analyse effectués lors de la substitution de 20 parties de kaolin dans la pré-couche (groupe 1) et seulement une brève conclusion pour chacun des trois autres groupes. ee choix a été fait afin de démontrer comment sont présentés et analysés les résultats tout en préservant le modèle du résumé en français.
Dans le groupe 1 qui comporte 4 conditions de substitution de 20 parties de kaolin par des pigments de différentes grosseurs de particules et de forme, la recette « standard » ou de base pour la pré-couche, aussi valable pour l'ensemble de l'étude, comprend 100 parties de Gee (1,4 Ilm). Pour ce groupe 1, les kaolins de substitution sont: un kaolin NO.1 (brillance élevée, particule fine de dimension moyenne 0.469 Ilm), un kaolin No.2 (brillance régulière, dimension 2.13 Ilm), un kaolin grossier délaminé (brillance réguliè-re, dimension 5.312 Ilm) et un kaolin d'ingénierie grossier (rapport longueur/épaisseur élevé, dimension 6.329 Ilm). L'analyse des résultats du groupe 1 démontre que substi-tuer 20 parties de kaolin dans une formulation contenant 100 parties de Gee dans la formulation de la pré-couche permet de moduler la structure de la pré-couche et d'obtenir les propriétés d'impression désirées. De la même façon, nous avons montré que l'absorption capillaire, le mouvement préférentiel de divers éléments de la pré-couche et de la pré-couche ou la pénétration forcée des liquides de la pré-couche supérieure dans la pré-couche sont des mécanismes potentiels pour expliquer comment la structure de la couche supérieure est modifiée par la présence de la pré-couche. Nous avançons de plus l'hypothèse que la pénétration forcée ou une partie de celle-ci est probablement causée par le remouillage de la pré-couche lorsqu'une couche y est appliquée par-dessus.
Tableau Formulations de pré-couches reliées à chacun des groupes de l'étude.
100 parties Gee (lA ~m)
20 parties de kaolin No. 1 - Brillance élevée et particule - . . .
--20 parties de kaolin No. 2 - Brillance régulière (2.13 ~m) 20 parties de kaolin grossier délaminé (5.312 ~m) 20 parties de kaolin d'ing. grossier -facteur de forme élevé
(6.329 ~m)
Support de couche calandré 100·e - 50 kN/m Support de couche calandré 100·e -200 kN/m
Pré-couche calandrée 1 oo·e - 50 kN/m Pré-couche calandrée 100·e -200 kN/m Support de couche calandré 200·e - 50 kN/m Support de couche calandré 200·e -200 kN/m
Pré-couche calandrée 200·e - 50 kN/m Pré-couche calandrée 200·e -200 kN/m Pré-couche 100 parties Gee (lA ~m) + Latex acrylique
Pré-couche 100 parties Gee (lA ~m) + Protéine 100 parties BPSD Gee (0.659 ~m) 100 parties BPSD Gee (0.3598 ~m)
100 parties pee (00499 ~m) 100 parties de kaolin brésilien (0.548 ~m)
100 parties NPSD Gee (0.6593 ~m) eontrôle Groupe 1 20 parties de substitution de kaolin Group 2 Pré-calandrage du support de couche et de la pré-couche Groupe 3 Substitution S/A + Protéine Group 4 Substitution de 1 00 parties de pigment
BPSD= pigment avec une distribution de particules larges NPSD= pigment avec une distribution de particules étroites
3 couches = 3 échantillons 3 couches x 4 pré-couches = 12 conditions 3 couches x 4 calandrage du support de couche et 4 calandrage de la pré-couche = 24 conditions 3 couches x 2 pré-couches 6 = conditions 3 couches x 5 pré-couches = 15 conditions
Une autre conclusion clé de notre étude est d'avoir mis en évidence l'importance des différents types de latex utilisés pour la fabrication de la couche supérieure dans la prise d'encre (cf. l'analyse des propriétés d'impression DELTACK). Le latex avec une base de butadiène résulte toujours en une force maximale de triant d'encre plus élevé que pour le latex à base d'acrylique. Les deux latex à base d'acrylique utilisés dans la fabri-cation de la couche supérieure ont un comportement similaire sur la prise d'encre com-me il est possible de le déduire sur l'analyse de courbes DELTACK d'aspect similaire. Finalement, nous avons montré qu'il est possible d'obtenir la même prise d'encre avec
des structures poreuses très différentes. Les deux situations observées sont (a) le cas de structures avec des volumes de pores identiques mais des diamètres de pores moyens très différents ou (b) le cas de volumes de pores très différents avec des diamètres moyens de pores identiques.
Nous avons proposé un mécanisme fondamental qui permet d'expliquer simplement ce phénomène particulier sur la base des changements dans la structure de la couche ayant pour origine les différentes pré-couches utilisées. De façon globale, les changements structuraux que l'on retrouve dans un complexe de structure pré-couche/couche sont en mesure de modifier comment l'encre et/ou les solvants de l'encre pénètrent préférentiel-lement à l'intérieur des deux différents types de structure, le tout résultant en des com-positions finales du film d'encre très différentes. Le film d'encre peut être épais ou mince mais cependant posséder la même force de tirant reliée à la prise d'encre dans des structures différentes.
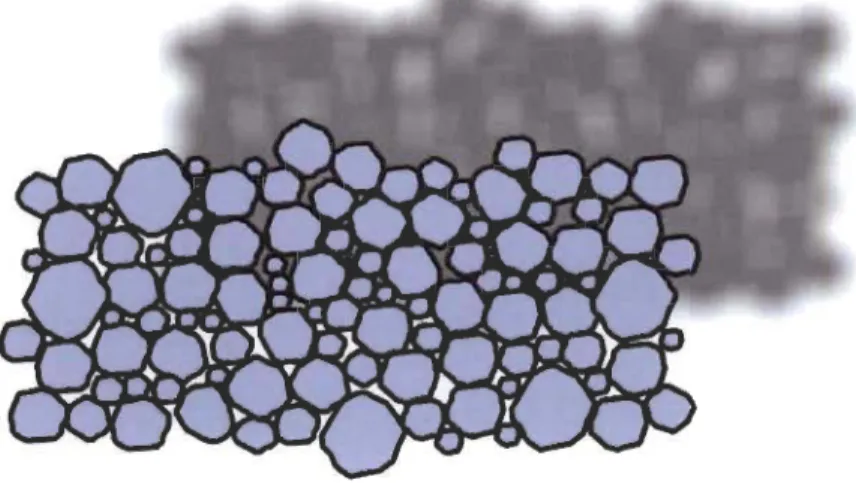
L'illustration suivante permet de visualiser le mécanisme proposé pour la fixation de l'encre dans les 2 cas. Elle représente l'épaisseur du film d'encre en relation avec une force de tirant maximum égale et la structure de la pré-couche: structure de pré-couche fermée à gauche et ouverte à droite démontrant la possibilité de filtration/pénétration préférentielle des composantes de l'encre.
Le groupe deux (2) de notre étude a été conçu afin de vérifier l'effet du pré-calandrage du support de couche et de la pré-couche sur un papier double-couche basé sur l'hypothèse que ce pré-calandrage pouvait affecter la structure supérieure sur la base d'effets physiques de pénétration des fluides vus pour la prise d'encre mais ici appliqués à la pré-couche ou à la couche supérieure. Pour toutes les conditions, le pré-calandrage résulte en une diminution de la dimension des pores et conséquemment, d'une réduction du volume total de pores lorsque comparé à la condition de contrôle qui n'a subit aucun pré-calandrage. L'analyse des courbes de distribution des pores n'a cependant pas per-mis d'identifier de tendance généralisable pouvant expliquer comment une structure double-couche pouvait être affectée par le pré-calandrage. Par contre, l'analyse du vo-lume total de pores a montré des tendances généralisables en ce qui concerne les effets de température ou de pression; ce qui s'avère un outil puissant pour comprendre com-ment le pré-calandrage peut modifier les structures de papier double-couche.
En effet, nous avons trouvé que le pré-calandrage à 100°C résulte en un volume de pores de la structure de la pré-couche plus élevé que lors d'un pré-calandrage à 200°C. Com-me anticipé, le pré-calandrage à 200 kN/m produit quant à lui un volume de pores total plus faible que le pré-calandrage à 50 kN/m. Les résultats obtenus pour la structure de la couche sont plus surprenants et ce, pour le pré-calandrage du support de pré-couche et de la pré-couche elle-même. Nous avons observé deux effets qui semblent a priori en opposition mais que nous avons pu expliciter simplement par transposition d'effet de filtration d'une structure à l'autre. En effet, (a) lorsque le support de couche a été pré-calandré, le volume total de la couche est plus élevé à 100°C qu'à 200°C, et (b) à l'opposé, lorsque la pré-couche a été pré-calandrée, le volume total de la couche est plus élevé à 200°C qu'à 100°C.
Le mécanisme que nous proposons afin d'expliquer de tels résultats en apparence contradictoire est basé sur la filtration et la compaction d'une structure qui survient lors des opérations de couchage, les effets étant dus au mouvement de l'eau et des matériaux constituants de la couche lorsqu'une couche humide est appliquée par-dessus une autre surface. Assurément, la surface d'une structure poreuse devient plus ou moins ouverte selon le calandrage appliqué et peut ainsi contrôler la filtration et la compaction. Le
pré-calandrage à haute température de la précouche a un impact direct sur la structure de la couche (fermeture des pores). Le pré-calandrage du support de couche a le même effet lorsque la pré-couche est appliquée mais la situation est nécessairement inversée lorsque la couche est appliquée; il y a donc transposition d'effet de filtration d'une couche à l'autre ou « effet domino ». En effet, considérant que le papier couché double-couche comporte trois couches, soit papier de base, pré-couche et couche supérieure : une struc-ture de base (papier de base ou pré-couche) plus fermée rend par filtration préférentielle la couche supérieure plus ou moins ouverte avec un effet subséquent (<< domino ») sur la couche supérieure finale. Finalement, nous expliquons qu'il est possible d'obtenir les mêmes caractéristiques d'impressions avec les différentes structures créées par pré-calandrage. Une fois encore, l'effet de la température du pré-calandrage est ici le facteur prédominant. En conclusion, nous avons donc pu montrer qu'il est possible de contrôler la microstructure et même la nanostructure Gusqu'à 30 nm) d'un papier double-couche par le pré-calandrage, et ainsi, qu'il est possible de contrôler les caractéristiques d'impressions des papiers double-couches.
Concernant l'utilisation de protéine ou de latex S/A dans la pré-couche en substitution d'une combinaison initiale SIB+CMC (groupe 3), la conclusion générale est que cette pratique n'apporte pas d'avantages significatifs, spécialement pour la substitution du latex SI A. Par contre, dans le cas de la substitution du CMC par la protéine, nous avons pu montrer que la protéine change la structure en élargissant la distribution des pores de la pré-couche. Il serait par contre hasardeux de généraliser les avantages de l'utilisation de ce produit car une seule condition a été réalisée. Une étude plus approfondie impli-quant d'autres conditions expérimentales serait nécessaire pour de futurs travaux. Les résultats d'impression n'ont quant à eux apporté aucune conclusion qui soit différente des autres conditions des autres groupes d'étude.
Concernant la substitution de 100 parties de pigment (groupe 4) de la pré-couche, l'analyse effectuée nous permet de confirmer que la structure de la pré-couche influence grandement la structure finale d'un papier double couche. Nous avons observé ente au-tres l'importance clé de la distribution et le diamètre moyen de particules afin de déter-miner comment ces facteurs influencent la structure globale constitué par l'ensemble
pré-couche/couche supérieure. Plus spécifiquement, nous avons trouvé et expliqué comment le volume de pores total est inversement proportionnel à la distribution des particules de pigment. Nous avons aussi montré que la surface totale des pores décroit avec la dimension de particules et qu'elle est inversement proportionnelle à la dimension de particules dans le cas de distribution de particules élargie. Finalement, nous avons confirmé notre hypothèse, à savoir que le diamètre moyen des particules est directement relié à la dimension du pigment utilisé dans la pré-couche.
En conclusion générale, nous avons proposé un mécanisme en deux phases, qui a pu être validé dans d'autres conditions au niveau de la formation de la pré-couche et de la cou-che supérieure pour expliquer comment la même force de tirant, résultant de prises d'encre donc de mécanismes d'absorption, pouvait être obtenue avec structures de cou-che très différentes. En effet, la filtration d'une encre ou d'une sauce de couchage est basée sur les mêmes mécanismes physiques. Concernant la prise d'encre, nous avons montré que, dans un cas, des volumes de pores similaires combinés à des diamètres de pores moyens très différents et, dans un autre cas, des volumes de pores passablement différents combinés à des diamètres moyens de pores similaires pouvait résulter en une même force de tirant maximum reliée au film d'encre transférée au papier double-couche. Le mécanisme proposé pour expliquer cet effet est basé sur la pénétration préfé-rentielle des solvants de l'encre qui contrôle la prise d'encre ainsi que la variation du transfert de l'encre relié aux différentes structures de couche qui contrôle l'épaisseur du film d'encre: les deux ayant des effet opposés. La filtration de la sauce de couchage obéit quant à elle au même mécanisme.
Abstract
The main objective of present study was to establish how modification in the design and structure of the precoat in double-coated papers would control the final properties, mainly printing characteristics, of the double-coated paper. To achieve such an objec-tive we needed first to develop different precoat structures based on commercially feasi-ble and applicafeasi-ble practices and second to fine tune the mercury intrusion method to be able to differentiate sometimes minute but important structural differences brought about by modifications in the precoat formulation, application, and treatment.
Mercury intrusion is a well established method which is used extensively within the pulp and paper industry. The test provides a great deal of information to the papermaker about the paper and coating structure which may vary widely depending on the choice of materials used in the coated paper production. The mercury intrusion test has been shown to be invaluable in predicting or troubleshooting many areas such as blister resis-tance and printing issues. As mercury intrusion is time consuming and expensive, every effort must be made to ensure that the data collected is fully investigated and interpreted to take complete advantage of the information on pores structure and pores distribution.
The specifically designed method of mercury intrusion curves analysis was developed to examine and analyse a wide range of commercial operating conditions, including base paper calendering, different pigment and binder combinations. In essence, we determine cut-off values for the different sections of the mercury intrusion curves to be able to compare these curves on a same base-line. The mercury intrusion curves thus modified are designed as "normalized".
Present study of double-coated layer structures focuses on the effect of the precoat por-tion of a double layer wood free coated paper. Many different precoat and surface treat-ment conditions are analyzed to verify, and understand the· relationships between the various precoat combinations and printing characteristics in order to pro vide the best printability.
In the experimental design, 12 different precoat formulations and 8 calendering condi-tions are analysed. The pigment of the precoats varies for each of the 12 precoats, and consists of different pigments, including broad ground calcium carbonate, fine number one (#1) clay, delaminated clay, number 2 (#2) clay, structured clays, and fine precipi-tated calcium carbonate. The binder and additive system for aU of the coatings are kept constant, with one exception where the latex is modified. The latex used for the major-ity of the coatings is standard styrene butadiene (S/B) latex.
AdditionaUy, one selected precoat serves as a standard or reference. Eight different cal-endering iterations are used, i.e. calcal-endering the base paper at four different temperature and pressure combinations, and calendering the precoated paper at 4 different tempera-ture and pressure combinations. AU of the precoat application and calendering is per-formed at a pilot scale at the Centre International de Couchage (CIC) in Trois-Rivières, Quebec, Canada. Each precoat is applied to both sides of the base paper by blade coat-ing at 12 g/m2
•
Including the calendering iterations, there are then 20 total precoat conditions. Three different topcoats are applied to each precoat, bringing the total number of conditions examined to 60. The pigment slip and additive portion of the topcoats are kept constant, and only the latex varies. The three different latexes used are styrene-butadiene acry-lonitrile (SIB/ ACN), styrene acrylate (S/ A), and styrene-acrylate acrylonitrile (S/ AI ACN). The topcoats are applied to one side of the precoated paper at 12 glm2
via the laboratory CLC equipment. AU these topcoats conditions are tested with the Prütbau DEL T ACK and a curve of each condition is used to examine which conditions would have the best surfaces for offset printing.
FinaUy, we have proposed and validated a physical mechanism based on preferential filtration, structural rearrangement, and filtration domino effect of one structure to the next to explain how the precoat structure influences both the structure and the printing characteristics of the double-coated paper.
Keywords
English:
Coated paper, double-coated paper, precalendering, calendering, soft nip calendering, pilot coater, pigment, latex, filtration mechanisms, coating structure, layered structure, pigment packing, pore size, pore distribution, pore volume, micro-structure, nano-structure, printing characteristics, print quality, mercury intrusion, contact angle, Prüf-bau DEL TACK, microscopie evaluation, projection on latent structure (PLS), normali-zation method.
Français:
Papier couché, papier couché double-couche, pré-calandrage, calandrage, calandrage à
pince molle, coucheuse pilote, pigment, latex, mécanismes de filtration, structure de la couche, structure stratifiée, empilement des pigments, tailles de pores, distribution des pores, volume des pores, microstructure, nanostructure, caractéristiques d'impression, qualité d'impression, intrusion au mercure; angle de contact, Prüfbau DELTACK, év a-luation microscopique, projection sur structure latente (PLS), méthode de normalisation.
Table of Contents
Preface ... iii Acknowledgements ... : ... iv Résumé en français ... ii Abstract ... x Keywords ... xiiTable of Contents ... xiii
L · 1st 0 fP· 19ures ... XVll .. List of Tables ... xxiv
List of Equations ... xxvi
L · 1st 0 fA ppen lX ...d· ... XXV111 ... Abbreviations and Symbols ... xxix
Abbreviations ... xxix
Symbols ... xxxii
Chapter 1 -Introduction ... 35
Chapter 2 - Literature review ... 36
2.1 Paper (Base stock) ... 37
2.2 Pigments and latex ... 39
2.2.1 Clay ... 43
2.2.2 Calcium Carbonate ... 45
2.2.3 Latex ... 47
2.3 Calendering ... 54
2.4 Multilayer coated paper ... 59
Chapter 3 - Discussion and analysis of the characterization methods ... 64
3.1 Introduction ... 64
3.2 Contact angle method ... 67
3.2.1 Contact angle theory ... 69
3.2.2 Contact angle: test description ... 70
3.3 Mercury intrusion ... 71
3.3.1 Darcy's Law ... 71
3.3.2 Washburn Equation ... 72
3.3.3 Mercury porosimetry ... 74
3.3.4 Further considerations on liquid penetration of complex structures ... 75
3.4 Equipment and methods - Mercury intrusion ... 77
3.4.1 Repeatabili ty of the mercury intrusion test.. ... 81
3.5 Normalisation and optimization of the mercury intrusion data analysis ... 83
3.5.1 The hexadecane imbibition method and analysis ... 83
3.5.2 Coating layer cut offpoint.. ... 86
3.5.3 Separation ofthe precoat and the topcoat layers ... 90
3.6 Mercury Intrusion normalisation method ... 93
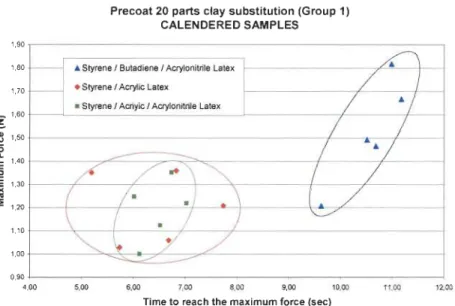
3.7 Scanning Electron Microscopy (SEM) ... 106
3.8 Prüfbau DELTACK method ... 108
3.8.1 Description of the method ... 108
3.8.2 DELTACK curve analysis ... ll1 3.8.3 Maximum in ink tack force ... 112
Chapter 4 - Experimental design ... 114
4.1 Experimentallevels selection ... 114
4.2 Precoated paper roll preparation ... 116
4.3 Top Coated Samples ... 118
4.3.1 Control of the top coat weight for the CLC samples ... 119
4.4 Calendering the top coated samples ... 120
Chapter 5 -Results and Analysis ... 121
5.2 Effects of20 parts clay substitution in the precoat layer (Group 1) ... 123
5.2.1 Ana1ysis of the precoat and topcoat structures: 20 parts clay
substitution (Group 1) ... 123
5.2.1.1 Analysis of the precoat and topcoat structure
through pore size distribution ... 123
5.2.1.2 Influence of the precoat (20 parts substitution) on
the topcoatlprecoat combined structure ... 126
5.2.1.3 Influence of the precoat structure (20 parts
substitution) on the topcoat structure ... 130
5.2.2 Printability variations related to 20 parts clay substitution in
the precoat (Group 1) ... 134
5.2.3 Contact Angle results comparison from Group 1 (20 parts
clay substitution) ... 141
5.2.4 Summary: 20 parts substitution in the precoat layer (Group
1) ... 143
5.3 Effect of calendering the base stock or the precoat layer (Group 2) ... 144
5.3.1 Analysis of the precoat and topcoat structures: calendering
base paper and precoated layer (Group 2) ... 145
5.3.1.1 Analysis of the precoat and topcoat structure
through pore size distribution ... 146
5.3.2 Printability variations related to precalendering the base
stock or the precoat layer (group 2) ... 154
5.3.3 Summary: base paper and precoated layer calendering
group (Group 2) ... 155
5.4 Effect on Styrene/Acrylic and Protein substitution in precoat layer
(Group 3) ... 157
5.4.1 Analysis of the precoat and topcoat structures through pore
size distribution: Styrene/ Acrylic and Prote in substitution
(Group 3) ... 157
5.4.2 DELTACK results comparison from Group 3 (SA latex and
protein substitution) ... 164
5.4.3 Summary: Latex and thickener substitution in precoat layer
(Group 3) ... 168
5.5 Effect on 100 parts substitution in the precoat layer (group 4) ... 168
5.5.1 Analysis of the uncalendered precoat and topcoat structures,
pore size distribution: 100 parts precoat pigment
5.5.2 Analysis of the calendered precoat and topcoat structures total pore volume, total pore area, and average pore
diameter: 100 parts precoat pigment substitution (group 4) ... 173
5.5.3 DELTACK results comparison from Group 4 (100 parts pigments substitution) ... 175
5.5.4 Surnmary: 100 parts substitution in the precoat layer (Group 4) ... 179
5.6 DEL T ACK and ink tack comparison of Groups and latex - Average Curves ... 179
5.7 Projection on a Latent Structure (Partialleast Square) Study ... 185
5.7.1 General presentation ofthe PLS method ... 185
5.7.2 PLS Results ... 188
5.7.3 PLS Study for 2 components -Effect ofprecoat pore volume on the final results ... 189
5.7.4 Effect of the latex ... 190
5.7.5 PLS study for 3 components ... 193
5.7.6 PLS study for 4 components ... 194
Chapter 6 - Conclusion ... 201 Bibliography ... 207 Appendix ... 216 Appendix 1 ... 216 Appendix 2 ... 219 Appendix 3 ... 226
Figure 2-1 Figure 2-2 Figure 2-3 Figure 2-4 Figure 2-5 Figure 2-6 Figure 2-7 Figure 2-8 Figure 2-9 Figure 2-10
List of Figures
A MSP (left) and blade (right) coated UL WC paper, where a 28
g/m2 wood containing base paper is coated with 5 g/m2 ••••.•••••••••••••••••• 39 Scanning electron microscopy of talc ... 41 Pore size comparison for large and small particle size pigments ... 42 Packing efficiency of pigments with two different particle size
diameter ... 43 Packing efficiency for a plat y and blocky pigments ... 44 Coating layer structure with high aspect ratio clay ... 44 Packing efficiency of precipitated calcium carbonate compared
with a blocky pigment ... 45
Pore structure for a GCC with a broad particle size distribution ... 47
Pore structure for a PCC with a narrow particle size distribution ... 47 Glass transition temperature (Tg) related to the level of styrene in
the latex ... 50
Figure 2-11 Film forming during drying process for two different Tg ... 51
Figure 2-12 Effect of the calendering on the pore structure ... 55 Figure 2-13 Water movement for a plat y pigment for an uncalendered (left)
Figure 2-14 Figure 3-1 Figure 3-2 Figure 3-3 Figure 3-4 Figure 3-5 Figure 3-6 Figure 3-7 Figure 3-8
and calendered (right) coating layer. ... 57 Double coated paper and base stock ... 59 Water drop with an angle lower than 90° (left) and greater than
90° (right) ... 67 Contact angle 8 between a substrate and a liquid ... 68 Droplet of non-wetting liquid on solid surface ... 69 Droplet on a solid surface at various absorption stages: (a) initial
deposition, (b) during absorption, and (c) at equilibrium, end of
the absorption ... 70 Droplet deposit, measurement and final results for angle lower
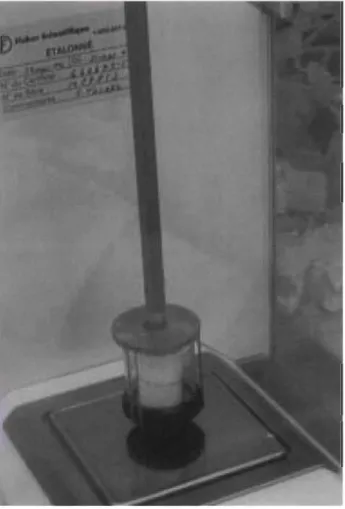
(left) and greater (right) than 90° ... 71 Wetting and non-wetting fluid in a capillary ... 73 Mercury Intrusion equipment ... 78 Sample holder with his stem mounted for the mercury intrusion
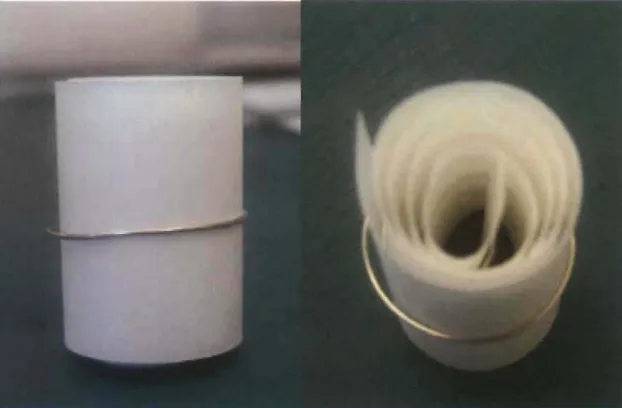
test ... 79 Figure 3-9 Paper sample set up for the mercury intrusion test.. ... 80 Figure 3-10 Paper sample in his penetrometer ... 81
Figure 3-11 Mercury intrusion curves with samples from the same piece of
paper ... 82 Figure 3-12 Example of surface defect affecting the mercury intrusion volume ... 84 Figure 3-13 Hexadecane absorption by a base paper sample ... 85 Figure 3-14 Mercury intrusion curves without normalization ... 88 Figure 3-15 Base paper pore structure with coating structure ... 88 Figure 3-16 Mercury intrusion curves with base paper blank - cut off point for
coating ... 89 Figure 3-17 Base paper pore structure with coating structure ... 89 Figure 3-18 Precoated subtraction for the coating structure ... 91 Figure 3-19 Example of curves with the precoat used as blank in the Autopore
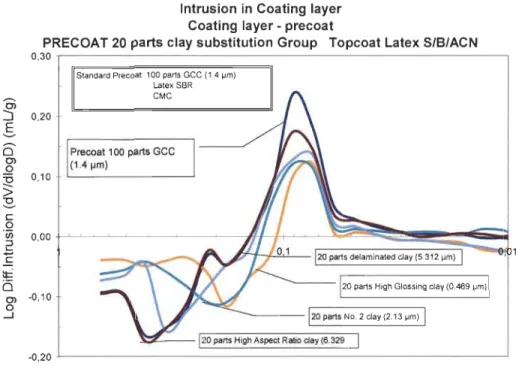
program ... 92 Figure 3-20 Top coating layers for the 3 different latexes with condition 1 ... 92 Figure 3-21 Top coating layers for Standard precoat-100 parts GCC (1.4 !lm)
and 20 parts clay substitution: High Glossing clay (0.469 !lm), No. 2 clay (2.13 !lm), delaminated clay (5.312 !lm), and High
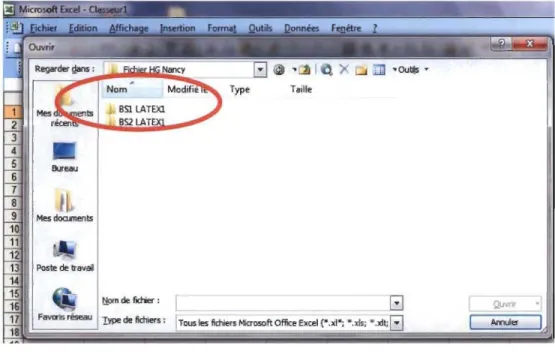
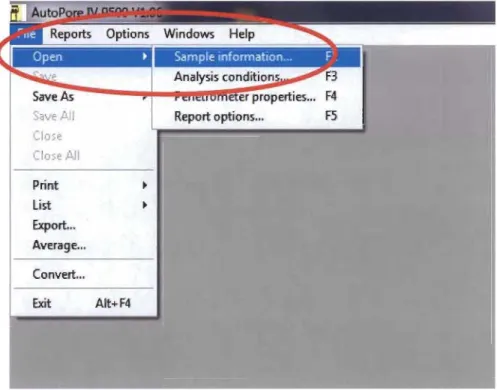
Aspect Ratio clay (6.329 !lm) ...... 93 Figure 3-22 Reference file to store the results related to a condition ... 94 Figure 3-23 Screen to open the mercury intrusion file with the Autopore®
pro gram ... 95 Figure 3-24 Dialog box to choose the desired file to analyse ... 95 Figure 3-25 Mercury intrusion file while open with Autopore® ... 96 Figure 3-26 Mercury intrusion file after clicking on advanced button ... 97 Figure 3-27 Dialog boxes to obtain the results normalised for the base paper ... 99 Figure 3-28 Dialog boxes to obtain the results normalised for the precoated
layer ... 100 Figure 3-29 Dialog boxes to obtain the results normalised for the
uncalendered double coated paper ... 101 Figure 3-30 Dialog boxes to obtain the results normalised for the calendered
double coated paper ... 102 Figure 3-32 Dialog box to start to generate excel spreadsheet with Autopore®
pro gram ... 103 Figure 3-33 Dialog box used to choose the .smp file to convert in excel
spreadsheet ... 104 Figure 3-34 Dialog box to choose the reports to convert in excel file ... 105 Figure 3-35 Converted file ... 105
Figure 3-36 Save the document on excel spreadsheet form ... 106 Figure 3-37 Defect in the calendered coating layer.. ... 107 Figure 3-38 Defect generated by blade coating ... 107 Figure 3-39 SEM measurement equipment.. ... 108 Figure 3-40 DELTACK measurement instrument ... 110 Figure 3-41 Example oftack development from a DELTACK test curve ... 111 Figure 3-42 Example of a complete DEL T ACK curve ... 112 Figure 3-43 TfUflcated DELTACK Curve to fit the Polynomial Curve ... l13 Figure 3-44 DELTACK Curves means and polynomial curves fitting ... 113 Figure 4-1 Schematic ofthe experimental design ... 115 Figure 4-2 StyrenelAcrylic latex molecule ... 116 Figure 4-3- Styrene/Butadiene latex molecule ... 116 Figure 4-4 Schematic representation of the cross section of the final paper
samples produced for the study ... 119 Figure 5-1 Mercury Intrusion in Precoated layer - Precoat 20 parts clay
substitution Group ... 124 Figure 5-2 Mercury Intrusion in Coating structure for condition with
Standard Precoat - 100 parts GCC (l.4llm) -uncalendered ... 125 Figure 5-3 Mercury Intrusion in Topcoating Layer -20 parts clay
substitution group -S/B/ACN latex - uncalendered ... 127 Figure 5-4 Mercury Intrusion in Topcoating Layer - 20 parts clay
substitution group -SI A latex - uncalendered ... 127 Figure 5-5 Mercury Intrusion in Topcoating Layer -20 parts clay
substitution group -Latex S/A/ACN - uncalendered ... 128 Figure 5-6 Total Pore Volume (TPV) Uncalendered Paper for Group 1
-Comparing the 3 latexes ... 129 Figure 5-7 Total Pore Volume (TPV) Calendered Paper for Group 1
-Comparing the 3 latexes ... 129 Figure 5-8 Average Pore Diameter (APD) Calendered Paper for Group 1
-Comparing the 3 latexes ... 130 Figure 5-9 Total Pore Volume (TPV) Topcoated layer for Group 1 as a
function of the particle size of the precoat layer -Comparing
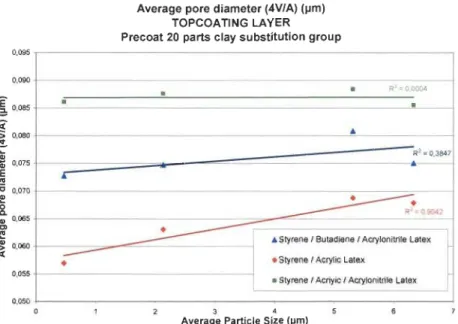
the 3 latexes ... 131 Figure 5-10 Average Pore Diameter (APD) Topcoated layer for Group 1 as a
function of the particle size of the precoat layer - Comparing
Figure 5-11 Capillary theory related to smaller pores in the precoat. Topcoat: GCC is in purple-blue, clay in light red. Precoat: GCC is in
orange and N°l fine clay is in yellow ... 133 Figure 5-12 Preferential movement theory related to bigger pores in the
precoat. Topcoat: GCC is in purple-blue, clay in light red.
Precoat: GCC is in orange and high aspect ratio clay is in grey ... 134 Figure 5-13 DELTACK - 20% clay substitution Group, SIB/ACN latex ... 135 Figure 5-14 Time to reach the maximum force function of the maximum force ... 136 Figure 5-15 Total Pore Volume function Time to reach the maximum force ... 136 Figure 5-16 Ink film thickness related to an equal ink tack force and the
precoat structure: close precoat structure (left) and open
precoat structure (right) ... 138 Figure 5-17 DELTACK maximum force versus total pore volume for 20 parts
clay substitution group ... 139 Figure 5-18 DELTACK maximum force versus average pore diameter for 20
parts clay substitution group ... 140 Figure 5-19 Contact angle for Coated Paper- 20% clay substitution Group ... 142 Figure 5-20 Contact angle for calendered Paper- 20% clay substitution Group ... 143 Figure 5-21 Uncalendered (left) and calendered (right) base stock use in this
study ... 145 Figure 5-22 Mercury Intrusion in Precoated layer - Base Paper and Precoat
Calendered Group ... 146 Figure 5-23 Mercury Intrusion in Topcoated layer - Base Paper and Precoat
Calendered Group Separated - SIB/ ACN latex ... 148 Figure 5-24 Mercury Intrusion in Coating Structure - Base Paper and Precoat
Calendered Group ... 151 Figure 5-25 Total pore volume (mLlg) for the standard reference (yellow),
calendered base paper (blue) and precoat layer (purple) for the
different pressures and 100°C used in calendering ... 152 Figure 5-26 Total pore volume (mLlg) for the standard reference (yellow),
calendered base paper (blue) and precoat layer (purple) for the
different pressures and 200°C used in calendering ... 153 Figure 5-27 DELTACK mean for each latex (8 calendering conditions) ... 154 Figure 5-28 Localisation of the dots for the precalendering, both base paper
and precoat, at lOO°C and 200°C for the S/B/ACN, S/A, and
S/AlACN latex ... 155 Figure 5-29 Mercury Intrusion in Precoating layer with 100 parts GCC (1.4
Figure 5-30 Mercury Intrusion in Coating structure for condition with 100
parts GCC (1.4 /lm) and Acrylic Latex -uncalendered ... 160 Figure 5-31 Mercury Intrusion in Coating structure for condition with 100
parts GCe (1.4 /lm) - Amphoteric Thickener (prote in)
-Uncalendered ... 160 Figure 5-32 Mercury Intrusion in Calendered Structure with 100 parts GCC
(1.4 /lm) -S/BI ACN Latex and Amphoteric Thickener
(prote in ) ... 161 Figure 5-33 Mercury Intrusion in Calendered Structure with 100 parts GCC
(1.4 /lm) -SA Latex and Amphoteric Thickener (protein) ... 162
Figure 5-34 Mercury Intrusion in Calendered Structure with 100 parts GCC
(1.4 /lm) -SiAl ACN Latex and Amphoteric Thickener
(protein) ... 162
Figure 5-35 Total Pore Volume (TPV) Coated Paper for Group 3 -Comparing
the 3 latexes. Precoat: aU 3 groups 100 parts GCC (1.4 /lm and
(A): SBR+CMC, (B): S/A+CMC, and (C) SBR+Protein ... 163
Figure 5-36 DELTACK - S/A Precoating layer and protein Group, latex,
SIBIACN ... 165
Figure 5-37 DELTACK - S/A Precoating layer and protein Group, S/A latex ... 166
Figure 5-38 DELTACK - SI A Precoating layer and protein Group, latex,
SiAl ACN latex ... 166
Figure 5-41 Mercury Intrusion in precoat layer - 100 parts substitution Group.
The reference curve GCC is in red ... 170
Figure 5-42 Mercury Intrusion in Coating Structure layer - 100 parts
substitution Group. Uncalendered samples ... 171 Figure 5-43 Mercury Intrusion in Topcoat Structure - 100 parts substitution
Group - S/BI ACN latex. Uncalendered samples ... 171 Figure 5-44 Mercury Intrusion in Topcoat Structure - 100 parts substitution
Group - SA latex. Uncalendered samples ... 172 Figure 5-45 Mercury Intrusion in Topcoat Structure - 100 parts substitution
Group - SiAl ACN latex. Uncalendered samples ... 172 Figure 5-46 Total Pore Volume (TPV) ofthe calendered precoatltopcoat
structure for Group 4 -Comparing the 3 latexes. The samples
are ordered in decreasing particle size distribution ... 174 Figure 5-47 Total Pore Area (TPA) Coated Paper for Group 4 - Comparing
the 3 latexes. The samples are ordered in decreasing particle
size distribution ... 174
Figure 5-48 Average Pore Diameter (APD) Coated Paper for Group 4
-Comparing the 3 latexes. Samples are ordered as a function of
Figure 5-49 DELTACK mean for each latex (5 conditions - 100 parts
substitution) ... 176 Figure 5-50 DELTACK maximum force versus total pore volume for 100
parts pigments substitution group- an conditions ... 178 Figure 5-51 DEL T ACK maximum force versus average pore diameter for 100
parts pigments substitution group - an conditions ... 178 Figure 5-52 General DELTACK Comparison curves for the 3 latex ... 181 Figure 5-53 DELTACK Curve for the control precoating layer - 100 parts
GCC (1.4 !lm) ... 182 Figure 5-54 DEL T ACK Average Curves for the 3 latexes for the 20 parts
substitution Group ... 182 Figure 5-55 DEL T ACK Average Curves for the 3 latexes for the base paper
and precoating layer calendering Group ... 183 Figure 5-56 DELTACK Average Curves for the 3 latexes for the Acrylic latex
and Protein substitution Group ... 183 Figure 5-57 DELT ACK Average Curves for the 3 latexes for the 100 parts
substitution Groups -Carbonates ... 184 Figure 5-58 DELTACK average curves for the 3 latex - Brazilian clay ... 184 Figure 5-59 2 principal axis on a fish picture ... 186 Figure 5-60 Graphie showing 2 principal components, the best correlation
with Y and the projection on a surface ... 187 Figure 5-61 PLS Regression - Projection graphie with the +/-0.2 square low
correlation area ... 188 Figure 5-62 Graphie projection for the Component 1 and 2 without precoated
pore volume variable ... 191 Figure 5-63 Graphie projection for the Component 1 and 2 with precoated
pore volume variable ... 191 Figure 5-64 PLS Result (2 Components) - Graphie for the 3 latex ... 192 Figure 5-65 PLS Result (2 Components) - Correlation factor R2 projection
graphie ... 192 Figure 5-66 PLS Result (3 Components) - Most important variables in order
of their importance ... 194 Figure 5-67 PLS Result (3 Components) - Correlation factor R2 projection
graphie ... 194 Figure 5-69 PLS Result (4 Components) - Most important variables in order
of their importance ... 196 Figure 5-70 PLS Result (4 Components) - Graphie projection for the
Figure 5-71 PLS Result (4 Components) - Graphie projection for the
Component 3 and 4 with precoated variable ... 198 Figure 5-72 PLS Result (4 Components) - lnk Tack Force ... 198
Figure 5-73 PLS Result (4 Components) - Time to get the maximum force
with DELTACK ... 199
Figure 5-74 PLS Result (4 Components) - Pore Volume for uncalendered
paper ... 199
Figure 5-75 PLS Result (4 Components)- Pore Volume for calendered paper ... 200
Figure 5-76 PLS Result (4 Components) - Contact Angle ... 200
Figure 6-3 DELTACK Average Curves for S/B/ACN latex, S/A latex and
SiAl ACN, 100 parts GCC (1.4 !-lm) ... 219
Figure 6-4 DEL T ACK - 20% clay substitution Group, SIBI ACN latex ... 219
Figure 6-5 DELT ACK - 20% clay substitution Group, SI A latex ... 220
Figure 6-6 DELT ACK - 20% clay substitution Group, SiAl ACN latex ... 220
Figure 6-7 DELT ACK - Base Paper and Precoated layer Calendering Group,
SIBI ACN latex ... 221
Figure 6-8 DELT ACK - Base Paper and Precoated layer Calendering Group,
SI A latex ... 221
Figure 6-9 DELT ACK - Base Paper and Precoated layer Calendering Group,
SiAl ACN latex ... 222
Figure 6-10 DEL T ACK - SI A Precoating layer and prote in Group, latex,
S/B/ACN ... 222
Figure 6-11 DEL T ACK - SI A Precoating layer and prote in Group, SI A latex ... 223
Figure 6-12 DEL T ACK - SI A Precoating layer and protein Group, latex,
SiAl ACN latex ... 223
Figure 6-13 DELT ACK - 100% Pigment substitution Group, latex, SIBI ACN ... 224
Figure 6-14 DEL TACK - 100% Pigment substitution Group, SI A latex ... 224
Figure 6-15 DEL T ACK - 100% Pigment substitution Group, SiAl ACN latex ... 225
Figure 6-16 Correlation using equation 6-2 and 6-3 and showing correlating
List of Tables
Table 2-1 Monomers used to make SIB latex ... 48 Table 2-2 Monomers used to make S/ A latex ... 49 Table 2-3 Influence of different monomer latex composition on printing
properties ... 49 Table 3-1 Repeatability of the mercury intrusion test.. ... 82 Table 3-2 Surface Tension (mN/m) and Contact Angle (0) of the chemicals
used in this study ... 84 Table 3-3 Hexadecane test results BS 2007-1-1 ... 85 Table 3-4 Base paper hexadecane and pore diameter cut off points ... 86 Table 3-5 Coating layers cut off points (larger pores) ... 90 Table 3-6 Autopore® files use to explain the mercury intrusion method.
Related to BS1Latexl ... 93 Table 3-7 Prüfbau Instrument Settings for Sheet Offset and Web Offset ... 109 Table 3-8 Ink Test Settings for DELTACK Prüfbau test.. ... 109 Table 3-9 Prüfbau test settings ... 110 Table 4-1 Latex characteristics used in the study ... 115 Table 4-2 Precoated standard formulations and 20 parts substitution ... 117 Table 4-3 Calendering and Soft Nips Settings ... 117 Table 4-4 Precoat formulations - Latex and Amphoteric thickener ... 117 Table 4-5 Precoat formulations - 100 parts substitution ... 118 Table 4-6 Precoat Operation Parameters -Coater. ... 118 Table 4-7 Topcoat Formulations used with the CLC ... 120 Table 4-8 Laboratory Calendering Conditions ... 120 Table 5-1 Precoated formulations related with the group and the condition
number. ... 122 Table 5-2 Conditions for the 20 parts clay substitution - Group 1 ... 123 Table 5-3 Mean Contact Angle (0) values for Group 1 - Coated and
Calendered Paper ... 143 Table 5-4 Conditions for the calendering group - Group 2 ... 145 Table 5-5 Average volume structure (mLlg) for the precoat layer (Group 2) ... 147 Table 5-6 Average pore volume (mLlg) for the topcoat layer for each latex
Table 5-7 Conditions for the SI A precoat latex and amphoteric thickener
-Group 3 ... 157 Table 5-8 Conditions for 100 parts substitution -Group 4 ... 168 Table 5-9 Maximum ink tack force and time for aU conditions for the 3
latexes used in this study ... 181 Table 5-10 Modeling structure related to the components used ... 189 Table 5-11 Correlation factor R2 for 2 components - Results ... 191 Table 5-12 Correlation factor R2 for 3 components - Results ... 193 Table 5-13 Correlation factor R2 for 4 components - Results ... 195
1
~
W
2= +
-Tg
Tg
1Tg
2S
==Y
s
--'-
YI -
Y
sI
Ys - YSL
C O S ( ) = =-YL
List of Equations
Equation 2-1 ... 51 Equation 3-1 ... 67 Equation 3-2 ... 68Ys
-v
+
YL
-V
cos(B)
==
YS
-
L
Equation 3-3 ... 69Q=~M
A
17
L
Equation 3-4 ... 71k
=
Q
~17
(with unit m2)AM
Equation 3-5 ... 72K=~
TJ
.
EquatIon 3-6 ... 72Fout =
2
7rr
r
cos
e
Equation 3-1 ... 73p=
Fout 7r r2 Equation 3-2 ... 73p
= -
2
7rr
r
cosB
7rr
2 p=-4
r
cosB
D
Equation 3-3 ... 74 Equation 3-4 ... 74D
=712,54
.
P
EquatIon 3-5 ... 77Vint = vobs -t5Vblank +
[O
,
175(vb
~
"k
)IOglO ( 1
+l~O
)
]
-
V
b~,lk
(1-
<1>1{1-
exr[
P~
s
P
]) Equation 3-6 78Wabsorbed hexa = W hexa saturated base paper - W dry base paper Equation 3-8 ... 84
Vabsorbed hexa = Wabsorbed hexa / 0.77 Equation 3 -9 ... 84 Total Pore Volume = Vabsorbed hexa / W dry base paper Equation 3 -1 0 ... 84
y
=
ax
2+bx+c
Equation 3-11 ... 112y
=b
o+
b]X]
+
b
2X
2+ ••••.••••b
pX p
Equation 6-1 ... 227[ XJ
:
=[TJ
:
*
[PJ
:
+ [EJ
:
[Y]
:
=
[UJ
:
*
[Cr
+[FJ
:
Equation 6-2 ... 227 Equation 6-3 ... 227 Equation 6-4 ... 227List of Appendix
Appendix 1 Mercury Intrusion Test Procedure by Micromeritics and
calculating values description ... 216 Appendix 2 DELTACK Curves ... 219 Appendix 3 Projection on Latent structure (PLS) ... 226
Abbrev
i
ations and Symbols
Abbreviations 3D AVP BPSD CA CLC CMCCOY
Force GCC lA IGT kN/m MPa MPDV MPDA MSP NPSDThree Dimensional Space
Average Pore Diameter
Broad partic1e size distribution
Contact Angle
Cylindrical Laboratory Coater
Carboxy-methyl cellulose
Coefficient of variation
Maximum force (DEL T ACK Test)
Ground Calcium Carbonate
Image Area
Surface strength printability test
Kilo-Newton per meter (5.714 PLI per kN/m)
MegaPascal (lMPa=145.03 PSI)
Median Pore Diameter Volume
Median Pore Diameter Area
Metering size press
NIA P PCA P Cal PC PCC PLI PLS PPS PrVP PSI RDP RMS S/A S/AlACN S/B SIB/ACN SBR SEM Tg Time Non-Image Area Porosity
Principal Component Analysis
Precoating layer calendering pressure
Precipitated Calcium Carbonate
Pounds per linear inches
Projection on a latent Structure or Partial Least Squares
Parker Print Surf - roughness of the sheet
Precoated layer Pore Volume
Pounds per square inches
Research, Development and Production
Root mean square
Styrene/ Acrylic Latex
Styrene/ Acrylic/ Acrylonitrile Latex
StyrenelButadiene Latex
Styrene/Butadiene/ Acrylonitrile latex
Styrene/Butadiene latex
Surface electronic microscopy
Glass transition temperature
TPA Total Pore Area
T Cal PC Precoating layer calendering temperature
TPV Total Pore Volume
TPA Total Pore Area
VP Pore Volume for uncalendered paper
VPC Pore Volume for calendered paper
Symbols A b b C D flP F h H k K L Lfilter cake [Matrix] P Pe flP/L
Q
Qliquid filtration area flow coefficient correlation factor concentration coefficient of diffusion effective particle diameterpressure drop, pressure differential (Pa) filtration elements
distance
residual matrix of error permeability
coefficient ofpermeability or hydraulic conductivity. length or layer thickness
thickness of filter cake layer
symbol for a matrix ca1culation; the name of the matrix is symbolized by a capitalletter.
applied pressure
additional pressure applied with the capillary pressure pressure drop across the sample length (L)
flow
r
w
Q
Ra Rq Rt Rppss
S t uand t VrMB Vb Xe
~ ~f ~I q> <Dç
'JI capillary radiuscircumference of the ring (!-lm, around 10 cm)
air flow (!-lm3 *S-I)
roughness average
hydraulic radius
root mean square (RMS) roughness
maximum peak to valley height
Parker print surf roughness of paper (!-lm)
spreading coefficient
area of the porous medium cylinder defined by nR2 (R is the radius)
time
vector reducing number of planes between x and y
volume of ink imbibed by the layer corresponding bulk volume
flow direction
contact angle ofthe mercury on the pores (usually 130°-140° for paper)
dynamic viscosity (in this case, the coating color viscosity)
pore coefficient path coefficient average mass flow fractional void volume porosity
P 1-1 y Ys YL YSL fluid density
air viscosity at the measurement temperature (PA
*
s) surface tensionsuperficial tension of the solid (free energy of the solid)
superficial tension of the fluid (free energy of the fluid)
interfacial tension between the liquid and the solid.
Chapter 1 - Introduction
The need to improve paper properties is always what consumers request from the print-ers and the paper producprint-ers. As coated paper is a big part of the improvement, there is a need for high performance coatings. Coatings are applied to board and paper to pro vide a smooth surface and to improve the printing snap, often defined as the overall impres-sion of the print quality as perceived through human eyes in the pressroom. Most stud-ies are performed to identify the best pigment-binder combinations and thus obtain the right properties required by the papermaker for operations. The type and the amount of the various coating color components affect the mechanical, optical and liquid absorp-tion characteristics of the coated paper in a very complex manner. Considering printing characteristics, it is why the biggest challenge for the researchers still remains to find an optimum balance of paper properties for an ink drop let to pro vide a sharply defined printed dot on the coated paper surface. The droplet needs to have an optimal spread/penetration ratio [1] and to set fast, i.e. within the runnability limits of the print-ing process in the coatprint-ing structure. To achieve such ink setting properties, the coating color particles need to be located close to the paper surface [2]. This is particularly true for the offset printing process where a large amount of ink and water, up to 300% ink coverage through 4, and more, ink layer applications, are added to the paper during printing. A properly formulated coating off ers several options and the papermaker is continuously looking for new ways to take advantage of formulation options to improve properties such as brightness, opacity, smoothness, surface strength, ink setting, ink dry-ing, print gloss, etc [3]. The type of coating technology used also increases the chal-lenge to meet new operation and quality objectives. For example, the runnability ofhigh solids pigmented coating colors on the metering size press depends on a complex bal-ance between rheology and water retention [4-7]. The pulse dynamics generated by the nip in a metering size press or a roll applicator acting on coating colors play an impor-tant role in film splitting phenomena. Therefore, the development strategy for the meter-ing size press requires a new approach to create a necessary balance between dynamic water retention and rheology when using the new high viscosity (1000-1200 poise or Pa.s-1) formulations [8].
Chapter 2 - Literature review
One common way to increase the print quality of a paper sheet is through surface treat-ment, either coating and/or calendering. Papers designed to improve image sharpness and brightness need to be coated, i. e. one needs to apply a thin layer of aqueous suspen
-sion containing mineraI pigments and chemicals over a base sheet. This suspension is dried after application, the drying method contributes to the characteristics, either good or bad, of the dry thin, actually micrometers thick, layer.
In the last 2 decades, several studies tried to explain the factors that control the printabil-ity of the coated paper. The pore structure of paper coatings that could be modified us-ing a range of different mineraI pigments and binder contents, has been found by many researchers to have a significant effect on the coated paper printing characteristics [9].
The first identified paper structure parameter was the architecture of the pore structure for the base paper and the coating layer which together drive the final print properties. Most physical and functional properties of pigment coated papers are influenced to a greater or lesser extent, by the porous structure of the coating layer. For example, the number and the size of microvoids contribute to macroscopic properties such as bright-ness, light scattering efficiency, and opacity. The void structure also affects the flow of liquids and gases through the coating layer. Absorption of inks and fountain solutions during printing is controlled by the structure of the pore space close to the coating layer surface. The porous structure of a coating layer depends on the coating color formula-tion, pigments and their combinations, synthetic and natural binders, chemical additives (e.g. associative thickeners), coating color application, and the drying processes [10]. Therefore, it is obvious that the coated paper structure can be considered as a combina-tion of fibres, pigmentes), binder, and air volume. The air volume is directly influenced by the others parameters. A wide range of control of the coating pore size is possible using narrow particle size distribution kaolins and carbonates. Tuning the pore diameter to a desire target enables to control the print properties while still maintaining the de-sired gloss and optical properties. Once pore diameter and volume are controlled to the targeted, desired range, optimizing the binder package will further enhance the
proper-ties. While the pigments can create exceptional value to the final coated paper, mis-matched pigments may negatively affect optical performance and result in a poor print performance [11]. We may conclude that the pore structure of the surface layer will determine both the optical and print performance ofthe coated paper [12]. It is however important to understand how the structure may be affected by the size and shape of the components in the coating layer and how they are packed together [12].
The literature analysis is then closely related to the pore structure or network: a concept with its own terminology. To discuss pore structure, two terms needs to be defined; skeleton and skeletal element, as was done by Gane [13] : "If you think about a porous structure, what do you see? Imagine you are walking through the structure as you might walk through a network of caves underground. You perhaps see big rocks, sands and soil made walls of the cave. Perhaps you see other caves and channels on either side or even above and below. You are walking around in the pores; the solid material between the pores is the skeleton of the structure. Each part of the skeleton (big rocks, sands) between the pores/caves is a skeletal element. In other words, if you know the pore structure (the pore elements) you then need to know the solid structure to determine how the pores are arranged in space. The arrangement of the solid structure is known as the skeleton, and each part between the pore elements is a skeletal element" .
2.1 Paper (Base stock)
The application of a coating layer is a complex process dependent of many interactions between the components and the process. Notwithstanding all factors, the application must still be achieved on a paper surface designed to adequately receive a layer of coat-ing. The coating layer does not and will not hide a defect (Figure 2-1) or enhance the po or quality of the base paper. Base paper characteristics are very important to obtain a high quality final product and insure good printability [14, 15]. As an example, AI-Turaif [16] shows that gloss increases and roughness decreases when the substrate is changed from absorbent to non-absorbent. Another important aspect is the filler content in the base paper. Increasing the base paper filler content improves surface roughness,