RESEARCH ARTICLE
The influence of footwear on walking
biomechanics in individuals with chronic ankle
instability
Gabriel MoisanID1,2,3*, Martin Descarreaux2,3, Vincent Cantin2,3
1 Department of Anatomy, Universite´ du Que´becàTrois-Rivières, Trois-Rivières, PQ, Canada,
2 Department of Human Kinetics, Universite´ du Que´becàTrois-Rivières, Trois-Rivières, PQ, Canada,
3 Groupe de recherche sur les affections neuro-musculo-squelettiques (GRAN), Universite´ du Que´becà Trois-Rivières, Trois-Rivières, PQ, Canada
*gabriel.moisan@uqtr.ca
Abstract
Background/Purpose
The effects of footwear on the walking kinematics, kinetics and electromyography (EMG) of individuals with chronic ankle instability (CAI) at different speeds are still unknown. The objective of this cross-sectional study was to evaluate the kinematic, kinetic and electromy-ography differences between shod and barefoot walking at comfortable (CW) and fast (FW) speeds in individuals with CAI.
Methods
Twenty-one individuals with CAI walked on a 5-meter walkway shod and barefoot at CW and FW speeds. A force plate was used to record the ground reaction forces, a 3-D motion analysis system to record the lower limb kinematics and a surface EMG system to collect the gluteus medius, vastus lateralis, gastrocnemius lateralis, gastrocnemius medialis, pero-neus longus and tibialis anterior muscles activity. The dependent variables were ankle and knee angles and moments and normalized muscle activity. The shod and barefoot data dur-ing CW and FW were compared usdur-ing a one-dimensional non-parametric mappdur-ing analysis.
Results
The main results of this study were that individuals with CAI exhibited more ankle dorsiflex-ion angle, knee extensdorsiflex-ion and tibialis anterior muscle activatdorsiflex-ion during the beginning of the stance phase during shod compared to barefoot walking. Also, the biomechanical effects of shoes are similar during walking at FW and CW.
Conclusion
The biomechanical deficits associated with CAI were partly attenuated during the shod com-pared to the barefoot condition and these effects were similar at CW and FW. These findings are compatible with the concept that locomotor interventions using suitable shoes may enhance gait abilities in individuals with CAI.
a1111111111 a1111111111 a1111111111 a1111111111 a1111111111 OPEN ACCESS
Citation: Moisan G, Descarreaux M, Cantin V (2020) The influence of footwear on walking biomechanics in individuals with chronic ankle instability. PLoS ONE 15(9): e0239621.https://doi. org/10.1371/journal.pone.0239621
Editor: Fabio A. Barbieri, São Paulo State University (UNESP), BRAZIL
Received: March 11, 2020 Accepted: September 9, 2020 Published: September 24, 2020
Copyright:© 2020 Moisan et al. This is an open access article distributed under the terms of the Creative Commons Attribution License, which permits unrestricted use, distribution, and reproduction in any medium, provided the original author and source are credited.
Data Availability Statement: Part of the data (data of the shod condition) cannot be shared publicly because they were partly published in the Journal of Electromyography and Kinesiology (https://doi. org/10.1016/j.jelekin.2020.102399). Therefore, we only made available the data pertaining to the barefoot condition. The data are held in a public repository: Moisan, Gabriel (2020): The influence of footwear on walking biomechanics in individuals with chronic ankle instability. figshare. Dataset. https://figshare.com/articles/The_influence_of_ footwear_on_walking_biomechanics_in_
Introduction
Shoes are important in human locomotion, as they are the first interface between the body and the ground. Shoes are mainly worn to protect the feet from thermal and/or chemical injuries, to enhance daily comfort but also to modulate lower limbs’ biomechanics. During shod walk-ing, cadence [1], ankle plantarflexion [2], knee flexion [3] and knee flexion moments [4] are decreased and knee adduction moments [4], tibialis anterior muscle activity [5], peroneus longus muscle activity [5] and stride length [4] are increased compared to barefoot walking. Changes in lower limb biomechanics when wearing shoes have been associated with improve-ment in pain and function in individuals with musculoskeletal disorders [6,7]. Individuals with chronic ankle instability (CAI) could perhaps benefit from the biomechanical effects of wearing certain types of shoes, such as the decrease in ankle plantarflexion. CAI is character-ized by a continuum of residual impairments following a lateral ankle sprain and results in recurrent sprains and/or episodes of ankle “giving way” during locomotion [8]. During walk-ing, individuals with CAI exhibit increased ankle and rearfoot inversion, ankle plantarflexion, lateral foot vertical forces and peroneus longus muscle activity compared to healthy controls [9]. However, no previous study simultaneously identified the biomechanical differences between individuals with and without CAI when walking shod and barefoot. Also, no study has quantified lower limb biomechanical effects of wearing shoes during walking in individu-als with CAI. It has yet to be determined if biomechanical deficits associated with CAI can be attenuated by wearing shoes. Quantifying the biomechanical effects of shoes on individuals with CAI will help clinicians and researchers to better understand their potential benefits in the rehabilitation of this population.
In most studies quantifying the lower limb biomechanical effects of shoes, participants were asked to walk at a self-selected, comfortable speed, as shown by a recent systematic review [10]. Walking at a faster speed increases lower extremity muscle activity [11], joint moments [12], tibio-talar plantarflexion and hallux dorsiflexion at toe off [13]. As lower limb biome-chanics change as walking speed increases, shoes could induce different biomechanical effects at different speeds. There is a need to investigate the effects of shoes on lower limb biomechan-ics when walking at a faster speed in order to better understand the role of footwear during locomotion.
The objectives of this study were to quantify the effects of wearing shoes on lower limb EMG, kinematics and kinetics in individuals with CAI during walking and to assess if these effects change at a faster speed. It was hypothesized that wearing shoes will decrease the bio-mechanical deficits associated with CAI, such as the increased ankle plantarflexion, and that the effects will be greater when walking faster.
Materials and methods
Participants
Twenty-one individuals with CAI were recruited to participate in this cross-sectional study (seeTable 1). Participants were identical to the CAI group of a study investigating the bio-mechanical differences between individuals with and without CAI during shod walking [14]. Participants were included if they had one (or more) significant lateral ankle sprains that occurred more than one year prior to study onset and had self-reported functional deficits due to ankle symptoms that were quantified by a score of <90% and <80% on the Foot and Ankle Ability Measure (FAAM) Activity of daily living (ADL) and Sport (S) subscales, respectively. At least two episodes of an ankle “giving way” in the last six months and/or having a feeling of instability had to be reported by the participants in order to be included in this study.
individuals_with_chronic_ankle_instability/ 12465833DOI:10.6084/m9.figshare.12465833. Funding: This study was funded by the Canadian Institutes of Health Research (CIHR) and the Fonds de Recherche du Que´bec-Sante´ (FRQS) through scholarships received by the first author. The funders had no role in study design, data collection and analysis, decision to publish, or preparation of the manuscript.
Competing interests: The authors have declared that no competing interests exist.
Individuals were excluded from the study if they had a history of a lower extremity surgery or a fracture that needed a surgical realignment, a history of lower extremity musculoskeletal injury within the last three months, had any known condition that adversely affects gait or were undergoing treatment for CAI. Inclusion criteria were based on the recommendations of the International Ankle Consortium [15]. The Universite´ du Que´becà Trois-Rivières (UQTR) ethics committee (CER-16-226-07.21) approved the experimental protocol, and written con-sent was obtained from each participant. The potential participants were recruited through the university’s outpatient podiatry clinic and among the UQTR students.
Instrumentation
Kinematic markers were placed on the tested limb over the greater trochanter, the lateral fem-oral epicondyle, the lateral malleolus and the fifth metatarsal head. Two three-marker clusters were placed on the distal lateral one-third of the leg and thigh. During the shod condition, the marker over the fifth metatarsal head was attached directly to the shoe as determined by palpa-tion. For the sake of ecological validity, it was chosen not to cut holes into the shoe uppers in order not to decrease their stability. Also, a limitation of the data collection volume area was associated with the motion analysis system used. It was therefore not feasible to reliably place multiple markers on the foot in a non-colinear way. During a calibration trial, virtual markers were created over the medial femoral epicondyle and medial malleolus. The calibration trial was used to locate the hip/knee/ankle joint centers and subsequently calculate ankle and knee angles and moments during the dynamic trials. Nine Optotrak Certus cameras (Northern Dig-ital, Waterloo, Ontario, Canada) recording at a sampling rate of 100 Hz, collected the kine-matic data.
To collect ground reaction forces data, a force platform (Bertec Corp, Colombus, OH, USA) embedded in the floor on the participants’ path was used at a sampling rate of 1000 Hz. To record walking speed, electronic photocells timing gates (Brower Timing System, Draper, UT, USA) positioned 1.35 meters before and after the force platform were used.
Differential Ag surface EMG electrodes (Model DE2.1, Delsys Inc, Boston, MA, USA) were placed over the gluteus medius, vastus lateralis, gastrocnemius lateralis and medialis, peroneus longus and tibialis anterior muscles in the position outlined by the SENIAM guidelines [16]. At each electrode site, the skin was shaved, abraded with fine-grade sandpaper and wiped with alcohol swabs. A reference electrode was placed over the ipsilateral anterior superior iliac spine. The EMG signals were collected at a sampling rate of 1000 Hz and amplified with a gain of 1000 (CMRR > 92 dB at 60 Hz, input impedance of 10 GW; 12 bits A/D converter).
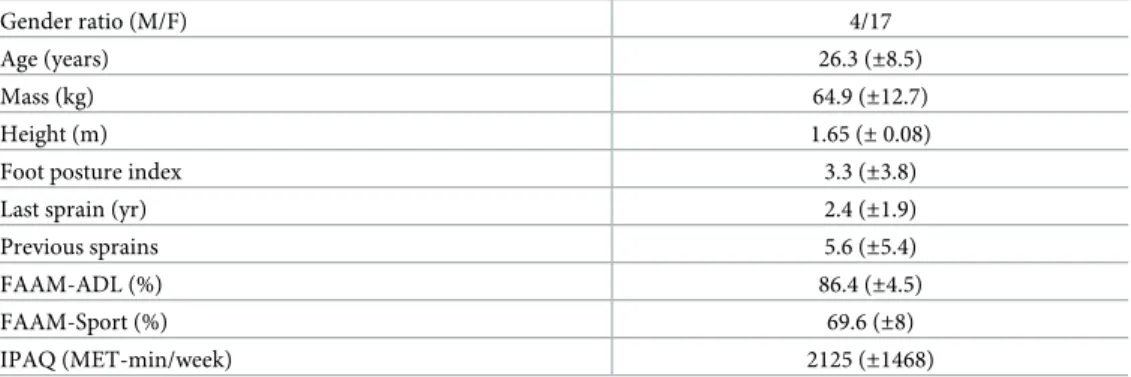
Table 1. Descriptive data.
Gender ratio (M/F) 4/17
Age (years) 26.3 (±8.5)
Mass (kg) 64.9 (±12.7)
Height (m) 1.65 (± 0.08)
Foot posture index 3.3 (±3.8)
Last sprain (yr) 2.4 (±1.9)
Previous sprains 5.6 (±5.4)
FAAM-ADL (%) 86.4 (±4.5)
FAAM-Sport (%) 69.6 (±8)
IPAQ (MET-min/week) 2125 (±1468)
Data reported as mean (standard deviation). https://doi.org/10.1371/journal.pone.0239621.t001
Protocol
Prior to the experimental protocol, the participants completed the validated French version of the FAAM-ADL and FAAM-S [17] and the International Physical Activity Questionnaire (IPAQ) [18]. They also reported the number of sustained ankle sprains and the time since the last sprain. In order to quantify foot morphology of the participants, the Foot Posture Index (FPI) was administered to them [19].
Prior to the data collection, a calibration trial was recorded. Then, participants had to walk on a 5-meter walkway at self-selected comfortable (CW) and fast (FW) speeds during two experimental conditions (shod and barefoot). The order of the conditions and speeds was ran-domly assigned across participants. The FW was described to the participants as the fastest walking speed possible to reach whilst keeping both feet simultaneously in contact with the ground. During the shod condition trials, all participants wore the same model of shoes, in the proper size (Athletic Works, Model: Rupert, Bentonville, AR, USA). The protocol consisted of completing five familiarization trials during which mean walking speed was calculated and five trials during which lower limb kinetics, kinematics and EMG was recorded. It was performed for each condition and speed for 20 consecutive recorded trials. A trial was rejected and imme-diately retaken when speed varied from±5% of the mean speed determined during the famil-iarization trials, if the foot was not entirely on the force platform, or if participants adapted their stride length or frequency in an attempt to hit the force platform.
Data processing. Kinematic and kinetic data were processed using Visual3D software
(C-motion, Inc., Germantown, MD, USA). The dependent variables were ankle and knee angles and moments. Before joint angle and moment calculations, marker trajectories and force platform data were respectively low-pass filtered using a 4th order Butterworth filter at a frequency of 6 Hz and 50 Hz. Interjoint motion was calculated using a Cardan sequence of X-Y’-Z”. Rotation around the X, Y’ and Z”-axes defined the extension/flexion, adduction/abduction and internal rotation/ external rotation, respectively. All movements were expressed as rotation of the distal segment in relation to the proximal segment. The kinematic model used in this study only allowed measuring the sagittal plane angle and moment (X) of the ankle joint. The calibration trial ankle angle was determined as the 0˚ of the joint. The knee and ankle joints centers were calculated as the mid-point from the medial-lateral aspect of each joint. Internal joint moments at the knee and ankle were calculated using inverse dynamics and were normalized to body mass (Nm/kg). Touchdown and toe-off of the stance phase were determined with the force platform using a 10 N threshold.
EMG data of all muscles were filtered with a 10 to 450 Hz 4th order Butterworth band-pass filter using a custom MATLAB file (Mathworks, Inc., Natick, MA). The Root Mean Square (RMS) of these data was calculated with a 100 ms-moving window. The RMS data of all trials were normalized with the mean peak RMS of the five shod trials at fast walking speed.
Analysis
Walking speeds during shod and barefoot trials at CW and at FW were compared with depen-dent t tests as the data were distributed according to the Shapiro-Wilk test. To compare the EMG, kinematic and kinetic data between shod and barefoot walking during CW and FW, curves analyses were performed using one-dimensional statistical non-parametric mapping (SnPM) [20,21]. Each individual stance phase was normalized to 100%. A Bonferroni thresh-old of significance ofP<0.0031 (P = 0.05/16) was used to correct for multiple comparisons.
When the SnPM(t) curves crossed this threshold for the biomechanical outcomes, supra-threshold clusters were created, indicating significant differences between the shod and bare-foot conditions in a specific location of the stance phase. The analyses were conducted using the open-source code (www.spm1d.org) in Python software (Version 2.7).
Results
Walking speed
During shod trials at FW, mean walking speed was faster compared to barefoot trials (2.00 m/s (SD:0.23) vs 1.89 m/s (SD:0.29) (P<0.001)). No difference was observed between conditions at
CW (1.38 m/s (SD:0.19) vs 1.32 m/s (SD:0.21) (P = 0.12)).
Kinematic and kinetic data
During the data collection session of one participant, technical difficulties occurred and thus this dataset was removed from the kinematic and kinetic analyses. Graphical representations of kinematic and kinetic patterns are presented inFig 1andFig 2.
During shod CW, participants exhibited increased ankle dorsiflexion angle from 0 to 5% (P = 0.001) and decreased dorsiflexion moments from 98 to 99% (P = 0.001) of the stance
phase compared to barefoot walking. They also exhibited increased knee extension angle from 0 to 11% (P<0.001), adduction moments from 85 to 93% (P<0.001), extension moments at
1% (P = 0.001) and from 91 to 94% (P<0.001) and decreased extension moments from 4 to 7%
(P<0.001), adduction moments from 2 to 4% (P<0.001) and internal rotation moments from
0 to 3% (P<0.001) and 89 to 94% (P = 0.001) of the stance phase during shod compared to
barefoot walking.
During shod FW, participants exhibited increased ankle dorsiflexion angle from 0 to 8% (P<0.001) and 84 to 99% (P<0.001) and decreased dorsiflexion moments at 99% (P = 0.001)
of the stance phase for shod compared to barefoot walking. At the knee, increased extension angle from 0 to 13% (P<0.001) and decreased internal rotation angle from 84 to 99%
(P<0.001), extension moments from 4 to 12% (P<0.001), adduction moments at 3%
(P = 0.001) of the stance phase were observed during shod compared to barefoot walking.
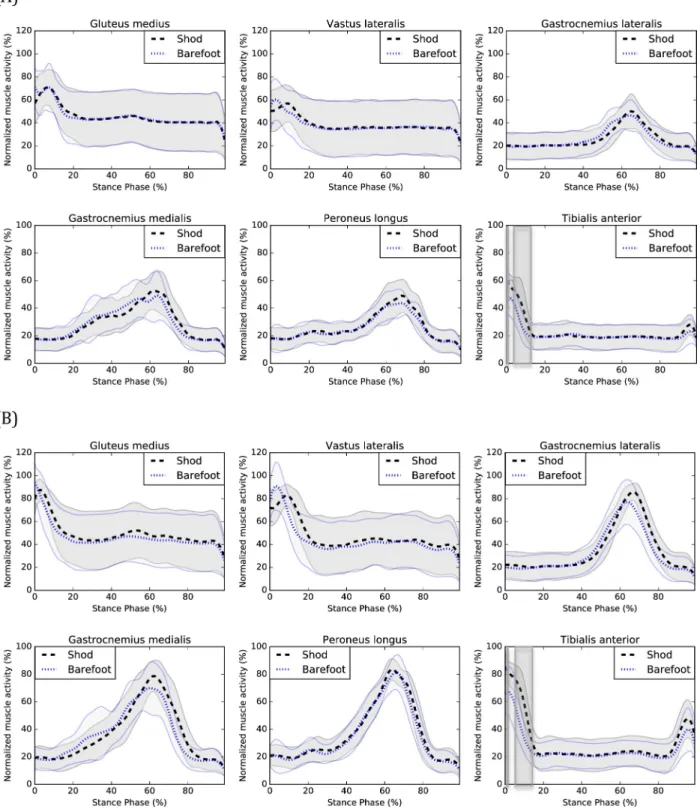
EMG data
Technical difficulties with the EMG measurements led to remove a few datasets (e.g. excessive perspiration). The following numbers of participants were used in the EMG analyses of the gluteus medius (20 CW, 21 FW), vastus lateralis (20 CW, 21 FW), gastrocnemius lateralis (19 CW, 19 FW), gastrocnemius medialis (20 CW, 21 FW), peroneus longus (19 CW, 20 FW) and tibialis anterior (20 CW, 21 FW) muscles.
At CW, tibialis anterior muscle activity was increased from 0 to 1% (P = 0.001) and 4 to
12% (P<0.001) of the stance phase during shod compared to barefoot walking.
At FW, muscle activity was increased for the vastus lateralis from 10 to 17% (P<0.001), the
gastrocnemius lateralis from 68 to 82% (P<0.001), the gastrocnemius medialis from 73–78%
(P<0.001) and the tibialis anterior from 0 to 1% (P = 0.001) and 5 to 14% (P<0.001) of the
stance phase during shod compared to barefoot walking. Graphical representations of EMG patterns are presented inFig 3.
Discussion
Individuals with CAI exhibited changes in EMG, kinetics and kinematics during shod com-pared to barefoot walking. The main kinematic effect of wearing shoes was increased ankle dorsiflexion during the beginning of the stance phase (CW and FW). Previous studies showed that individuals with CAI exhibit decreased ankle dorsiflexion (or increased plantarflexion) compared to healthy counterparts during walking [22,23]. The posterior part of the talar trochlea is narrower than the anterior part [24]. When the ankle joint is in a dorsiflexed posi-tion, the anterior part of the talar trochlea is in contact with the articular surfaces of the
malleoli, decreasing the talo-crural space width [25] and increasing ankle stability [26]. There-fore, the decreased ankle dorsiflexion during walking could place individuals with CAI at more risk of sustaining a lateral ankle sprain [8]. As most lateral ankle sprains are sustained during the initial impact of the foot with the ground during locomotion [27–29], wearing shoes could perhaps attenuate the risk of sustaining lateral ankle sprains during walking. In fact, in our study, most shoes’ significant effects were observed during the beginning of the
Fig 1. Kinematics of shod and barefoot walking during (A) CW and (B) FW. Means of the shod (black) and barefoot (blue) conditions are respectively represented by dotted lines and standard deviations are observed between the full lines. Significant between-group differences are observed in the shadowed region. df: dorsiflexion, pf: plantarflexion, ext: extension, flex: flexion, add: adduction, abd: abduction, Irot: internal rotation, Erot: external rotation.
stance phase. Prospective studies are needed to determine to what extent wearing shoes can decrease the risk of sustaining lateral ankle sprains and what types of shoes are the most effi-cient. This is especially important as previous studies showed that individuals with CAI still
Fig 2. Kinetics of shod and barefoot walking during (A) CW and (B) FW. Means of the shod (black) and barefoot (blue) conditions are respectively represented by dotted lines and standard deviations are observed between the full lines. Significant between-group differences are observed in the shadowed region. df: dorsiflexion, pf: plantarflexion, ext: extension, flex: flexion, add: adduction, abd: abduction, Irot: internal rotation, Erot: external rotation.
Fig 3. EMG of shod and barefoot walking during (A) CW and (B) FW. Means of the shod (black) and barefoot (blue) conditions are respectively represented by dotted lines and standard deviations are observed between the full lines. Significant between-group differences are observed in the shadowed region.
exhibit biomechanical deficits compared to healthy counterparts during shod walking [9]. The results of our study are consistent with those of Oeffinger et al. [2] which also observed increased ankle dorsiflexion when wearing shoes during walking. Furthermore, the increased knee extension during the beginning of the stance phase found in our study is consistent with the results of Zhang et al. [3]. This could represent a compensation for the increased ankle dor-siflexion and may be associated with the increased stride length when wearing shoes [4]. The combination of the increased ankle dorsiflexion and knee extension are also observed when comparing shod and barefoot running [30].
Knee adduction moments were decreased from 2 to 4% (CW) and at 3% (FW) of the stance phase of walking and knee extension moments were increased at 1% (CW) and decreased from 4 to 7% (CW) and 4 to 12% (FW) of the stance phase. However, when visually inspecting the knee frontal and sagittal moments curves (seeFig 2), one can observe a temporal delay sug-gesting that wearing shoes delays the peak knee adduction and flexion moments. It is also observed for the vastus lateralis muscle activation (FW) (seeFig 3), suggesting that wearing shoes delays the activation of this muscle which is consistent with previously published results [31]. This delayed vastus lateralis activation could perhaps be explained by the delayed peak knee adduction and flexion moments.
An increased activity of the gastrocnemius medialis and lateralis muscles (FW) was also observed during the end of the stance phase, which is consistent with the results of Franklin et al. [5], which also found an increased activity of the gastrocnemius medialis muscle during the latter part of the stance phase when wearing shoes. The increased activity occurred shortly after the peak amplitude during the beginning of the propulsion phase of walking. One of the main functions of the gastrocnemius medialis and lateralis muscles is to facilitate the anterior progression of the center of pressure and prevent the center of mass of dropping too low dur-ing the propulsive phase [32]. When walking with shoes, individuals with CAI may need a greater contribution of the gastrocnemii muscles for the propulsion to be efficient. Finally, increased tibialis anterior muscle activity was observed when wearing shoes during the begin-ning of the stance phase. This result is consistent with those of previous studies [5,33] and could be responsible for the increased ankle dorsiflexion during the beginning of the stance phase, observed when wearing shoes.
Another interesting finding is that the biomechanical effects of shoes are similar during walking at FW and CW. This could be of interests for clinicians and researchers as it increases the generalizability of the previous studies’ results that investigated the biomechanical effects of shoes during walking, even if speed varied.
The results of this study should be interpreted in light of a few limitations. The first limita-tion is the populalimita-tion mean age of 26.1 years. As gait biomechanics change when getting older [34], the results of this study may not be generalizable to an older population. The second limi-tation is the unbalanced men/women ratio among participants. Many sex biomechanical dif-ferences have been previously observed in previous studies [35,36]. As only four men were recruited in this study, the results may perhaps not be generalizable for the male population. The third limitation is the kinematic model used. In order to increase the ecological validity of our results, no hole was cut in the shoes upper. Therefore, only the sagittal ankle angle and moment were calculated. It is possible that shoes have significant effect on transverse and fron-tal ankle angles and moments but could not be observed in this study. The kinematic model also did not allow the measurement of the kinematics of the rearfoot, midfoot and forefoot seg-ments. The fourth limitation is the greater mean speed for shod compared to barefoot walking trials at FW. The differences observed in this study represent a 5% increase, which fall into the current gold standard of±5% in the literature. We are therefore confident that our results were not significantly biased by walking speed.
Conclusions
The biomechanical deficits associated with CAI were partly attenuated during the shod com-pared to the barefoot condition and these effects were similar at CW and FW. The main results were that individuals with CAI showed more ankle dorsiflexion angle, knee extension and tibialis anterior muscle activation and delayed peak knee flexion and adduction moments dur-ing shod compared to barefoot walkdur-ing. These finddur-ings are compatible with the concept that locomotor interventions using suitable shoes may enhance gait abilities in individuals with CAI. Thus, this study will inform future efficacy trials aiming to attenuate the deficits associ-ated with CAI during rehabilitation.
Author Contributions
Conceptualization: Gabriel Moisan, Martin Descarreaux, Vincent Cantin. Formal analysis: Gabriel Moisan.
Investigation: Gabriel Moisan.
Methodology: Gabriel Moisan, Martin Descarreaux, Vincent Cantin. Supervision: Martin Descarreaux, Vincent Cantin.
Visualization: Gabriel Moisan, Martin Descarreaux, Vincent Cantin. Writing – original draft: Gabriel Moisan.
Writing – review & editing: Martin Descarreaux, Vincent Cantin.
References
1. Wirth B, Hauser F, Mueller R. Back and neck muscle activity in healthy adults during barefoot walking and walking in conventional and flexible shoes. Footwear Science. 2011; 3(3):159–67.https://doi.org/ 10.1080/19424280.2011.633104
2. Oeffinger D, Brauch B, Cranfill S, Hisle C, Wynn C, Hicks R, et al. Comparison of gait with and without shoes in children. Gait Posture. 1999; 9(2):95–100. Epub 1999/11/27. https://doi.org/10.1016/s0966-6362(99)00005-3PMID:10575074.
3. Zhang X, Paquette MR, Zhang S. A comparison of gait biomechanics of flip-flops, sandals, barefoot and shoes. J Foot Ankle Res. 2013; 6(1):45. Epub 2013/11/08.https://doi.org/10.1186/1757-1146-6-45
PMID:24196492; PubMed Central PMCID: PMC3907140.
4. Keenan GS, Franz JR, Dicharry J, Della Croce U, Kerrigan DC. Lower limb joint kinetics in walking: the role of industry recommended footwear. Gait Posture. 2011; 33(3):350–5. Epub 2011/01/22.https://doi. org/10.1016/j.gaitpost.2010.09.019PMID:21251835.
5. Franklin S, Li FX, Grey MJ. Modifications in lower leg muscle activation when walking barefoot or in min-imalist shoes across different age-groups. Gait Posture. 2018; 60:1–5. Epub 2017/11/10.https://doi. org/10.1016/j.gaitpost.2017.10.027PMID:29121509.
6. Jannink M, van Dijk H, Ijzerman M, Groothuis-Oudshoorn K, Groothoff J, Lankhurst G. Effectiveness of custom-made orthopaedic shoes in the reduction of foot pain and pressure in patients with degenerative disorders of the foot. Foot Ankle Int. 2006; 27(11):974–9. Epub 2006/12/06.https://doi.org/10.1177/ 107110070602701119PMID:17144963.
7. Trombini-Souza F, Matias AB, Yokota M, Butugan MK, Goldenstein-Schainberg C, Fuller R, et al. Long-term use of minimal footwear on pain, self-reported function, analgesic intake, and joint loading in elderly women with knee osteoarthritis: A randomized controlled trial. Clin Biomech. 2015; 30
(10):1194–201. Epub 2015/08/27.https://doi.org/10.1016/j.clinbiomech.2015.08.004PMID:26307181.
8. Hertel J. Functional Anatomy, Pathomechanics, and Pathophysiology of Lateral Ankle Instability. J Athl Train. 2002; 37(4):364–75. Epub 2003/08/26. PMID:12937557; PubMed Central PMCID: PMC164367.
9. Moisan G, Descarreaux M, Cantin V. Effects of chronic ankle instability on kinetics, kinematics and mus-cle activity during walking and running: A systematic review. Gait Posture. 2017; 52:381–99. Epub 2017/01/08.https://doi.org/10.1016/j.gaitpost.2016.11.037PMID:28063387.
10. Franklin S, Grey MJ, Heneghan N, Bowen L, Li FX. Barefoot vs common footwear: A systematic review of the kinematic, kinetic and muscle activity differences during walking. Gait Posture. 2015; 42(3):230– 9. Epub 2015/07/30.https://doi.org/10.1016/j.gaitpost.2015.05.019PMID:26220400.
11. Murley GS, Menz HB, Landorf KB. Electromyographic patterns of tibialis posterior and related muscles when walking at different speeds. Gait Posture. 2014; 39(4):1080–5. Epub 2014/03/13.https://doi.org/ 10.1016/j.gaitpost.2014.01.018PMID:24618372.
12. Browning RC, Kram R. Effects of obesity on the biomechanics of walking at different speeds. Med Sci Sports Exerc. 2007; 39(9):1632–41. Epub 2007/09/07.https://doi.org/10.1249/mss.
0b013e318076b54bPMID:17805097.
13. Dubbeldam R, Buurke JH, Simons C, Groothuis-Oudshoorn CG, Baan H, Nene AV, et al. The effects of walking speed on forefoot, hindfoot and ankle joint motion. Clin Biomech. 2010; 25(8):796–801. Epub 2010/07/14.https://doi.org/10.1016/j.clinbiomech.2010.06.007PMID:20619515.
14. Moisan G, Mainville C, Descarreaux M, Cantin V. Kinematic, kinetic and electromyographic differences between young adults with and without chronic ankle instability during walking. J Electromyogr Kinesiol. 2020; 51:102399. Epub 2020/02/07.https://doi.org/10.1016/j.jelekin.2020.102399PMID:32028104.
15. Gribble PA, Delahunt E, Bleakley CM, Caulfield B, Docherty CL, Fong DT, et al. Selection criteria for patients with chronic ankle instability in controlled research: a position statement of the International Ankle Consortium. J Athl Train. 2014; 49(1):121–7. Epub 2014/01/01. https://doi.org/10.4085/1062-6050-49.1.14PMID:24377963; PubMed Central PMCID: PMC3917288.
16. Hermens H, Freriks B, Disselhorst-Klug C, Rau G. Development of recommendations for SEMG sen-sors and sensor placement procedures. Journal Of Electromyography And Kinesiology. 2000; 10 (5):361–74.https://doi.org/10.1016/s1050-6411(00)00027-4PMID:11018445
17. Borloz S, Crevoisier X, Deriaz O, Ballabeni P, Martin RL, Luthi F. Evidence for validity and reliability of a French version of the FAAM. BMC Musculoskelet Disord. 2011; 12:40. Epub 2011/02/10.https://doi. org/10.1186/1471-2474-12-40PMID:21303520; PubMed Central PMCID: PMC3045395.
18. Criniere L, Lhommet C, Caille A, Giraudeau B, Lecomte P, Couet C, et al. Reproducibility and validity of the French version of the long international physical activity questionnaire in patients with type 2 diabe-tes. J Phys Act Health. 2011; 8(6):858–65. Epub 2011/08/13.https://doi.org/10.1123/jpah.8.6.858
PMID:21832302.
19. Redmond AC, Crosbie J, Ouvrier RA. Development and validation of a novel rating system for scoring standing foot posture: the Foot Posture Index. Clin Biomech. 2006; 21(1):89–98. Epub 2005/09/27.
https://doi.org/10.1016/j.clinbiomech.2005.08.002PMID:16182419.
20. Nichols TE, Holmes AP. Nonparametric permutation tests for functional neuroimaging: A primer with examples. Human Brain Mapping. 2002; 15(1):1–25.https://doi.org/10.1002/hbm.1058PMID:
11747097
21. Pataky TC, Vanrenterghem J, Robinson MA. Zero- vs. one-dimensional, parametric vs. non-parametric, and confidence interval vs. hypothesis testing procedures in one-dimensional biomechanical trajectory analysis. Journal of Biomechanics. 2015; 48(7):1277–85.https://doi.org/10.1016/j.jbiomech.2015.02. 051PMID:25817475
22. Chinn L, Dicharry J, Hertel J. Ankle kinematics of individuals with chronic ankle instability while walking and jogging on a treadmill in shoes. Phys Ther Sport. 2013; 14(4):232–9. Epub 2013/04/30.https://doi. org/10.1016/j.ptsp.2012.10.001PMID:23623243.
23. Son SJ, Kim H, Seeley MK, Hopkins JT. Altered Walking Neuromechanics in Patients With Chronic Ankle Instability. J Athl Train. 2019; 54(6):684–97. Epub 2019/06/05. https://doi.org/10.4085/1062-6050-478-17PMID:31162941; PubMed Central PMCID: PMC6602400.
24. Daud R, Abdul Kadir MR, Izman S, Md Saad AP, Lee MH, Che Ahmad A. Three-Dimensional Morpho-metric Study of the Trapezium Shape of the Trochlea Tali. The Journal of Foot and Ankle Surgery. 2013; 52(4):426–31.https://doi.org/10.1053/j.jfas.2013.03.007PMID:23623302
25. Imai K, Ikoma K, Kido M, Maki M, Fujiwara H, Arai Y, et al. Joint space width of the tibiotalar joint in the healthy foot. J Foot Ankle Res. 2015; 8:26. Epub 2015/07/07. https://doi.org/10.1186/s13047-015-0086-5PMID:26146520; PubMed Central PMCID: PMC4490633.
26. Wei F, Fong DT, Chan KM, Haut RC. Estimation of ligament strains and joint moments in the ankle dur-ing a supination sprain injury. Comput Methods Biomech Biomed Engin. 2015; 18(3):243–8. Epub 2013/05/10.https://doi.org/10.1080/10255842.2013.792809PMID:23654290.
27. Fong DT, Hong Y, Shima Y, Krosshaug T, Yung PS, Chan KM. Biomechanics of supination ankle sprain: a case report of an accidental injury event in the laboratory. Am J Sports Med. 2009; 37(4):822– 7. Epub 2009/02/04.https://doi.org/10.1177/0363546508328102PMID:19188559.
28. Gehring D, Wissler S, Mornieux G, Gollhofer A. How to sprain your ankle—a biomechanical case report of an inversion trauma. J Biomech. 2013; 46(1):175–8. Epub 2012/10/20.https://doi.org/10.1016/j. jbiomech.2012.09.016PMID:23078945.
29. Kristianslund E, Bahr R, Krosshaug T. Kinematics and kinetics of an accidental lateral ankle sprain. J Biomech. 2011; 44(14):2576–8. Epub 2011/08/10.https://doi.org/10.1016/j.jbiomech.2011.07.014
PMID:21824618.
30. Hall JP, Barton C, Jones PR, Morrissey D. The biomechanical differences between barefoot and shod distance running: a systematic review and preliminary meta-analysis. Sports Med. 2013; 43(12):1335– 53. Epub 2013/09/03.https://doi.org/10.1007/s40279-013-0084-3PMID:23996137.
31. Sacco IC, Akashi PM, Hennig EM. A comparison of lower limb EMG and ground reaction forces between barefoot and shod gait in participants with diabetic neuropathic and healthy controls. BMC Musculoskelet Disord. 2010; 11:24. Epub 2010/02/05.https://doi.org/10.1186/1471-2474-11-24PMID:
20128894; PubMed Central PMCID: PMC2828424.
32. Francis CA, Lenz AL, Lenhart RL, Thelen DG. The modulation of forward propulsion, vertical support, and center of pressure by the plantarflexors during human walking. Gait Posture. 2013; 38(4):993–7. Epub 2013/06/22.https://doi.org/10.1016/j.gaitpost.2013.05.009PMID:23787149; PubMed Central PMCID: PMC3795949.
33. Scott LA, Murley GS, Wickham JB. The influence of footwear on the electromyographic activity of selected lower limb muscles during walking. J Electromyogr Kinesiol. 2012; 22(6):1010–6. Epub 2012/ 07/28.https://doi.org/10.1016/j.jelekin.2012.06.008PMID:22835487.
34. Boyer KA, Johnson RT, Banks JJ, Jewell C, Hafer JF. Systematic review and meta-analysis of gait mechanics in young and older adults. Exp Gerontol. 2017; 95:63–70. Epub 2017/05/14.https://doi.org/ 10.1016/j.exger.2017.05.005PMID:28499954.
35. Fukano M, Fukubayashi T, Banks SA. Sex differences in three-dimensional talocrural and subtalar joint kinematics during stance phase in healthy young adults. Hum Mov Sci. 2018; 61:117–25. Epub 2018/ 08/08.https://doi.org/10.1016/j.humov.2018.06.003PMID:30086450.
36. Bruening DA, Frimenko RE, Goodyear CD, Bowden DR, Fullenkamp AM. Sex differences in whole body gait kinematics at preferred speeds. Gait Posture. 2015; 41(2):540–5. Epub 2014/12/31.https:// doi.org/10.1016/j.gaitpost.2014.12.011PMID:25548119.