HAL Id: hal-01579957
https://hal.archives-ouvertes.fr/hal-01579957
Submitted on 31 Aug 2017
HAL is a multi-disciplinary open access archive for the deposit and dissemination of sci-entific research documents, whether they are pub-lished or not. The documents may come from teaching and research institutions in France or abroad, or from public or private research centers.
L’archive ouverte pluridisciplinaire HAL, est destinée au dépôt et à la diffusion de documents scientifiques de niveau recherche, publiés ou non, émanant des établissements d’enseignement et de recherche français ou étrangers, des laboratoires publics ou privés.
co-topicship through network mapping
Eric Boutin, Luc Quoniam, Hervé Rostaing, Henri Dou
To cite this version:
Eric Boutin, Luc Quoniam, Hervé Rostaing, Henri Dou. A new approach to display real co-authorship and co-topicship through network mapping. Fifth International Conference on Scientometrics and Informetrics, ISSI & Rosary College, Jun 1995, Chicago, United States. �hal-01579957�
A NEW APPROACH TO DISPLAY REAL CO-AUTHORSHIP AND CO-TOPICSHIP THROUGH NETWORK MAPPING
E. BOUTIN (*), L. QUONIAM(**), H. ROSTAING(**), H. DOU (**)
(*) IUT de Toulon BP 132, 83957 La Garde Cedex FRANCE
(**)CRRM, Université Aix Marseille III- 13397 Marseille Cedex 20 FRANCE
Technology watch consists of collecting and analyzing two kinds of information: formal and informal information. One of the most interesting point concerning the management of formal information is the choice of the appropriate bibliometric tool. One of the main points concerning the management of informal information is the identification of staff members of the company which are the most involved in the informal collecting process [ALL]
The subject of this paper is to present an algorithm which allows automatic drawing of network. It can be used efficiently in both cases, that is as a bibliometric tool or as a way to identify the « gatekeepers » through the analysis of the inter-member relationship map. If we focused on the network as a bibliometric tool, we can find many uses of this technics. It can be used so much to show the map of collaboration between authors if we consider the field « author » of bibliographic references as a concept network if we consider the field « keyword » of bibliographic references. This approach is original for two reasons a) the measure used to evaluate item association and b) the definition of groups [PET]. For a), most other methods use distances between members as an aggregation criteria. In that case, a link between two members does not even signify that there exists a relationship between these two members. Therefore the map as a final result does not represent the real relationships between members but a degree of similarity. The starting point of our algorithm is symmetrically square matrix representing co-publishing of authors, co-occurrence of keywords or information flow between actors. The technique does not use metrics and saves the integrity of the information contained in the initial relation matrix between groups members.
For b) most methods make the aggregation in groups by studying inter-groups relationships. Those members who are grouped together in the same cluster are not necessarily in relation, but they have a similarity in their relationship with other groups. We consider intra-group relationship as an aggregation criteria. This mean that we are grouping together members with good relationship. The technique used leaps up two successive manipulations. The first one divides up the whole actors into several groups e.g. looking for the strongly connected components of the graph. The second one consists in identifying subgroups, within each strongly connected component, by finding isthmuses [AHO]: These so-called point isthmuses are those points that, if removed, increase the number of the strongly connected components of the graph.
The automatic drawing of network is relevant for many reasons. The visual and synthesis character of the network approach make the information more comprehensive and easier to memorize for the user. Network can make emergent subjects clearer.
[AHO] AHO A. HOPCRAFT J. ULLMAN J. Structure des données et algorithmes, Interéditions, France 1987 [ALL] ALLEN J. Managing the flow of technology, the MIT Press, Cambridge, Massachussets, United States,
1977
[PET] PETERS H.P.J, VAN RAAN A.F.J., Structuring scientific activities by co-author analysis, Scientometrics, 20(1),1991,273-293
I/ INTRODUCTION:
Competitive intelligence and technology watch include methodologies that allow companies or big organizations to survey their scientific, technical, technological and competitive environments to detect the threats and opportunities. This survey consists of collecting and analyzing two kinds of information: formal information (text information essentially) and informal information (expert, fair exhibition information...).
International databases cover formal information in a way nearly exhaustive for scientific papers or patent information. Formal information can be processed with text analysis techniques like Bibliometric analysis [DOU].
Informal information is more difficult to evaluate. This informal information is collected from fears, conferences, client visits, exhibitions... Informal information is not often taken into account in analyses [ALL]. This paper intends to contribute to fill this gap.
Informal information can be compared to feeble signals possessed by some staff members of an organization. It's only after analysis and cross-checking of these various sorts of information that we can obtain meaningful and strategic information. Hence, we have to identify the members who are the most involved in the informal collecting process in order to canalize, collect and analyze this information flow.
This problem usually is resolved in an intuitive or an empirical way calling on experience. The aim of the methodology developed in this paper is to detect staff member relationships through a sample survey investigation. The methodology allows to build up an inter-member relationship map [FRE] from responses of the sample survey investigation. Reading such a map allows to locate easily staff members who take a central and prominent part. Moreno was one of the first researchers who used organization relationship mapping [MOR]. He applied this representation in organization sociology. This approach is based on mathematical techniques belonging to graphic theory.
The first part of this paper explains the methodological approach selected to create automatically the relations network. The second part presents the application of this methodology to an actual case.
II/ METHODOLOGY: A- Positioning of the method:
It is possible to separate the analysis method into two: one can oppose them on the grounds of the definition of what is a group or on the grounds of the mathematical construction of those so called groups.
1) The aggregation techniques of group members and the construction of groups. Two techniques exist which allow the individual aggregation in groups.
One of the possible techniques consists of putting together in the same class members who are not necessarily in relation. In this case, we divide one group into several sub-groups starting with the study of inter-group relations.
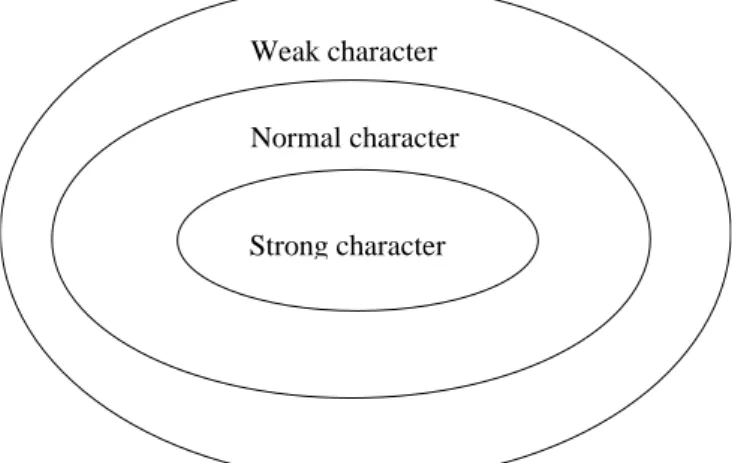
One example has been supplied to us through the work of Dalud Vincent [DAL]. The different constituted groups allow the individuals with regard to the group a hierarchy according to their degree of vulnerability.
All the members in a same class have the same fragility.
Weak character
Normal character
Strong character
Figure 1 Example of group formation
The second technique consists of grouping in the same class those individuals with good relationships. In this case, it is the study of the density of inter-group relations which allows you to build each sub-group. The analysis of the result is such that the classification is more natural, in so far as the group expresses a strong relationship and therefore a closeness between group members.
In our approach, the choice fell upon a second type of algorithm in so far as the results allow easier identification of newcomers to the organization in the sense of the information flow. 2) The work on matrix:
The algorithms of graph theory often have for a starting point arrays, known as matrices, that formulate relations between the different group members of the organization being studied.
These matrixes are the subject of mathematical transformations. Distances between individuals constitute the aggregation criteria of group members.
The technique used here is original in that it does not use metrics and saves the integrity of the information of the initial relations matrix between group members [FAU].
B- Mathematical notions:
Before presenting the algorithms already used and in order to clarify the presentation, some of the concepts will be explained:
1) Graph theory:
- A strongly connected component of a graph is a homogenous group in that all the elements of the group keep in touch only with their own group members.
1 2 3 5 4 6 7 8 9 10
Figure 1: Showing the notion of strongly connected components
Figure 1 shows two strongly connected components: 1,2,3,4,5 et 6,7,8,9,10
- The relay points are those points which join together several sub-groups and mean that these groups constitute one and the same strongly connected component. These points set up isthmuses. An isthmus is therefore a point which, if removed, increases the number of strongly connected components of a graph [AHO].
1 2 3 5 4 6 9 10 10
Figure 2: Showing the notion of an isthmus
In figure 2, by removing points 3 or 6, two strongly connected components will remain. Therefore, 3 and 6 are isthmuses.
2) Matrix calculations:
- Transivity property of product matrix: This property is the basis of this study. It can be illustrated by the popular French expression « The friends of my friends are my friends » Take a simplified example to illustrate this concept and consider the matrix presented in figure 3 and the corresponding graph.
A B C
A 1 1 0
B 1 1 1
C 0 1 1
Figure 3: Example of a matrix
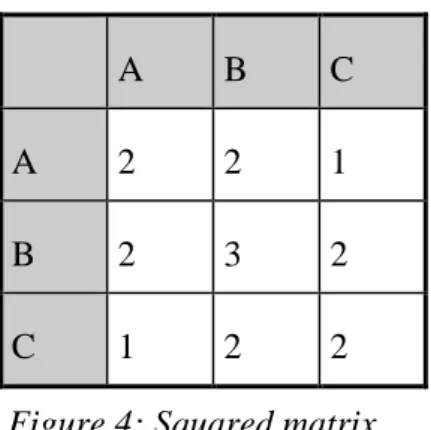
If we square this matrix, we obtain the results shown in figure 4.
A B C
A 2 2 1
B 2 3 2
C 1 2 2
Figure 4: Squared matrix
Interpret for example the value 1 which is found at the intersection between line A and column C. This value corresponds to a relationship between A and C. This relationship is not direct but passes through the intermediate point B. Technically there are 3 ways of linking A to C. These are expressed when one separate the product matrix into 3 components as shown in figure 5. C A B C A 0 A 1 1 0 B 1 C 1 1 = 1 * 0 + 1 * 1 + 0 * 1
component (AA * AC) then component (AB * BC) then component (CC * CA)
Figure 5: Separation of the product matrix
Only AB * BC gives a value other than zero proving that there exists a pathway between A and C.
B
C
A
The product matrix has therefore a strong linking power: A, B, C are found linked together to form the product matrix. This technique will be the basis of the constitution of different groups.
C- Presentation of the algorithm used:
The method used to separate the main group into several groups begins with a squared symmetrical binary matrix. This matrix is the result of an audit of internal communication where one looks to express the informal relations existing between the members of the organization studied.
This matrix is going to be subjected to successive manipulations through two algorithms. Figure 6 is a good example of these two manipulations.
B C A E F D G H J K I
Figure 6: Example of graph.
If one was to split up the main group into sub-groups, the first thing one would think of would be to distinguish between the sub-groups and the strongly connected components. One would obtain two principle groups: A, B, C, D, E, F, G, H and I, J, K. If one considers each strongly connected component, one is able to show many sub-groups inside a principal group. For A, B, C is distinguished from D, E, F, G, H. One calls the points B and D isthmuses. Without B or D we are able to obtain two strongly connected components. Our process represents two stages:
- The first manipulation will therefore have the effect of determining the strongly connected components of the matrix. This initial manipulation uses the linking function of the product matrix. The product matrix will be realized as long as it makes a new indirect path appear allowing it to link to points which could not be linked before.
- For each one of the strongly connected components separated in this way, the second algorithm will determine the isthmuses of the corresponding graph. If one leaves out the initial matrix, the isthmuses become isolated. One will obtain, after the application of a product matrix, a squared symmetrical matrix composed of sub-matrices which will make up as many distinct sub-groups.
III/ AN EXAMPLE OF APPLICATION:
The aim of this second part is to present a technical example of inter-group relation mapping construction for thirty-one members of an organization. This mapping will identify the central individuals involved in the information flow.
The starting point of the analysis is a short sample survey questionnaire administered to the thirty-one members. The outcomes of this questionnaire are presented in a symmetrical matrix (figure 7). The value "1" that is found at the intersection between a line L and a column C means that the individuals L and C communicate information together.
BABEBE BEBECACHCHCHESESGEGEHUINGLE LE LE LE LOMAMAMIGOTPAPEPORERESETR BASA 1 0 0 0 0 0 0 1 0 1 0 0 0 0 0 0 0 0 0 0 0 0 0 0 0 0 1 0 0 0 0 BECQ 0 1 0 0 0 0 0 0 0 0 0 0 0 0 0 0 0 0 0 0 0 0 0 1 1 0 0 0 0 0 0 BEN S 0 0 1 1 1 0 0 0 0 0 1 0 0 0 0 1 0 0 0 0 1 0 1 0 0 0 0 0 0 0 0 BENJE 0 0 1 1 1 1 0 0 0 0 0 0 0 0 0 0 0 0 1 0 0 0 1 0 0 0 0 0 0 0 0 BERNA0 0 1 1 1 0 0 0 0 0 1 0 0 0 0 1 0 0 0 0 1 0 1 0 0 0 0 0 0 0 0 CARD 0 0 0 1 0 1 0 0 0 0 0 0 0 0 0 0 0 1 1 0 0 0 0 0 0 0 0 0 0 0 0 CHAR 0 0 0 0 0 0 1 0 0 0 0 0 0 1 1 0 0 0 0 1 0 0 0 1 0 1 0 0 0 1 0 CHOU 1 0 0 0 0 0 0 1 0 1 0 0 1 0 0 0 0 0 0 0 0 0 0 0 0 0 0 0 0 0 0 CHRIS 0 0 0 0 0 0 0 0 1 0 0 0 0 0 0 0 0 0 0 0 0 0 0 0 0 0 0 0 0 0 0 ESCLU 1 0 0 0 0 0 0 1 0 1 0 0 1 0 0 0 0 0 0 0 0 0 0 0 0 0 0 0 0 0 0 ESMIE 0 0 1 0 1 0 0 0 0 0 1 0 0 0 0 1 0 0 0 0 0 0 1 0 0 0 1 0 0 0 0 GENY 0 0 0 0 0 0 0 0 0 0 0 1 0 0 0 0 0 0 0 0 0 0 0 0 0 0 0 0 0 0 0 GERY 0 0 0 0 0 0 0 1 0 1 0 0 1 0 0 0 0 0 0 0 0 0 0 0 0 0 0 0 0 0 0 HUGO 0 0 0 0 0 0 1 0 0 0 0 0 0 1 1 0 0 0 0 1 0 0 0 1 0 1 0 0 0 1 0 INGHI 0 0 0 0 0 0 1 0 0 0 0 0 0 1 1 0 0 0 0 1 0 0 0 1 0 1 0 0 0 1 0 LE CU 0 0 1 0 1 0 0 0 0 0 1 0 0 0 0 1 0 1 0 0 0 0 1 0 0 0 1 0 0 0 0 LE LAY 0 0 0 0 0 0 0 0 0 0 0 0 0 0 0 0 1 0 0 0 0 0 0 0 0 0 0 1 0 0 0 LE RA 0 0 0 0 0 1 0 0 0 0 0 0 0 0 0 1 0 1 0 0 0 0 0 0 0 0 0 0 0 0 0 LEFEV 0 0 0 1 0 1 0 0 0 0 0 0 0 0 0 0 0 0 1 0 0 1 0 0 0 0 0 0 0 0 1 LOVY 0 0 0 0 0 0 1 0 0 0 0 0 0 1 1 0 0 0 0 1 0 0 0 1 0 1 0 0 0 1 0 MALLO 0 0 1 0 1 0 0 0 0 0 0 0 0 0 0 0 0 0 0 0 1 0 1 0 0 0 0 0 0 0 0 MANA 0 0 0 0 0 0 0 0 0 0 0 0 0 0 0 0 0 0 1 0 0 1 0 0 0 0 0 1 0 0 1 MIGLIO0 0 1 1 1 0 0 0 0 0 1 0 0 0 0 1 0 0 0 0 1 0 1 0 0 0 0 0 0 0 0 OTT 0 1 0 0 0 0 1 0 0 0 0 0 0 1 1 0 0 0 0 1 0 0 0 1 0 0 0 0 0 1 0 PAGE 0 1 0 0 0 0 0 0 0 0 0 0 0 0 0 0 0 0 0 0 0 0 0 0 1 0 0 0 0 0 0 PELLA 0 0 0 0 0 0 1 0 0 0 0 0 0 1 1 0 0 0 0 1 0 0 0 0 0 1 0 0 0 1 0 POMM 1 0 0 0 0 0 0 0 0 0 1 0 0 0 0 1 0 0 0 0 0 0 0 0 0 0 1 1 0 0 1 REBU 0 0 0 0 0 0 0 0 0 0 0 0 0 0 0 0 1 0 0 0 0 1 0 0 0 0 1 1 0 0 1 RETIE 0 0 0 0 0 0 0 0 0 0 0 0 0 0 0 0 0 0 0 0 0 0 0 0 0 0 0 0 1 0 0 SEBAN 0 0 0 0 0 0 1 0 0 0 0 0 0 1 1 0 0 0 0 1 0 0 0 1 0 1 0 0 0 1 0 TREM 0 0 0 0 0 0 0 0 0 0 0 0 0 0 0 0 0 0 1 0 0 1 0 0 0 0 1 1 0 0 1
Figure 7: Beginning matrix expressing the communication relation through thirty one members of an organization
If we square this matrix, we make the total number of pathway of length 2 appear existing between each studied individual couple (figure 9). In the present matrix figure 7, no relations of direct communication exist between BASA and LECUNFF. On the other hand, we can
identify in the matrix figure 9 an indirect relation created between these two individuals through POMMET. BASA is directly linked to POMMET and POMMET is directly linked to LECUNFF, hence an indirect relation exists between BAS and LECUNFF as figure 8 shows it.
BASA POMMET LECUNFF
Direct relation Direct relation
Indirect relation
Figure 8: Putting forward indirect relations
BA BE BE BE BE CACHCHCHES ES GEGEHUINGLE LE LE LE LO MAMAMIGOTPA PE PORERESE TR BASA 4 0 0 0 0 0 0 3 0 3 1 0 2 0 0 1 0 0 0 0 0 0 0 0 0 0 2 1 0 0 1 BECQ 0 3 0 0 0 0 1 0 0 0 0 0 0 1 1 0 0 0 0 1 0 0 0 2 2 0 0 0 0 1 0 BEN S 0 0 7 4 7 1 0 0 0 0 5 0 0 0 0 5 0 1 1 0 4 0 7 0 0 0 2 0 0 0 0 BENJ 0 0 4 6 4 3 0 0 0 0 3 0 0 0 0 3 0 1 3 0 3 1 4 0 0 0 0 0 0 0 1 BERN 0 0 7 4 7 1 0 0 0 0 5 0 0 0 0 5 0 1 1 0 4 0 7 0 0 0 2 0 0 0 0 CARD 0 0 1 3 1 4 0 0 0 0 0 0 0 0 0 1 0 2 3 0 0 1 1 0 0 0 0 0 0 0 1 CHAR 0 1 0 0 0 0 7 0 0 0 0 0 0 7 7 0 0 0 0 7 0 0 0 6 0 6 0 0 0 7 0 CHOU 3 0 0 0 0 0 0 4 0 4 0 0 3 0 0 0 0 0 0 0 0 0 0 0 0 0 1 0 0 0 0 CHRI 0 0 0 0 0 0 0 0 1 0 0 0 0 0 0 0 0 0 0 0 0 0 0 0 0 0 0 0 0 0 0 ESCL 3 0 0 0 0 0 0 4 0 4 0 0 3 0 0 0 0 0 0 0 0 0 0 0 0 0 1 0 0 0 0 ESMI 1 0 5 3 5 0 0 0 0 0 6 0 0 0 0 6 0 1 0 0 3 0 5 0 0 0 3 1 0 0 1 GENY 0 0 0 0 0 0 0 0 0 0 0 1 0 0 0 0 0 0 0 0 0 0 0 0 0 0 0 0 0 0 0 GERY 2 0 0 0 0 0 0 3 0 3 0 0 3 0 0 0 0 0 0 0 0 0 0 0 0 0 0 0 0 0 0 HUGO 0 1 0 0 0 0 7 0 0 0 0 0 0 7 7 0 0 0 0 7 0 0 0 6 0 6 0 0 0 7 0 INGH 0 1 0 0 0 0 7 0 0 0 0 0 0 7 7 0 0 0 0 7 0 0 0 6 0 6 0 0 0 7 0 LE CU 1 0 5 3 5 1 0 0 0 0 6 0 0 0 0 7 0 2 0 0 3 0 5 0 0 0 3 1 0 0 1 LE LA 0 0 0 0 0 0 0 0 0 0 0 0 0 0 0 0 2 0 0 0 0 1 0 0 0 0 1 2 0 0 1 LE RA 0 0 1 1 1 2 0 0 0 0 1 0 0 0 0 2 0 3 1 0 0 0 1 0 0 0 1 0 0 0 0 LEFE 0 0 1 3 1 3 0 0 0 0 0 0 0 0 0 0 0 1 5 0 0 3 1 0 0 0 1 2 0 0 3 LOVY 0 1 0 0 0 0 7 0 0 0 0 0 0 7 7 0 0 0 0 7 0 0 0 6 0 6 0 0 0 7 0 MALL 0 0 4 3 4 0 0 0 0 0 3 0 0 0 0 3 0 0 0 0 4 0 4 0 0 0 0 0 0 0 0 MANA 0 0 0 1 0 1 0 0 0 0 0 0 0 0 0 0 1 0 3 0 0 4 0 0 0 0 2 3 0 0 4 MIGL 0 0 7 4 7 1 0 0 0 0 5 0 0 0 0 5 0 1 1 0 4 0 7 0 0 0 2 0 0 0 0 OTT 0 2 0 0 0 0 6 0 0 0 0 0 0 6 6 0 0 0 0 6 0 0 0 7 1 5 0 0 0 6 0 PAGE 0 2 0 0 0 0 0 0 0 0 0 0 0 0 0 0 0 0 0 0 0 0 0 1 2 0 0 0 0 0 0 PELLA 0 0 0 0 0 0 6 0 0 0 0 0 0 6 6 0 0 0 0 6 0 0 0 5 0 6 0 0 0 6 0 POMM 2 0 2 0 2 0 0 1 0 1 3 0 0 0 0 3 1 1 1 0 0 2 2 0 0 0 6 3 0 0 3 REBU 1 0 0 0 0 0 0 0 0 0 1 0 0 0 0 1 2 0 2 0 0 3 0 0 0 0 3 5 0 0 4 RETIE 0 0 0 0 0 0 0 0 0 0 0 0 0 0 0 0 0 0 0 0 0 0 0 0 0 0 0 0 1 0 0 SEBA 0 1 0 0 0 0 7 0 0 0 0 0 0 7 7 0 0 0 0 7 0 0 0 6 0 6 0 0 0 7 0 TREM 1 0 0 1 0 1 0 0 0 0 1 0 0 0 0 1 1 0 3 0 0 4 0 0 0 0 3 4 0 0 5
Figure 9: Squared matrix expressing indirect relations between studied individuals
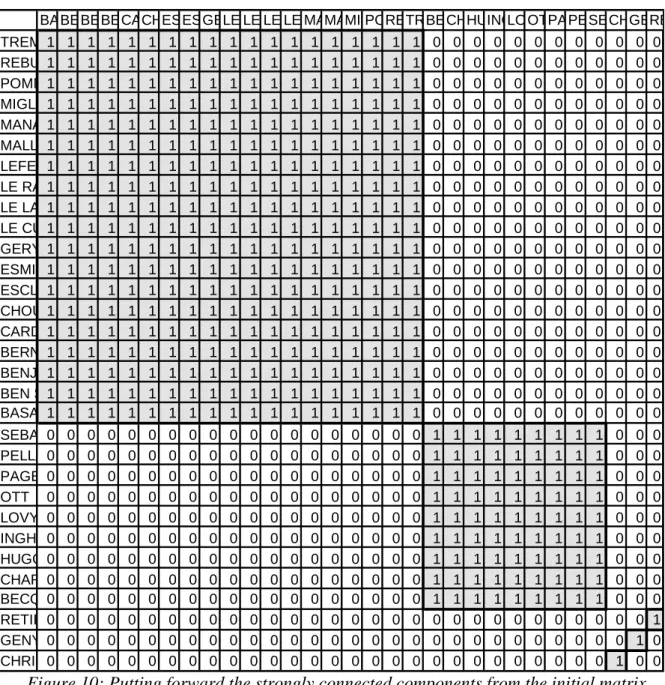
The algorithm consists of reiterating the product matrix until it is not possible to create indirect links between any two individuals of the studied organization. One obtains finally a matrix expressing the total number of links existing between individual pairs. If one only
keeps from this matrix the presence or absence of relations between two individuals and puts in order the members, one obtains matrix figure 10.
BABE BEBECACHESESGELE LE LE LE MAMAMI PORETRBECHHUINGLOOTPAPESECHGERE TREM 1 1 1 1 1 1 1 1 1 1 1 1 1 1 1 1 1 1 1 0 0 0 0 0 0 0 0 0 0 0 0 REBU 1 1 1 1 1 1 1 1 1 1 1 1 1 1 1 1 1 1 1 0 0 0 0 0 0 0 0 0 0 0 0 POMM 1 1 1 1 1 1 1 1 1 1 1 1 1 1 1 1 1 1 1 0 0 0 0 0 0 0 0 0 0 0 0 MIGL 1 1 1 1 1 1 1 1 1 1 1 1 1 1 1 1 1 1 1 0 0 0 0 0 0 0 0 0 0 0 0 MANA 1 1 1 1 1 1 1 1 1 1 1 1 1 1 1 1 1 1 1 0 0 0 0 0 0 0 0 0 0 0 0 MALL 1 1 1 1 1 1 1 1 1 1 1 1 1 1 1 1 1 1 1 0 0 0 0 0 0 0 0 0 0 0 0 LEFEV1 1 1 1 1 1 1 1 1 1 1 1 1 1 1 1 1 1 1 0 0 0 0 0 0 0 0 0 0 0 0 LE RA 1 1 1 1 1 1 1 1 1 1 1 1 1 1 1 1 1 1 1 0 0 0 0 0 0 0 0 0 0 0 0 LE LA 1 1 1 1 1 1 1 1 1 1 1 1 1 1 1 1 1 1 1 0 0 0 0 0 0 0 0 0 0 0 0 LE CU 1 1 1 1 1 1 1 1 1 1 1 1 1 1 1 1 1 1 1 0 0 0 0 0 0 0 0 0 0 0 0 GERY 1 1 1 1 1 1 1 1 1 1 1 1 1 1 1 1 1 1 1 0 0 0 0 0 0 0 0 0 0 0 0 ESMI 1 1 1 1 1 1 1 1 1 1 1 1 1 1 1 1 1 1 1 0 0 0 0 0 0 0 0 0 0 0 0 ESCL 1 1 1 1 1 1 1 1 1 1 1 1 1 1 1 1 1 1 1 0 0 0 0 0 0 0 0 0 0 0 0 CHOU 1 1 1 1 1 1 1 1 1 1 1 1 1 1 1 1 1 1 1 0 0 0 0 0 0 0 0 0 0 0 0 CARD 1 1 1 1 1 1 1 1 1 1 1 1 1 1 1 1 1 1 1 0 0 0 0 0 0 0 0 0 0 0 0 BERN 1 1 1 1 1 1 1 1 1 1 1 1 1 1 1 1 1 1 1 0 0 0 0 0 0 0 0 0 0 0 0 BENJ 1 1 1 1 1 1 1 1 1 1 1 1 1 1 1 1 1 1 1 0 0 0 0 0 0 0 0 0 0 0 0 BEN S 1 1 1 1 1 1 1 1 1 1 1 1 1 1 1 1 1 1 1 0 0 0 0 0 0 0 0 0 0 0 0 BASA 1 1 1 1 1 1 1 1 1 1 1 1 1 1 1 1 1 1 1 0 0 0 0 0 0 0 0 0 0 0 0 SEBA 0 0 0 0 0 0 0 0 0 0 0 0 0 0 0 0 0 0 0 1 1 1 1 1 1 1 1 1 0 0 0 PELLA 0 0 0 0 0 0 0 0 0 0 0 0 0 0 0 0 0 0 0 1 1 1 1 1 1 1 1 1 0 0 0 PAGE 0 0 0 0 0 0 0 0 0 0 0 0 0 0 0 0 0 0 0 1 1 1 1 1 1 1 1 1 0 0 0 OTT 0 0 0 0 0 0 0 0 0 0 0 0 0 0 0 0 0 0 0 1 1 1 1 1 1 1 1 1 0 0 0 LOVY 0 0 0 0 0 0 0 0 0 0 0 0 0 0 0 0 0 0 0 1 1 1 1 1 1 1 1 1 0 0 0 INGH 0 0 0 0 0 0 0 0 0 0 0 0 0 0 0 0 0 0 0 1 1 1 1 1 1 1 1 1 0 0 0 HUGO 0 0 0 0 0 0 0 0 0 0 0 0 0 0 0 0 0 0 0 1 1 1 1 1 1 1 1 1 0 0 0 CHAR 0 0 0 0 0 0 0 0 0 0 0 0 0 0 0 0 0 0 0 1 1 1 1 1 1 1 1 1 0 0 0 BECQ 0 0 0 0 0 0 0 0 0 0 0 0 0 0 0 0 0 0 0 1 1 1 1 1 1 1 1 1 0 0 0 RETIE 0 0 0 0 0 0 0 0 0 0 0 0 0 0 0 0 0 0 0 0 0 0 0 0 0 0 0 0 0 0 1 GENY 0 0 0 0 0 0 0 0 0 0 0 0 0 0 0 0 0 0 0 0 0 0 0 0 0 0 0 0 0 1 0 CHRIS 0 0 0 0 0 0 0 0 0 0 0 0 0 0 0 0 0 0 0 0 0 0 0 0 0 0 0 0 1 0 0
Figure 10: Putting forward the strongly connected components from the initial matrix
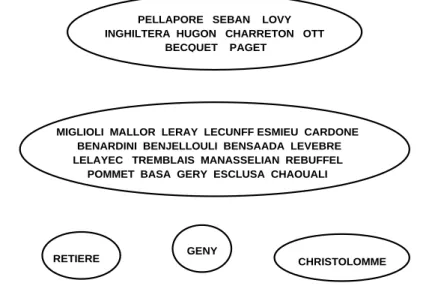
Each of the five sub-matrices constituting figure 10 corresponds to a strongly connected component of the graph. Figure 11 retranscribes in a schematic way the separation of relations among the thirty-one members of this organization.
PELLAPORE SEBAN LOVY INGHILTERA HUGON CHARRETON OTT
BECQUET PAGET
MIGLIOLI MALLOR LERAY LECUNFF ESMIEU CARDONE BENARDINI BENJELLOULI BENSAADA LEVEBRE LELAYEC TREMBLAIS MANASSELIAN REBUFFEL
POMMET BASA GERY ESCLUSA CHAOUALI
RETIERE GENY CHRISTOLOMME
Figure 11: Schematic representation of relations between the thirty one members of this organization
Figure 11 expresses the fact that the five groups are completely unconnected. An individual X belonging to a group will only be able to keep in touch with individuals from the same group. Futhermore, it is possible to study the relations inside each of the five groups. The aim is to detect the central individual who plays a prominent role in the group cohesion. This is the goal of the isthmus determination algorithm. Applied to each group, it leads to the final graphic representation shown in figure 12.
PELLAPORE SEBAN HUGON LOVY CHARRETON INGHILTERA
OTT BECQUET PAGET
MIGLIOLI MALLOR LERAY LECUNFF CARDONE BENARDINI BENJELLOULI
POMMET BASA GERY ESCLUSA CHAOUALI RETIERE GENY CHRISTOLOMME TREMBLAIS MANASSELIAN LELAYEC REBUFFEL LEVEBRE
Figure 12: Communication network representation between thirty one members of an organization
Figure 12 emphasizes the central position of some members who, if removed, leads to an increase in the number of groups. One can notice particularly the central position of POMMET in so far as he allows to connect two sub-groups that will be disconnected without his presence.
IV/ CONCLUSION:
This methodology applied to an internal communication sample survey can be used to analyze bibliographic data. If we study the author field of a set of bibliographic references, the initial matrix represents the co-publishing of authors. This methodology would easily put forward the author groups and the isthmuses. The author isthmuses would be the privileged mediators of collaborations between scientific researcher groups. This last point characterizes this methodology and distinguishes it from the previous studies realized in this field [PRI, PET, HAO]. The fact that this methodology can be processed in an automatic way also gives it an attractive advantage.
References:
[AHO] AHO A. HOPCRAFT J. ULLMAN J., Structure des données et algorithmes, Intereditions, France, 1987
[ALL] ALLEN J., Managing the flow of technology, The MIT Press, Cambridge, Massachussets, United States, 1977
[DAL] DALUD-VINCENT M., FORSE M., AURAY J.P., An algorithm for finding the
structure of social groups, Social Networks, 16 (2), 137-162, 1994
[DOU] DOU H., DESVALS H., La Veille Technologique: l’information scientifique et
technique et industrielle, Dunod, France, 1992
[FAU] FAUST K., ROMNEY A.K., Does structure find structure? A critique of BURT’s
use of distance as a mesure of structural equivalence, Social Networks, 7, 77-103,
1985
[FRE] FREEMAN L., La résurrection des cliques: application du treilli de Galois, Bulletin de Méthodologie Sociologique, 37, 3-24, 1992
[HAO] HAON H., PAOLI C., ROSTAING H., Perception d’un programme de R&D à
travers l’analyse bibliométrique des banques de données d’origine japonaises,
IDT 93 proceedings, 63-70, Paris, France, 22-24 June 1993 [MOR] MORENO J.L., Fondement de la sociométrie, PUF, France, 1954
[PET] PETERS H.P.J., VAN RAAN A.F.J., Structuring scientific activities by co-author
analysis, Scientometrics, 20 (1), 1991, 273-293
[PRI] DE SOLLA PRICE D.J., BEAVER D., Collaboration in an invisible college, American psychologist, 21, 1011-1018, 1966