HAL Id: hal-00451354
https://hal.archives-ouvertes.fr/hal-00451354
Submitted on 28 Jan 2010HAL is a multi-disciplinary open access archive for the deposit and dissemination of sci-entific research documents, whether they are pub-lished or not. The documents may come from teaching and research institutions in France or abroad, or from public or private research centers.
L’archive ouverte pluridisciplinaire HAL, est destinée au dépôt et à la diffusion de documents scientifiques de niveau recherche, publiés ou non, émanant des établissements d’enseignement et de recherche français ou étrangers, des laboratoires publics ou privés.
ANALYSIS AND OPTIMISATION OF 3D
RECONSTRUCTION METHOD OF THE AORTA
FROM A TOMOGRAPHIC IMAGES SEQUENCE
William Puech, Guy Passail, Vincent Ricordel
To cite this version:
William Puech, Guy Passail, Vincent Ricordel. ANALYSIS AND OPTIMISATION OF 3D RE-CONSTRUCTION METHOD OF THE AORTA FROM A TOMOGRAPHIC IMAGES SEQUENCE. European Signal Processing Conference (EUSIPCO), Sep 2000, Tampere, Finland. �hal-00451354�
ANALYSIS AND OPTIMISATION OF 3D RECONSTRUCTION
METHOD OF THE AORTA FROM A TOMOGRAPHIC
IMAGES SEQUENCE
William PUECH1,3, Guy PASSAIL2, et Vincent RICORDEL1,3
1 Laboratoire Modélisation et Signal, ISITV, Université de Toulon et du Var
Avenue G. Pompidou BP 56, 83162 La Valette du Var Cedex, FRANCE
2
Centre Hospitalier Intercommunal de Fréjus - St Raphaël Service de Radiodiagnostic, BP 110, 83608 Fréjus Cedex, FRANCE
3 IUT de St Raphaël, Université de Toulon et du Var, 200, avenue Victor Sergent, 83700 St Raphaël, FRANCE
[email protected], [email protected], [email protected]
ABSTRACT
The aim concerns 3D reconstruction of the aorta from sequence of X rays scanner cuts. We analyse methods used in the medical imaging services, essentially based on threshold techniques and images subtraction. We propose improving techniques of these methods by using semi-automatic extraction of only one anatomic structure. Our method leads to use a model of active contours.
1. INTRODUCTION
The obtained images from 3D reconstruction constitute an important diagnostic help for the study of aorta and its main collateral and terminal branches. Original images are a sequence of cuts obtained by X rays computed tomography (CT). A detected contour in one of these cuts is just deformed in the following cuts. The number of cuts is sufficient to have only minor deformation of the contour between two consecutive cuts.
We analyse the existing methods in medical imaging services. They consist essentially in grey level threshold techniques. The contours issue of the cuts are used for anatomic structure 3D reconstruction by interpolation. Comparisons of manual and automatic methods for 3D segmentation have already been realised [Fiebich 97].
The proposed optimisation method uses active contours models [Kass 88]. This technique requires an initialisation of the segmentation by points selection. We show how to propagate the first contour by deformation in the neighbouring cuts. The last step of the method consists in 3D reconstruction [Gao 97].
The second section deals with the method now used in medical imaging services. In the third section we present a semi-automatic method of aorta detection and an improvement of this method.
2. USED METHOD IN
RADIODIAGNOSTIC SERVICES AT
PRESENT
The aorta 3D visualisation is realised with a sequence of CT scanners cuts. These cuts include aorta but also other anatomic structures like spinal column which increase the difficulty of analysis.
2.1 Analysis method
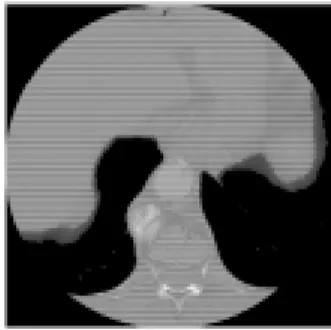
The 3D visualisation is shown figure 1.a. The figure 1.b is one of the 2D cuts necessary for this reconstruction. To obtain an aorta view, the method consists in subtracting the spinal column to the original acquisition by grey levels threshold.
FIG.1 : 1.a) 3D general view of aorta and spinal column, 1.b) one original 2D cut enclosing both aorta and spinal column.
The method consists of five parts : grey levels threshold of the original image, selection of the spinal column, subtraction of the spinal column to the original image, suppression of the undesirable information and visualisation.
2.2. Threshold of the initial image
The CT images are digitised in 4000 grey levels in the range of –1000 to 3000 Hounsfield units. They contain also one heading giving some patient and investigation information. The normalised format in medical imaging is the DICOM one (Digital Imaging and Communications in Medicine) [Nema 93]. In our investigation, the best threshold is performed in the range of 160 to 1374. This step generates an important loss of informations. This threshold improves images contrasts and allows treatment achievement.
2.3. Selection and subtraction of the spinal
column
FIG. 2 : 2.a) 3D view of the spinal column after selection, 2.b) 2D cut of the selected spinal column.
After selection of the spinal column, we keep only the connected parts. This object will be subtracted to the initial data without concerning the neighbouring structures. Nevertheless some contact points subsist between spinal column and aorta. To separate correctly the spinal column as shown on figure 2.a and 2D cut figure 2.b, it should be increased the threshold level.
2.4. Suppression of undesirable informations
After the subtraction of the spinal column (figure 2.b) to the initial data (figure 1.b), some undesirable information may remain due to previous operations. To remove these information, a dilation followed by an erosion with a given coefficient are realised on the spinal column.
2.5. Visualisation for the final investigation
The figure 3.b is the 2D projection of the aorta obtained after the previous described operations. The figure 3.a represents the selected aorta by simple threshold on the original data.
FIG. 3 : 3.a) Aorta 3D view after direct selection, 3.b) Final view of the aorta.
The comparison between the figures 3.a and 3.b enables us to quantitatively evaluate the informations gain obtained by all these operations, repetitive and time consuming.
3. AORTA DETECTION BY
SEMI-AUTOMATIC METHOD
Semi automatic methods provide quickly data [Fiebich 97, Jayaraman 97]. Then a result is obtained with the used methods in imaging medical services, the quality of the result is not usually valuable. Our research consists in selecting a zone of the sequence first image and tracking it on all the images. We have two possibilities to do that : the 2D method of selection ( unidirectional propagation) and the 3D method of selection ( propagation on an object). In both cases it is possible to realise in real time a contour research of the selection. This manipulation consists of the following three parts : threshold, selection of the zone which should be tracked and tracking of the contours.
3.1 Area selection with or without contour
detection
After threshold, the selection of the interested zone is manually realised with or without research in real time of the nearest contour. If the research of the nearest contour is not used, the user should select points which are immediately bound with small segments. The approximation of the selected zone is not sufficiently accurate. The active research of contours could lead to an overflowing of the researched selection zone.
3.a 3.b
3.2. Result of the analysis of this method
The 2D method of selection is the less performing of the two methods. The hachured area, figure 4, shows an overflowing of the selected zone. The transition aorta-background presents a too light contrast to use this method.
FIG. 4 : Problem of selection with real time research of the nearest contour.
If the initial threshold is correctly realised and if the aorta does not present an important variation of grey levels, the 3D method of selection enables a complete tracking of the aorta on a sequence.
FIG. 5 : Information loss, 3D method with vessels selection.
The tracking zone on the next image is approximately situated in the same area as in the initial image and contains the same grey levels with a determinate threshold. This threshold determines the tracking accuracy. In figures 5 and 6, the hachured zones show the aorta detection. With a threshold variation, we obtain either a partial selection of the aorta (figure 5), or an overflowing (figure 6).
FIG. 6 : Information loss on the vessels and overflowing on the spinal column.
3.3 Improvement by active contours of the
semi-automatic method
Methods of pre-treatment, histogram modification, noise reduction and contrast enhancement are justified since TDM images sequences present noise and low contrast in our interest areas. The improvement of the method presented in 3.1 section is based on an active contours segmentation [Smyth 96, Barbaresco 97]. The interest of active contours is that the user initialises the contour manually.
An active contour is a C curve evolving after each iteration.
The model is based on the following equation : E = αEimage + Ecurv , (1) where E represents total energy, Eimage the energetic term representing image information, and Ecurv the energetic
term which explains an a priori knowledge expressing a smoothing constraint realised on the C curve.
The researched image features are included in the expression of image energy Eimage. In the precise case where we want to find the high contrast areas, it is possible to choose an image energy given by this relation :
Eimage(i,j) = (gh(i,j) 2 + gv(i,j) 2 ) , (2) where
( )
,
(
,
)
(
,
)
,
1 1 1 1l
j
k
i
D
j
i
SobelH
j
i
g
k l t h=
∑∑
×
+
+
+ − = + − = (3) and∑∑
+ − = + − =+
+
×
=
1 1 1 1,
)
,
(
)
,
(
)
,
(
k l t vi
j
SobelV
i
j
D
i
k
j
l
g
(4)SobelH and SobelV are the derivative masks.
The Ecurv term expresses the smoothing constraint realised on the C curve. Then, we try to decrease the acute angle. This energy expression follows the following equation:
( ) ( ) ( )
(
)
[
−
1
,
,
+
1
]
2,
=
angle
s
s
s
E
curvν
ν
ν
(5)where s is the co-ordinate of the pixel ν(s) belonging to C.
3.4. Contours tracking in the images sequence
The contour of the sequence previous image is used to initialise the active contour in the current image. Previous works about small contour variations between two images of a same sequence have been already developed for precise applications [Latombe 97].
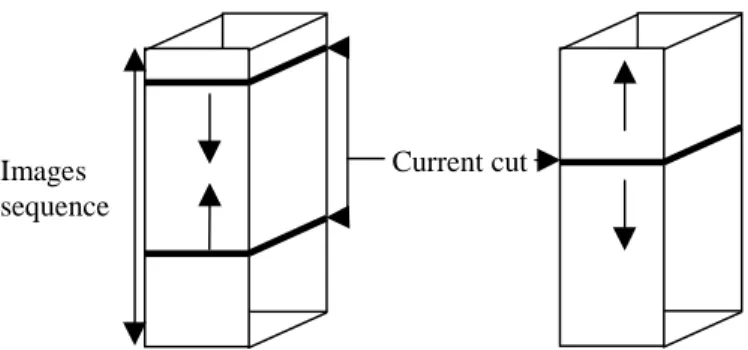
Concerning the order of contour propagation, we propose three methods. As shown on figure 7, it is possible to initialise two contours at both first and last images of the sequence. In this case, the contour propagation is led towards the central image. Then, it is possible to compare on this cut the achieved results by the two different ways of initialisation.
Another solution is based on the initialisation of the contour on the central image, and the propagation is then realised in both directions as shown on figure 7. An additional problem consists of the first contour evolution which should be expanded or contracted.
FIG. 7 : Different ways of the contour propagation in the images sequence.
By using a sequential run, it is possible to take three initial cuts evenly distributed on the TDM images sequence. With a sequence of n images, we propose to take three cuts, (n/4, n/2 et 3n/4). From each of these cuts, an active contour research is run in both directions of propagation. This new method allows us to reduce the calculus time.
4. CONCLUSION
The method analysis currently used in medical imaging services shows that problems subsist concerning the contours detection. The first method described is totally manual, therefore repetitive and time consuming. The second one realises a semi-automatic research and gives poor results. We show that the use of active contours improves quality of the second method and allows an important gain of time.
We have proposed three methods concerning the order of contour propagation.
We show the possibility to use several contour initialisations. It should be interesting to evaluate the calculus times of the different ways of contours propagation in a sequence.
ACKNOWLEDGEMENT
We thank the Conseil Général du Var for the interest they give to our work.
REFERENCES
[Barbaresco 97] F. Barbaresco, S. Bonney, J. Lambert et B. Monnier, (sep. 1997) Contours actifs géodésiques et à modèles contraints pour le suivi des orages dans un contexte multisenseur : radar, interférométre VHF, satellite IR. Seizième colloque Gretsi, Grenoble, France, 717-720.
[Fiebich 97] M. Fiebich, M.T, Mitchell et K.R. Hoffmann, (1997), Comparison of automatic and manual 3D segmentation in CT angiography of the abdominal aorta, 1997 Scientific Program Radiological Society of North America, Chicago, Illinois, 474. [Gao 97] L. Gao, D.G. Heath et E.K. Fishman, (1997), Medical image segmentation using deformable surface model, 1997 Scientific Program Radiological Society of North America, Chicago, Illinois, 474-475.
[Jayaraman 97] M. Jayaraman, B. Kimia, H. Tek, G.A. Tung et J.M. Rogg, (1997), Semiautomated image segmentation of primary brain tumors based on deformable bubbles, 1997 Scientific Program Radiological Society of North America, Chicago, Illinois, 168.
[Kass 88] M. Kass, A. Witkin et D. Terzopoulos, (1988), Snakes : Active contour models, International journal of Computer Vision.
[Latombe 97] B. Latombe, P. Planet-Ladret, F. Granada et P. Villemain, (sep. 1997), Algorithme de contour actif appliqué à la poursuite d'avalanche. Seizième colloque Gretsi, Grenoble, France, 1009-1012.
[Nema 93] NEMA Standards Publication Digital Imaging and Communications in medecine (DICOM), (1993).
[Smyth 96] P.P. Smyth, C.J Taylor et J.E. Adams, (1996), Automatic Measurement of Vertebral Shape using Active Shape Models. In Proc. 3rd. IEEE Worshop on Applications of Computer Vision, Sarasota, Floride, USA, 176-180.
Current cut Images