HAL Id: tel-01201802
https://tel.archives-ouvertes.fr/tel-01201802
Submitted on 18 Sep 2015HAL is a multi-disciplinary open access archive for the deposit and dissemination of sci-entific research documents, whether they are pub-lished or not. The documents may come from teaching and research institutions in France or abroad, or from public or private research centers.
L’archive ouverte pluridisciplinaire HAL, est destinée au dépôt et à la diffusion de documents scientifiques de niveau recherche, publiés ou non, émanant des établissements d’enseignement et de recherche français ou étrangers, des laboratoires publics ou privés.
Vulnerability, interdependencies and risk analysis of
coupled infrastructures : power distribution network and
ICT
José Libardo Sanchez Torres
To cite this version:
José Libardo Sanchez Torres. Vulnerability, interdependencies and risk analysis of coupled infrastruc-tures : power distribution network and ICT. Electric power. Université de Grenoble, 2013. English. �NNT : 2013GRENT104�. �tel-01201802�
Université Joseph Fourier / Université Pierre Mendès France /
THÈSE
Pour obtenir le grade de
DOCTEUR DE L’UNIVERSITÉ DE GRENOBLE
Spécialité : Génie ElectriqueArrêté ministériel : 7 août 2006
Présentée par
José Libardo / SANCHEZ TORRES
Thèse dirigée par Nouredine/HADJSAID et Co-encadré par Raphaël/CAIRE
préparée au sein du Laboratoire G2ELAB
dans l'École Doctorale Electronique, Electrotechnique, Automatique, Télécommunication et Traitement du Signal
Vulnérabilité, Interdépendance et Analyse des Risques
des Postes Sources et des Modes d’Exploitation
décentralises des Réseaux Electriques
Thèse soutenue publiquement le 23 Octobre 2013, devant le jury composé de:M. Jovica MILANOVIC
Professeur à l’Université de Manchester, Président M. Abdellatif MIRAOUI
Professeur à l’Université Cadi Ayyad, Rapporteur M. Nouredine HADJ SAID
Professeur à Grenoble INP, Directeur de thèse M. Raphaël CAIRE
Maître de Conférences de Grenoble INP, Co-encadrant M. Olivier HUET
This dissertation is dedicated to my family, my dad Libardo, my mom Marcela, my sister Paloma, my little brother Rodrigo and my better half Marianita.
A
CKNOWLEDGMENTS
“Gracias a la vida, que me ha dado tanto, me ha dado el sonido y el abecedario, con él, las pa-labras que pienso y declaro: Madre, amigo, hermano y luz alumbrando, la ruta del alma de la que estoy amando” – Mercedes Sosa
3 years, 4 summers, 3 winters, 1218 days, 174 weeks… it is a long time, isn’t it? It is not possi-ble to succeed alone in research for a long time; discussions, movies, people, news and friends inspire a new ideas emerge. Therefore, many people were involved either directly or indirectly on this disser-tation. Even many people might not understand why I would like to thank them. I believe that if we live without thinking about rewards and we just do what we feel, what comes from the heart, we will maximize the happiness in the world, we will not be worried about little things and we will enjoy the fact that we are alive and that we can help other people. For this reason, it is a pleasure for me to thank those who made this thesis possible.
Firstly, I would like to thank Mr. Jovica Milanovic, Mr. Abdelatif Miraoui and Mr. Olivier Huet for their general interest, their feedbacks and their comments and for proofreading the manuscript. It is an honor for me to have a great evaluators committee with many years of experience.
Further, I am grateful to Mr. Nouredine Hadjsaid and Mr. Raphael Caire. Firstly, because they proposed me a fascinating research subject with a great sponsor, and secondly because they guided me and trusted my work and ideas.
I would like to show my gratitude to the SINARI Project members, for the stimulating discus-sions, for their support and for presenting me different research domains.
I owe my deepest gratitude to Mr. Mario Rios, who motivated me during my first steps in the electrical engineering at Universidad de los Andes and proposed me an interesting project for my Mas-ter degree. AfMas-terwards, he encouraged me to pursuit a PhD Degree at G2ELAB. I must say that with-out his motivation and encouragement, I would not have had the opportunity to come to France and to acknowledge the enjoyable and passionate Research World.
Research without documentation, papers, books and other resources is not possible. I would like to thank Sylvie, for her work and for letting me win the G2ELAB Petanque Tournament 2013 (well, it was a team work, thanks Ando and Daniel). As well as Elise, who helped me for the work-travel plan-ning and was so patient with me.
When I arrived to Grenoble, I had a very limited French level. But it was not an obstacle to find welcoming people, Asma, Lina, MC, Olivier, Yann, Jérémie, Phuong and Damien. I remember lunchtime with all of them at the office D-060 when I couldn’t understand a single phrase. They
intro-duce me the lab, the coffee time, but since they were 3rd year (almost 4th), they started leaving the laboratory.
Then, I found an already formed group from the Master program at ENSE3 and the Fresh 1st year students. I would like to thank Camille for the enjoyable conversations. Mihn, Ni, Kaustav, Ando, Luiz, Lyuvo, Selle, Long, Mathieu, Archie and other colleges, all of them were part of my process to become a PhD, who is not only a person that knows a lot about a single subject, but a person with the maturity of an adult to identify complex problems and with the curiosity of a child to try new and orig-inal solutions.
During my second year I was getting crazy and I started dreaming with networks. Yes ! Mr. Ba-rabasi was right: “Networks are everywhere.” So, I found a supporting group and a new passion: The Fish-keeping. The AASG Club (Association Aquariophile Sud-Grenoblois), with his president Mr. Fred Salmeron and the other members: Denis, Mario, Marc, Carine, Fred 2, André, Udo, Julien,… they offered me a place to connect with nature, to study other sciences and to share experiences in a “Not-secret” French Society. Thanks to all of them!
My family at the lab is complete with my lab mates: Nathalie, Raha and Julian. We share many coffee times, Frisbee times, BBQ’s, Birthdays… thanks for their support and for being there.
Many other friends helped me in the distance. Juan Rozo, he knew how to motivate me. Carlos Rodriguez guided me in the difficult path of living abroad. Camilo (Conejo), Dianis, Carlitos and Juan Carlos were there every time I went back to Colombia to show me their support and to encourage me. Thanks a lot!
Also, there are four people, living in South America, far far away in a country called Colombia, they always believed in me. Two of them, my parents, they put a t-shirt on me when I was a baby say-ing “I will be a Scientist,” so the less I can do is to get a PhD diplome. The other two, my sister and my brother, they are always ready to support me even if my decisions take me 8800km away from them. I have to thank life, for putting me in this family. For that reason, it is an honor to dedicate all this work to them; they deserve the best of the best.
Finally, 3-years have passed, with a lot of study, hard work, smiles, laughs, tears and it is diffi-cult to overcome all without a better half, a soul mate, una media naranja, or call it as you like. I found between books, graphs, papers, computers, kites and numbers a person that is my best friend, my best travel partner, the best dancer, the best singer and the best cook. I found a person that is willing to be at my side, to fight for our dreams, to solve the complex life problems, to explore the unexplored, to take decisions from the heart and to accept me even if I have 7-aquariums at home!!! Merci Mariamty!
C
ONTENTS
LIST OF FIGURES ... XI LIST OF TABLES ... XV LIST OF ACRONYMS ... XVII LIST OF NOTATIONS ... XIX
GENERAL INTRODUCTION ... 1
CHAPTER I CONTEXT AND DEFINITIONS ... 5
I.1 INTRODUCTION ... 6
I.2 CRITICAL INFRASTRUCTURES (CIS) ... 8
I.2.1 Definitions ... 8
I.2.2 Types of Interdependencies ... 9
I.2.3 Types of Failures ... 10
I.3 ELECTRIC POWER SYSTEMS (EPS) ... 11
I.3.1 Structure of Electric Power Systems ... 11
I.3.2 The Liberalized World and the Distributed Generation (DG) ... 13
I.4 ICTS FOR POWER SYSTEMS ... 14
I.4.1 Control assets of EPS ... 14
I.4.1.1 Remote Terminal Units (RTUs) ... 14
I.4.1.2 Programmable Logic Controllers (PLCs) ... 15
I.4.1.3 Intelligent Electronic Devices (IEDs) ... 15
I.4.1.4 Supervisory Control and Data Acquisition (SCADA) ... 15
I.4.2 Automation of Electric Power Systems ... 15
I.5 ICT AND EPSINTERDEPENDENCIES ... 18
I.5.1 ICT Threats on Power Systems ... 18
I.5.2 Power System threats on ICT ... 21
I.6 SUMMARY ... 22
CHAPTER II MODELING CRITICAL INFRASTRUCTURES: STATE-OF-THE-ART... 25
II.1 INTRODUCTION ... 26
II.2.1 Initiating event and cascade-safe operating margins ... 27
II.2.2 Global vulnerability of interdependent infrastructures ... 27
II.2.3 Interdependent technical infrastructures modeling ... 28
II.2.4 Rule-based complex networks ... 29
II.2.5 Advantages – Disadvantages ... 29
II.3 AGENT-BASED MODEL (ABM) ... 30
II.3.1 Object-Oriented Hybrid Modeling Approach ... 31
II.3.2 Agent-based input-output interdependency model ... 32
II.3.3 Federated Agent-Based model ... 32
II.3.4 Advantages - Disadvantages ... 33
II.4 BAYESIAN NETWORKS (BN)... 34
II.4.1 Cause-Effect interdependencies ... 34
II.4.2 Dynamic Bayesian Networks ... 35
II.4.3 Advantages - Disadvantages ... 36
II.5 BOOLEAN LOGIC DRIVEN MARKOV PROCESSES ... 36
II.6 COMBINED SIMULATORS ... 37
II.6.1 Cosimulator for Transport and Distribution systems ... 37
II.6.2 Real-time Cosimulator ... 38
II.6.3 Federate-based Simulator ... 39
II.6.4 Agent-based simulation tool: EPOCHS ... 40
II.6.5 Advantages - Disadvantages ... 41
II.7 PETRI NETWORKS (PN) ... 41
II.7.1 Attack/Defense modeling ... 42
II.7.2 “High-level” and “Low-level” Petri Nets... 43
II.7.3 SWN and SAN integration ... 43
II.7.4 Intrusion detection on Cyber Physical Systems ... 44
II.7.5 Advantages - Disadvantages ... 44
II.8 COMPARISON AND CONCLUSION ... 44
CHAPTER III VULNERABILITY AND INTERDEPENDENCIES: MODELING ... 47
III.1 INTRODUCTION ... 48
III.2 FROM GRAPH THEORY TO COMPLEX NETWORKS ... 49
III.3 CONCEPTUAL AND THEORETICAL FRAMEWORK ... 53
III.3.1 Notations of Complex Networks ... 53
III.3.1.1 Adjacency Matrix ... 53
III.3.1.2 Weight Matrix ... 54
III.3.1.3 Path length, Geodesic and Diameter... 54
III.3.1.4 Node Degree ... 55
III.3.1.5 Betweenness Centrality ... 55
III.3.1.6 Efficiency ... 57
III.3.2 Eigenspectral Analysis ... 58
III.3.2.2 Hilbert Space ... 59
III.3.2.3 Hermitian Matrices ... 60
III.4 VULNERABILITY AND CRITICALITY ANALYSIS ... 61
III.4.1 Electricity infrastructure topology analysis ... 61
III.4.2 The topology-driven Approach ... 67
III.4.2.1 Complex-valued Node Degree ... 68
III.4.2.2 Betweenness Centrality for multi-infrastructures ... 69
III.4.2.3 Electrical and ICT Efficiency ... 70
III.4.2.4 Partial Conclusions ... 71
III.4.3 Eigenspectral Analysis ... 72
III.4.3.1 Complex-weighted Adjacency Matrix... 72
III.4.3.2 Complex-valued node degree ... 73
III.4.3.3 Eigenspectral Centrality ... 73
III.5 SUMMARY ... 75
CHAPTER IV VULNERABILITY AND INTERDEPENDENCIES: APPLICATION ... 77
IV.1 TEST SYSTEM ... 78
IV.2 TOPOLOGICAL APPROACH RESULTS... 79
IV.2.1 Adjacency Matrix ... 80
IV.2.2 Complex-valued Node Degree ... 81
IV.2.3 Betweenness Centrality Analysis ... 86
IV.2.4 Efficiency ... 88
IV.2.5 Results Analysis ... 90
IV.3 EIGENSPECTRAL APPROACH RESULTS ... 93
IV.3.1 Complex-valued Node Degree ... 94
IV.3.2 Prestige Analysis ... 95
IV.4 CONCLUSIONS ... 98
CHAPTER V SYSTEM-OF-SYSTEMS VISION OF COUPLED INFRASTRUCTURES ... 99
V.1 INTRODUCTION ... 100
V.2 “LOW-LEVEL”SYSTEM DESCRIPTION ANALYSIS ... 101
V.2.1 Test system – HV/MV Substation ... 101
V.2.2 Complex-networks modeling methodology ... 104
V.2.3 Results “Low level” description ... 105
V.3 INTEGRATION OF “LOW LEVEL” AND “HIGH LEVEL” SYSTEM DESCRIPTION... 107
V.3.1 Methodology ... 107
V.3.2 Test case ... 108
V.4 SMART-GRIDS:ASGAM-BASED SYSTEM-OF-SYSTEMS VISION ... 112
V.4.1 Smart Grid Architecture Model (SGAM) ... 112
V.4.1.1 SGAM: Domains ... 113
V.4.1.2 SGAM: Zones ... 113
V.4.1.4 SGAM: Architecture ... 114
V.4.2 Complex Networks modeling ... 114
V.4.2.1 Step 1: High level system Description... 114
V.4.2.2 Step 2: Low Level system Description ... 114
V.4.2.3 Step 3: SoS vision of Smart Grids. ... 115
V.5 SUMMARY ... 115
GENERAL CONCLUSIONS ... 117
BIBLIOGRAPHY ... 121
APPENDIX A COMPLEX NETWORKS: ALGORITHMS AND APPLICATION ... - 1 -
A.1. TOOLBOX DEFINITION ... -1-
A.2. CENTRALITY INDEXES ... -4-
A.3. MORE INFORMATION ... -6-
A.4. BIBLIOGRAPHY ... -6-
APPENDIX B RECENT ATTACKS AND ICTS FAILURES ... - 7 -
B.1. RECENT ATTACKS AGAINST INDUSTRIAL CONTROL SYSTEMS ... -7-
B.2. INFORMATION AND COMMUNICATION SYSTEM FAILURES LEADING TO BLACKOUTS -10- B.3. CONCLUSIONS ... -11-
B.4. BIBLIOGRAPHY ... -11-
APPENDIX C PROJECTS INCLUDING COUPLED INFRASTRUCTURES ... - 15 -
C.1. PROJECTS ... -15-
C.2. STANDARDS ... -17-
C.3. BIBLIOGRAPHY ... -18-
L
IST OF
F
IGURES
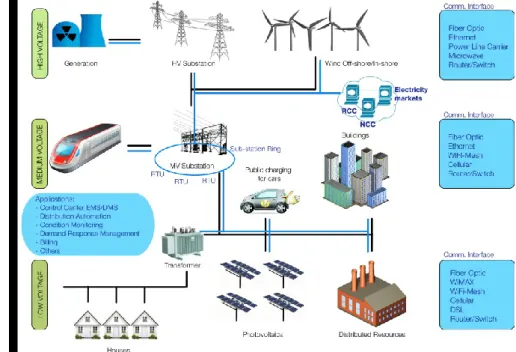
Figure I:1 Distribution Domain (NIST 2012) ... 7
Figure I:2 Dimensions of CIs interdependencies (Rinaldi, Peerenboom and Kelly 2001) ... 9
Figure I:3 Typical structure of Electric Power Systems ... 12
Figure I:4 New Electric Power System ... 13
Figure I:5 Hierarchical conceptual levels of EPS (Tranchita, Hadjsaid, et al. 2010) ... 16
Figure I:6 Electric power system and Control Network ... 17
Figure I:7 Incidents by Sector – 198 Total in Fiscal Year 2012 (ICS-CERT 2012) ... 20
Figure I:8 Auxiliary systems power supply ... 21
Figure II:1 Tested topological system (Zio and Sansavini 2011) ... 27
Figure II:2 Power Grid and Water Network in China (Wang, Hong and Chen 2012) ... 28
Figure II:3 Infrastructures Interdependencies (Johansson and Hassel 2010) ... 28
Figure II:4 Interdependencies Complex Network (B. Rozel 2009) ... 29
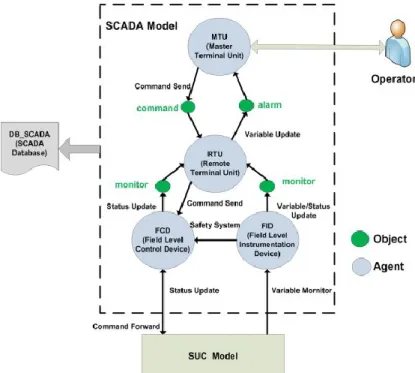
Figure II:5 Overall SCADA model (Nan, Eusgeld and Kröger 2013) ... 31
Figure II:6 Overall Dynamic Bayesian Network (Di Giorgio and Liberati 2012) ... 35
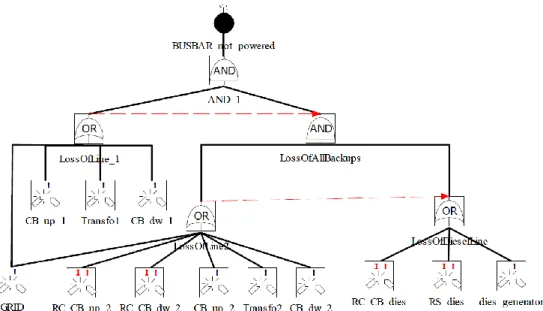
Figure II:7 BDMP Representation (Bouisson n.d.) ... 36
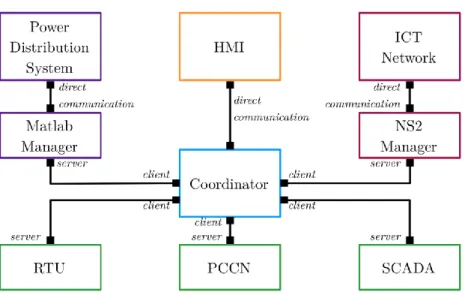
Figure II:8 Combined Simulator (Rozel, et al. 2008) ... 37
Figure II:9 Cosimulator Architecture ... 38
Figure II:10 Cyber-physical power system architecture (Stefanov and Liu 2012) ... 39
Figure II:11 Hybrid simulator components (Müller, et al. 2012) ... 40
Figure II:12 EPOCHS components (Hopkinson, et al. 2006) ... 40
Figure II:13 Petri Net Representation ... 41
Figure II:14 Cyber-net of Substation (Ten, Liu and Manimaran 2008) ... 42
Figure II:15 “Hierarchical” Petri Nets (Chen, Sanchez Aarnoutse and Buford 2011) ... 43
Figure II:16 Methods comparison ... 45
Figure III:1The 7 bridges of Königsberg ... 49
Figure III:2From Graph Theory to Complex Networks vs. Computers Timeline ... 50
Figure III:3 Robustness of Random and Scale Free Networks (Barabási and Bonabeu 2003) ... 52
Figure III:4 Demonstration graphs ... 53
Figure III:5 Undirected and Directed graphs ... 54
Figure III:6 Betweenness Centrality example ... 56
Figure III:7 Efficiency assessment methodology ... 57
Figure III:8 Efficiency for the test System ... 58
Figure III:9 G2ELAB 14-Bus Graph ... 62
xii
Figure III:11 IEEE 14-Bus Graph ... 62
Figure III:12 IEEE 14-Bus System ... 62
Figure III:13 IEEE 9-Bus Graph ... 63
Figure III:14 IEEE 9-Bus System ... 63
Figure III:15 IEEE 24-Bus Graph ... 63
Figure III:16 IEEE 24-Bus System ... 63
Figure III:17 IEEE 39-Bus Graph ... 64
Figure III:18 IEEE 39-Bus System ... 64
Figure III:19 IEEE 118-Bus Graph ... 65
Figure III:20 IEEE 118-Bus System ... 65
Figure III:21 Nodes Degree Distribution, IEEE 118-bus ... 66
Figure III:22 Test system ... 68
Figure III:23 Demonstration graph ... 70
Figure III:24 Four-layer analysis ... 72
Figure III:25 Demonstration graph for Spectral Analysis ... 73
Figure IV:1 Complete 14-Bus Tests System ... 78
Figure IV:2 Undirected Graph for the 14-bus Test system ... 79
Figure IV:3 Directed Graph for the 14-bus Test system ... 79
Figure IV:4 Adjacency Matrix – Undirected Network ... 80
Figure IV:5 Adjacency Matrix – Directed Network ... 80
Figure IV:6 Probability Degree Distribution ... 82
Figure IV:7 Cumulative Degree Distribution... 82
Figure IV:8 Multiple infrastructure Degree distribution ... 82
Figure IV:9 Probability Distribution – IN Degree ... 84
Figure IV:10 Cumulative Distribution – IN Degree ... 84
Figure IV:11 Multi-infrastructure Distribution – IN Degree ... 84
Figure IV:12 Probability Distribution – OUT Degree ... 85
Figure IV:13 Cumulative Distribution – OUT Degree ... 85
Figure IV:14 Multi-infrastructure Distribution – OUT Degree ... 85
Figure IV:15 Edges Betweenness Centrality – Undirected Graph ... 87
Figure IV:16 Edge Betweenness Centrality – Directed Graph ... 87
Figure IV:17 Vertex Electric Efficiency ... 89
Figure IV:18 Vertex ICT Efficiency ... 89
Figure IV:19 Edges Electric Efficiency ... 92
Figure IV:20 Edges ICT Efficiency ... 92
Figure IV:21 Two layers graph ... 93
Figure IV:22 Eigenspectrum of the Electric connections matrix ... 95
Figure IV:23 Eigenspectrum of the ICT connections matrix ... 95
Figure V:1”Low Level” & “High Level” description ... 101
Figure V:2 Complete 14-Bus Tests System ... 102
Figure V:3 Substation diagram including Control devices ... 102
Figure V:4 Substation Communication Network ... 103
Figure V:5 Auxiliary Control supply system ... 103
Figure V:6 Substation graph ... 104
Figure V:7 Integration of “Low level” and “High level” description ... 107
Figure V:8 Methodology to elaborate the SoS Model ... 108
Figure V:10 Graph ICT Interdependencies Global model ... 110 Figure V:11 SGAM Framework (CEN-CENELEC-ETSI 2012) ... 112 Figure V:12 Smart Grid “High level” description ... 115
L
IST OF
T
ABLES
Table I:1 Critical Infrastructure Sectors in the United States ... 9
Table I:2 Events categorized by initiating and affected sector (# of events) (Luiijf, et al. 2009) 11 Table I:3 Voltage levels in France according to NF C15-11 and NF C13-200 ... 12
Table I:4 Longest blackouts ... 22
Table III:1 Node degrees undirected graph ... 55
Table III:2 Node degrees directed graph ... 55
Table III:3 Node Betweenness Centrality ... 56
Table III:4 Edge Betweenness Centrality... 56
Table III:5 Graph properties for several systems ... 61
Table III:6 Graph properties ... 66
Table III:7 Node out-degree ... 69
Table III:8 Node out-degree ... 69
Table III:9 Betweenness Centrality Results ... 70
Table III:10 Efficiency Results ... 71
Table III:11 Complex-valued node degree... 73
Table III:12 Demonstration graph eigenvectors ... 75
Table IV:1 Node Degree – Undirected Graph ... 81
Table IV:2 Node Degree – Directed Graph ... 83
Table IV:3 Node Betweenness Centrality – Undirected and Directed Graph ... 86
Table IV:4 Vertices efficiency Undirected and Directed Graph ... 88
Table IV:5 Edges Electric Efficiency – Undirected and Directed Graphs ... 90
Table IV:6 Edges ICT Efficiency – Undirected and Directed Graphs ... 91
Table IV:7 Complex-Valued Node Degree ... 94
Table IV:8 Highest Eigenvalues Electric System ... 96
Table IV:9 Highest Eigenvalues ICT System ... 97
Table V:1 Eigenanalisis Substation System - Ae ... 105
Table V:2 Eigenanalisis Substation System - Ac ... 106
Table V:3 Nodes correspondence between “High level” and “Low Level” system description ... 108
Table V:4 Results Eigenspectrum Electric Interdependencies ... 111
L
IST OF
A
CRONYMS
ABM Agent-Based Modeling
AC Alternating Current
AGC Automatic Generation Control
AMI Advanced Metering Infrastructures
ANR Agence Nationale de la Recherche
ANSSI Agence Nationale de la Sécurité des Systèmes d’Information
BN Bayesian Network
BDMP Boolean logic Driven Markov Process
BMS Business Management System
CI Critical Infrastructure
CN Complex Network
CT Current Transformer
DC Direct Current
DCS Distributed Control System
DDoS Distributed Denial-of-Service
DER Distributed Energy Resources
DG Distributed Generation
DMS Distribution Management Systems
DoS Denial-of-Service
EMS Energy Management System
EPS Electric Power Systems
xviii
G2ELAB Grenoble Electrical Engineering Laboratory
HMI Human Machine Interface
ICS Information and Communication Systems
ICT Information and Communication Technologies
IDS Intrusion Detection System
IEC International Electrotechnical Commission
IED Intelligent Electronic Device
IEEE Institute of Electrical and Electronics Engineers
GPS Global Positioning System
LAN Local Area Network
LN Logical Node
LV Low Voltage
MTU Master Terminal Unit
NCC National Control Center
NERC North American Electric Reliability Corporation
PLC Programmable Logic Controller
PN Petri Network
PURPA Public Utility Regulatory Policies Act
RCC Regional Control Center
RTU Remote Terminal Unit
SAS Substation Automation System
SCADA Supervisory Control and Data Acquisition
SINARI Sécurité des Infrastructures et Analyse de Risques
SoS System-of-Systems
SoSE System-of-Systems Engineering
UPS Uninterrupted Power System
L
IST OF
N
OTATIONS
Δ Drop of Global Efficiency
σhj Geodesic path between node h and j
λ Eigenvalues
A Adjacency Matrix
ajh Adjacency matrix entry
b(l) Node Betweenness Centrality b(e) Edge Betweenness Centrality bglobal Global Betweenness Centrality
bc ICT Betweenness Centrality
be Electric Betweenness Centrality
D Diagonal matrix of degrees
D Distances matrix
dhj Distance between h and j
E Set of Edges
E Efficiency
Ec Efficiency for ICT nodes
Ee Efficiency for Electrical nodes
em mth edge in E
H Hermitian Matrix
kh Node Degree
khin Node In-Degree
khout Node Out-Degree
keh Electrical node degree
kch ICT node degree
xx
m Number of edges in the Graph
n Number of nodes in the Graph
P(k) Degree distribution P(kin) In-degree distribution
P(kout) Out-degree distribution
V Set of vertices
Vc Set of ICT vertices
Ve Set of Electric vertices
vn nth vertex in V
W Weights matrix
G
ENERAL
I
NTRODUCTION
Crazy people are not crazy if one accepts their reasoning
Gabriel Garcia Marquez
In 2003, the Midwest and Northwest of the United States and Ontario in Canada suffered one of the most catastrophic blackouts in the history. It was caused by a line fault that in normal conditions trips an alarm in the control center. However, operators were unaware of this condition and react too late because the alarm system failed few minutes before the electrical failure. This caused a cascade phenomenon that cost between US$7 and 10 billion (US-Canada Power System Outage task force 2004) and affected almost 50 million customers. Today, 10 years later, a study conducted by Ventyx (Franko and Fahey 2013) showed that in the United States the electric utilities spend an average of 16500€ per year on devices and station equipment per mile of transmission line, which shows the great investment on technologies to make the system stronger and more resilient.
Moreover, not only hidden failures on ICT can affect power systems, but targeted attacks against power systems can also lead to catastrophic outages. According to the ICS-CERT, in the first half of fiscal year 2013 (October 1, 2012 – May 2013) the energy sector suffered 53% of cyberattacks against critical infrastructures (ICS-CERT April/May/June 2013), i.e. infrastructures that play an im-portant and vital role in all main functions of modern societies, including: government facilities, ener-gy systems, hospitals and banks (Rinaldi, Peerenboom and Kelly 2001). These examples show a high impact of Information and Communication Technologies (ICTs) on the performance of power sys-tems.
Last decades have been marked by a wide and pervasive deployment of Information and Com-munication Technologies in many sectors. As technologies become cheaper and more powerful, new ideas are emerging, new projects are sponsored and new intelligent devices can be found in the mar-ket, all of them promise to improve the efficiency, reliability and availability of infrastructures, charac-terizing this digital age. Furthermore, these technologies pretend to prepare current power systems to the new challenges. Some of these challenges are large distributed generation deployment, systems operating limits, demand rising and the liberalized market.
Nevertheless, the interaction and interdependencies of infrastructures are creating a highly inter-connected complex System-of-Systems, where failure(s) in one infrastructure can have a catastrophic impact on other infrastructures.
This problem has been addressed by the US Homeland Security Department and the European Commission (European Commission 2011), and new policies are being created in order to ensure the
2
service continuity of Critical Infrastructures. As a result, many projects have been initiated in order to understand the behavior of coupled infrastructures, one of these projects is the SINARI Project, spon-sored by the ANR (Agence Nationale de la Recherche)-France. This project treats the impact of ICTs failures on the secure operation of the electrical distribution network. The present thesis was devel-oped as a part of this project.
Although various researchers have studied the vulnerability of power systems (mostly for Transmission Power Systems) and ICT infrastructures, those studies are still in an early stage and many questions remain unanswered. Some of these unanswered questions revolve around the mutual behavior of coupled infrastructures. This gap highlights the need of new innovative methods to under-stand the interdependencies among and within critical infrastructures and consequently to improve the analysis of power systems security. This dissertation is focused on the particular case of distribution systems as they are experiencing tremendous changes with a wide deployment of ICTs.
Therefore, the main problem that this dissertation addresses is the lack of methods to analyze and study coupled critical infrastructures, specifically to identify their interdependencies and vulnera-bilities in the context of wide deployment of ICTs. The solution of this problem may provide a better vision of system-of-systems that will support reliability, security and risk analysis and should help to make power systems more secure.
The main scientific and technical obstacles (or challenges) that this dissertation has to tackle are:
The need of a flexible model to be used for many heterogeneous infrastructures. Nowadays there is a growing interest within the scientific community to find a model that helps to de-scribe the behavior of multiple interconnected infrastructures for a global system-of-systems vision and it is well known that such model does not exist yet.
New methods have to reflect the interactions among and within infrastructures. They have to consider several types of interdependencies and they have to be easy and simple to use. Because the main problem of this dissertation covers three large domains: Power
distribu-tion systems, Communicadistribu-tion networks and automadistribu-tion and control of power systems. It is needed to study each domain and understand their interdependencies.
A review of the literature has resulted in identifying the most common and promising methods to model interdependent infrastructures, including: Agent-based modeling (Casalicchio, Galli and Tucci 2007), Petri Networks (Beccuti, et al. 2012), Combined Simulation (Rozel, et al. 2008) and Complex Networks Theory (Zio and Sansavini 2011). After comparing these methods with respect to the scientific objectives and challenges of this dissertation, it has been decided to focus specifically on the Complex Networks Theory for developing an integrated model for coupled power and ICT infra-structures.
Complex Networks enables the modeling of large systems as graphs. In addition, these networks have been extensively used to model, analyze, and understand large systems with non-trivial topolo-gies and hidden interdependences. What is more, this approach allows systems topology characteris-tics and connectivity properties to be known, as well as, fault and cascading phenomena analysis to be performed. This latter aspect is indeed important because these properties allow the role and the im-portance of each component in the whole interconnected system to be identified.
Therefore, in order to elaborate a single and integrated model, this dissertation proposes to adapt the theory of Complex Numbers to the theory of Complex Networks. The result of this symbiosis is a two-dimensional model, which allows inherent vulnerabilities of coupled infrastructures to be
under-stood and identified. Some of the main properties of Complex Networks are analyzed in order to iden-tify the most critical or most central elements in the system with respect to topology-driven analyses.
The research is guided by the following propositions:
There is a close relationship between the structure of coupled infrastructures and its dynam-ics, therefore, studying the systems’ topology will ultimately allow the unknown key-properties to be found;
Asymmetrical communication patterns on multi-infrastructure systems can be represented by bi-directional edges on complex networks;
The global behavior of coupled infrastructures may reveal emergent unknown phenomena as a result of their interactions.
This dissertation is organized in five Chapters and three appendices. CHAPTER I presents an overview of many concepts that involve the studied problem. Some of these concepts include: Critical Infrastructures, Interdependencies, Power Systems control and monitoring, and vulnerability of cou-pled infrastructures.
CHAPTER II presents a State-of-the-art on last modeling methods that address the problem of coupled infrastructures interdependencies.
CHAPTER III proposes two approaches to model coupled infrastructures.
CHAPTER IV applies the approaches chosen to a typical French Distribution Network.
CHAPTER V analyses the problem from a System-of-Systems point of view. Evaluating the in-teraction of different actors involved in the interconnected system. Additionally, it proposes a new methodology to model the interdependencies within Smart Grids.
Appendix A presents a larger explanation on Complex Networks and presents some of the algo-rithms and codes developed throughout this research project.
Appendix B summarizes main outages and cyber-attacks on Power System facilities. These ex-amples show that Power Systems are vulnerable to failures in the ICT infrastructure.
Appendix C outlines the evolution of policies and projects over the last decade with regard to the interconnections between Power Systems and ICTs.
CHAPTER I
Context and Definitions
What we do in life echoes in eternity.
Maximus TABLE OF CONTENTS
I.1 INTRODUCTION ... 6 I.2 CRITICAL INFRASTRUCTURES (CIS) ... 8 I.2.1 Definitions ... 8 I.2.2 Types of Interdependencies ... 9 I.2.3 Types of Failures ... 10 I.3 ELECTRIC POWER SYSTEMS (EPS) ... 11 I.3.1 Structure of Electric Power Systems ... 11 I.3.2 The Liberalized World and the Distributed Generation (DG) ... 13 I.4 ICTS FOR POWER SYSTEMS ... 14 I.4.1 Control assets of EPS ... 14 I.4.1.1 Remote Terminal Units (RTUs) ... 14 I.4.1.2 Programmable Logic Controllers (PLCs) ... 15 I.4.1.3 Intelligent Electronic Devices (IEDs) ... 15 I.4.1.4 Supervisory Control and Data Acquisition (SCADA) ... 15 I.4.2 Automation of Electric Power Systems ... 15 I.5 ICT AND EPSINTERDEPENDENCIES ... 18 I.5.1 ICT Threats on Power Systems ... 18 I.5.2 Power System threats on ICT ... 21 I.6 SUMMARY ... 22
6
Abstract
The material in this chapter is intended to serve as a brief account of the context and the problem that re-volve around this thesis. Power Systems and Information and Communication Technologies (ICTs) are studied as Critical Infrastructures. These infrastructures are highly interconnected and are interdependent. Failures in one infrastructure can reach the other infrastructure originating cascades, common cause or emerging failures. Threats on ICTs, as lack of integrity, availability, confidentiality, authenticity and traceability, can affect the Power System behavior. As well, power system blackouts and auxiliary systems’ failures can critically affect the ICTs that control and monitor the power system through sensors and communication means.
I.1 Introduction
In the 18th century, scientists dedicated most of their attention to the study of electricity. In the early 1750’s, Benjamin Franklin had the famous anecdote about the metal key at the bottom of a kite string during a storm. After that, Alessandro Volta, André Ampère, Michael Faraday, George Ohm, James Maxwell, Nikola Tesla, Thomas Edison and other researchers developed different branches of electromagnetism physics that have allowed humanity to progress and to change its lifestyle. Today, we live in a world where industrial facilities, homes, schools, universities, hospitals, banks and other infrastructures depend on electricity, a world where an outage for a few minutes can have a devastat-ing impact on nation’s economy and security (Halpin, et al. 2006).
Nowadays, infrastructures that are vital for nations’ welfare and security are considered as “Critical Infrastructures” (CIs). Energy Infrastructure is one of them, which includes the production, refining, storage, and distribution of oil, gas, and electric power. Additionally, Information and Com-munication Technologies (ICT) are considered as a critical infrastructure. Although ICTs have only existed for a relatively short time, they have become so essential to the society that their incapacity would have a negative impact in many other infrastructures, including public health, defense systems and banking.
Power Systems are not an exception of the influence of ICTs, since these technologies have been progressively deployed in power systems and nowadays they are a vital part of the remote con-trol, protection and supervision systems, helping to increase the reliability, availability and safety of Power Systems. Moreover, future power networks will have a higher dependency on ICT networks, ‘Smart Grids’ will exchange communication flows with control centers, electric wholesale market, transmission network, end-users, distributed storage and distributed generation; and internal commu-nication flows between control, measure and protection components, e.g. Remote Terminal Units. Figure I:1 shows the main communication flows in Distribution Systems, including Internal and Ex-ternal Communications (NIST 2012).
However, the wide integration of ICTs within Power Systems adds complexity to an already complex field, as in the case of Power Systems. Recent events showed that failures in one infrastruc-ture affect other infrastrucinfrastruc-tures. For instance, the US 2003 blackout (US-Canada Power System Outage task force 2004) taught us that the electrical grids are vulnerable and that a failure in the ICT system can have catastrophic consequences on power systems. Another example is the Stuxnet worm (Falliere, Murchu and Chien 2011). It showed that cyber events can actually target specific energy infrastructures and that the level of securityi awareness in Power Systems is questionable. These and
other cyber-physical events are summarized in Appendix B.
In response to these events, diverse research centers and Universities addressed this issue in numerous ways, e.g. the SINARI French project “Infrastructures Security and Risk Analysis.”ii These studies are based on the idea that it is difficult to protect an infrastructure without identifying and un-derstanding its interdependent vulnerabilities. As well, several standards have been developed in order to ensure the interoperability and security of coupled heterogeneous infrastructures, e.g. Standard IEEE 2030-2011 “Guide for the Smart Grid Interoperability of Energy Technology and Information Technology Operation with the Electric Power System, End-Use applications and loads.”
The Critical Infrastructures Interdependencies have been addressed in the Grenoble Institute of Technologyiii/G2ELAB (Grenoble Electrical Engineering Laboratory)iv as early as late 90s through various research works, industry partnerships and European projects (GRIDv (GRID 2007), SYS-GEEN-ICTvi). Among the PhDs works dealing with this subject, Dr. Rozel has compared different methods to model and study Critical Infrastructures Interdependencies (B. Rozel 2009) and Dr. Tranchita has studied the phenomenon of terrorism and developed a risk assessment for power systems security with regards to targeted events (Tranchita 2008). Currently, Critical Infrastructures studies are one of the main research axes at Grenoble Institute of Technology/G2ELAB.
One of the main problems when it comes to evaluating and identifying vulnerabilities of ICTs and Power Systems is the modeling of their interdependencies. Therefore, in order to solve this prob-lem, it is important to understand how Power Systems and Information and Communications Systems are interconnected. Specifically, in the context of this dissertation, it is important to understand the role of RTUs (Remote Terminal Units) or even IEDs (Intelligent Electronic Devices) as part of the Power Systems – ICT interface, the SCADA System as the nervous system and Control Centers (CC) as the brain of this interconnected complex system.
short-circuits or non-anticipated loss of system components.”
ii In French Sécurité des Infrastructures et Analyse de Risques (http://www.sinari;org) iii In French Grenoble - Institut Nationale Polytechnique (http://www.grenoble-inp.fr) iv In French Grenoble Génie Electrique Laboratoire (http://www.g2elab.grenoble-inp.fr) vhttp://grid.jrc.it
vihttp://seesgen-ict.rse-web.it/
8
This Chapter is structured in the following sections:
Section I.2 offers a general overview of CIs and their interdependencies.
Section I.3 presents a brief introduction to Power Systems and the new paradigm of Liberal-ized Power Systems.
Section I.4 addresses the control systems on electric power systems.
Section I.5 presents the interdependencies and threats between Power Systems and ICTs. Section I.6 presents a summary and concludes with the key objectives of the dissertation.
I.2 Critical Infrastructures (CIs)
I.2.1 Definitions
The term “Critical Infrastructure” (CI) is evolving, as indicated in (O'Rourke 2007). In the 1980’s, it appeared in many policy debates. However, it was in 1996 that the term CI was used by the first time in terms of National Security (President of the US 1996). Currently, there are several defini-tions of Critical Infrastructures.
The Commission of the European Communities (European Union 2008) is defining a Critical infrastructure as: “an asset, system of part thereof located in Member States which are essential for the maintenance of vital societal functions, health, safety, security, economic or social well-being of people, and the disruption or destruction of which would have a significant impact in a Member State as a result of the failure to maintain those functions.”
European critical infrastructures classification includes (Commission of the European Communities 2004):
Energy installations and networks;
Communications and information technologies; Finance (banking, securities and investment); Health care;
Food;
Water (dams, storage, treatment and networks);
Transport (airports, ports, intermodal facilities, railway and mass transit networks and traf-fic control systems);
Production, storage and transport of dangerous goods (e.g. chemical, biological, radiologi-cal and nuclear materials);
Government (e.g. critical services, facilities, information networks, assets and key national sites and monuments).
Likewise, the US Department of Homeland Security identified 18 Critical Infrastructure Sec-tors, showed in Table I:1, and defined CIs as “assets, systems, and networks, whether physical or vir-tual, so vital to the United States that their incapacitation or destruction would have a debilitating effect on security, national economic security, public health or safety, or any combination thereof ” (US Department of Homeland Security 2009).
Despite the different concepts of CIs, it is clear that CIs play an essential role in all main func-tions of modern societies and it is important to understand their interacfunc-tions and interdependencies to prevent catastrophic events caused by unknown vulnerabilities. Thereby, (Rinaldi, et al., 2001)
proposed different dimensions for describing infrastructure’s interdependencies – see Figure I:2 – including coupling and response behavior, types of failures, infrastructure characteristics, state of operation, types of interdependencies and environment. This dissertation is engaged particulary to the study of the types of interdependencies and the types of failures, both subjets are described in Sections I.2.2 and I.2.3 respectively.
I.2.2 Types of Interdependencies
At first glance every infrastructure operates separately. However, there are linkages between them, either tangibles or intangibles that build a complex coupled System-of-Systems (SoS) (Gorod, Sauser and Boardman 2008). A SoS is characterized by highly automated networks with multiple complex interdependencies. For that, (Rinaldi, Peerenboom and Kelly 2001) identified four types of interdependencies on critical infrastructures:
Physical: Represented by a physical linkage between the inputs and outputs of two agents in Table I:1 Critical Infrastructure Sectors in the United States
Food and Agriculture Banking and Finance Chemical Commercial Facilities Communications Critical Manufacturing
Dams Defense Industrial Base Emergency Services
Energy Government Facilities Healthcare and Public Health Information Technology National Monuments and icons Nuclear Reactors, materials and waste
Postal and Shipping Transportation systems Water
Figure I:2 Dimensions of CIs interdependencies (Rinaldi, Peerenboom and Kelly 2001)
10
different infrastructures, e.g. power systems supply power to oil infrastructures for pump stations and control systems.
Cyber: connects the state of one infrastructure to others, depending on information transmit-ted through the communications infrastructure, e.g. water facilities depend on ICT to super-vise and monitor the water pumping and cooling. (Kröger and Zio 2011) proposed to call it “Informational,” in order to include hardware and software.
Geographic: Infrastructures geographically located at the same place, where a single event can negatively affect them, e.g. in power substations when a transformer explodes and the fire burns communication cables, affecting the information and communication system. (Kröger and Zio 2011) proposed to call it “geospatial.”
Logical: When the state of one infrastructure depends on the state of another infrastructure via a connection that is not physical, cyber nor geographic, e.g. the European outage in 2006, despite it was a 30 minutes outage, French relief centers were inundated with calls (UCTE 2007). (D. Watts 2004) describes this type of interdependency in many areas be-sides critical infrastructures.
(De Porcellinis, et al. 2008) proposes a fifth interdependency called ‘Social’, when the function-ing of the whole system relies on the human behavior and activities, e.g. when a worker’s strike blocks off train rails.
I.2.3 Types of Failures
Since CIs are interdependent, a failure on one infrastructure can have a catastrophic impact against other infrastructures in the System-of-Systems. Three types of failures are identified (Rinaldi, Peerenboom and Kelly 2001):
Common mode: Occurs when two or more infrastructures are affected simultaneously be-cause of an external and common be-cause, e.g. tornado and earthquake.
Cascading: Occurs when a failure in one infrastructure causes a failure in a second infra-structure.
Escalating: Occurs when a failure, resulting from the interaction between two infrastruc-tures, exacerbates another failure.
Table I:2 presents which CIs originated an event and which CIs are affected by the event. Data are from a database containing recordings of 2515 CI’s failures in multiple CIs around the world. The energy infrastructure has the higher number of incidents affecting other infrastructures. As well, indus-try, telecom and water infrastructures have an impact on the energy infrastructure, illustrating the need to understand the causes of these incidents and how these infrastructures are linked. A complete analy-sis is presented in (Luiijf, et al. 2009).
Therefore, as mentioned in (Kröger 2008), it is needed to create new conceptual approaches and extended analytical tools to knowledge the critical linkages between CIs in order to prevent critical failures and to improve the Power Systems resilience.
Both issues, interdependencies and failures of CIs, are analyzed in Section I.4 for Power Sys-tems and ICT infrastructures.
I.3 Electric Power Systems (EPS)
The main objective of Electric Power Systems, as we know them today, is to supply electrical energy to clients on wide territories. In order to achieve this objective, Power Systems are structurally divided into generating stations, transmission and distribution networks, and end-users. This division was developed mainly for economic reasons resulting in traditional and historical descendent power flows, from generating units to end-users.
Nevertheless, Power Systems are taking a new direction that is characterized by the reorganiza-tion of the electrical system to create condireorganiza-tions for open competireorganiza-tion between different players, which has been called: the Liberalized World. The new conditions are incentives for consumers to install local generation means and the use of renewable sources. But this new paradigm introduced new prob-lems and challenges (Hadjsaid, Canard and Dumas 1999). In order to understand the new challenges and why ICTs are increasingly becoming an essential part of power systems, this section briefly pre-sents and introduction to the EPS structure, the Distributed Generation integration and the liberalized world.
I.3.1 Structure of Electric Power Systems
Traditionally, Electric Power Systems comprise:
Generation: Electric power is generated by 50/60 Hz synchronous rotating machines, con-verting mechanic energy into electrical power. In France, in 2012, electrical energy was generated as follows: 74.8% from Nuclear Plants, 11.8% from hydroelectric plants, 8.8% from coal plants, and the remaining 4.6% from gas, wind generators, solar energy, and other renewable energies (RTE 2013).
Transmission: In this level, generated electric power is transmitted from generation plants to distribution networks. Many components are involved in the transmission networks, e.g. transmission lines, substations, transformers, control and protection systems, transmission towers, etc. Some industrial customers are supplied directly at this level.
Distribution: Distribution networks deliver the power directly to all consumers.
Power flows in this typical structure are directed from generation plants to consumers. In order Table I:2 Events categorized by initiating and affected sector (# of events) (Luiijf, et al. 2009)
CI Sector Initiating Sector
No
Sector Energy Financial Services Government Health Industry Internet Services Postal Telecom Transport Water TOTAL
Education 1 1 - - - 2 4 Energy 515 65 - - - 4 - - 2 1 3 589 Financial 34 5 3 - - - 3 - 15 - - 60 Food 4 3 - - - 1 - 8 Government 27 17 - 1- 1 1 4 - 14 1 1 67 Health 23 11 - - 2 - - - 2 - 1 39 Industry 12 12 - - - 1 - - - 1 1 27 Internet 109 14 - - - - 10 - 27 - - 160 Postal Serv. 1 - - - 1 Telecom 170 62 - - - - 1 - 57 5 - 295 Transport 294 98 - 1 - 3 - 1 5 15 5 422 Water 58 14 - - - 2 - - - - 2 76 Total 1248 302 3 2 3 11 18 1 122 24 15 1749
12
to reduce the energy lost in the large electric grid, there exist different power levels and thus different voltage levels, from 1200 kV (in Chinese transmission networks) to 110 V (residential voltage-level in some countries). A typical structure of power systems is depicted in Figure I:3. Table I:3 shows the voltage levels in France.
In order to ensure the transmission of electricity, elementary components are included in the system (Hewitson, Brown and Balakrishnan 2005), some of them are:
Lines: Transmission lines and distribution lines either overhead or underground cable type. Buses: are the substations of the power system, internally they are composed of several
bus-bars and/or transformers and serves to connect lines with different or same voltage levels. Transmission towers/pylons: Structures that supports power lines.
Transformers: Interconnection and Distribution transformers. Used to raise or decrease the voltage or current of the original source.
Circuit breakers: Equipment used to switch and control electrical power. Their main pur-pose is to clear faulty currents.
Measurement transformers (CT – VT): They are instrument transformers designed to trans-form currents or voltages from high value to a value easy to handle for relays and instru-ments.
A description of Electric Power Systems can be found in (Hadjsaid and Sabonnadière 2009), (Grigsby 2007) and (W.-K. Chen 2005), which may help to better understand the work presented in this dissertation.
Table I:3 Voltage levels in France according to NF C15-11 and NF C13-200
Voltage Level Nominal AC Voltage Standard Voltages
HTB3 High Voltage B 3 350 kV < Un ≤ 500 kV 400 kV
HTB2 High Voltage B 2 130 kV < Un ≤ 350 kV 150, 225 kV
HTB1 High Voltage B 1 50 kV < Un ≤ 130 kV 63, 90 kV
HTA2 High Voltage A 2 40 kV < Un ≤ 50 kV 40.5 kV
HTA1 High Voltage A 1 1 kV < Un ≤ 40 kV 5.5, 6.6, 10, 15 ,20, 33 kV
BTB Low Voltage B 500 V < Un ≤ 1000 V 690 V
BTA Low Voltage A 50 V < Un ≤ 500 V 230, 400 V
TBT Extra-low Voltage Un ≤ 50 V 12, 24, 48 V
I.3.2 The Liberalized World and the Distributed Generation (DG)
Back in 1978, the Public Utility Regulatory Policies Act (PURPA) was presented in the United States; this act determined the beginning of the deregulation process (first free-market approach) and promoted the research on novel and sustainable technologies, to produce electricity from renewable sources such as water, wind or solar power.
Firstly, the deregulation process pursued to create conditions for free competition between dif-ferent actors. This model is called the New Paradigm (Hadjsaid and Sabonnadière 2009). In this new model it appeared that sharing data among actors for economic reasons as well as for reliability rea-sons is critical. It can only be guarantee by an available, reliable and secured communication network. Secondly, research on environmental-friendly technologies tried to change the paradigm of gen-eration plants with large-scale equipment, to produce on-site and in small-scale electricity, what was called Distributed Generation (DG). Some of the main advantages of DG small-scale equipment are: they can be built in a really short time and these generating units are mostly located at the distribution level close to the customer or at the customer site (it then should reduce the need to transport electrici-ty hundreds of kilometers). Among the advantages seen for DGs are: improved grid securielectrici-ty due to the reduction of terrorist targets, reduced CO2 emissions with widespread use of DG technologies based on renewable sources, increased efficiency through the development of cogeneration technologies (reuse of energy that would be wasted, e.g. thermal energy) and local management of energy, contri-bution to security of supply, etc. Figure I:4 shows the new Electrical Power System including DG.
Nevertheless, DG technologies have social and technical disadvantages. On the one hand, the development of new green-technologies is expensive, which deters people from investing without appropriate government subsidies. On the other hand, DGs are more difficult to monitor, interconnect, and –in some cases– to maintain. Furthermore, they introduce new technical and economic challenges to the distribution system grids as they were not originally designed to integrate these local generation units at large scales.
14
I.4 ICTs for Power Systems
Markets liberalization and distributed generation deployment led to profound modifications in the structure of the electric power system. That is, from ‘quasi-monopoly’ system to an open access offering market conditions to companies.
Market competition requires transparency and symmetry of information. Therefore, it is manda-tory to share real-time information and to ensure a controlled, protected and monitored system. For this reason, many Information and Communication Technologies were distributed in the electric pow-er grids; these technologies are able to acquire, store, process system measures and commands (PSERC 2012).
Some of the main applications of ICTs on power grids, control strategies for distribution power systems, control assets and critical threats to ICT and power systems are presented in this section.
I.4.1 Control assets of EPS
Supply of high quality electricity, in constrained power system, is difficult to achieve without a continuous knowledge of the state of the electric power system. For this reason, on-field instrumenta-tion and communicainstrumenta-tion technologies are used to acquire and send measurements via a telecommuni-cations infrastructure to a control center. Control centers process the data and find the appropriate commands to maintain the electrical parameters within an acceptable range. Some of these assets comprise: Remote Terminal Units, Programmable Logic Controller (PLC), Intelligent Electronic De-vices (IEDs), Human Machine Interface (HMI), and Supervisory Control And Data Acquisition SCADA System (Knapp 2011), (Galloway and Hancke 2012), (Gönen 2008).
I.4.1.1 Remote Terminal Units (RTUs)
RTUs are data collectors that provide connectivity (on the slave side) to the SCADA network (on the master side), since RTUs acquire field digital and analog parameters and transmit them back to a Distributed Control Systemvii (DCS) or SCADA system in a control center. RTUs are considered as the interface of the network buses in the physical layer with the cyber layers (Bompard, Cuccia, et al. 2012).
RTUs include remote communications capabilities such as wire modem, cellular data connec-tion, radio, and/or other wide area communication capabilities. As well, RTUs use industrial network protocols, mostly defined by the Standard IEEE 60870-5-104. They are microprocessor powered and use a set of analog and digital input/output channels. These channels can be implemented through various physical media such as parallel-resonant circuit on power lines carriers, telephone wires, optic fibers, radio wave and satellite communications.
Since RTUs are typically located in substations or in a remote location, they are extremely du-rable and reliable in order to withstand harsh field conditions. The RTUs power supply is provided by a DC/DC converter and includes a battery and charger circuitry to continue operation in an event of long power outage.
I.4.1.2 Programmable Logic Controllers (PLCs)
PLCs automate functions on EPS. They are specialized computers with multiple analogical or numerical inputs/outputs. PLCs rely on blocks of logic code allowing them to automatically operate to specific signals, e.g. from a relay or a sensor. They are programmed using specialized software (e.g. Simatic Step 7, Unity Pro) on personal computers. PLCs include built-in communication ports such as series RS-232 or Ethernet, using Modbus, DF1 protocols among others, thus they can be connected to a computer running SCADA. They are more intelligent than RTUs and have the ability to issue con-trols without taking direction from a Master Unit.
I.4.1.3 Intelligent Electronic Devices (IEDs)
An IED is any device from the RTU family with signal processing as well as control and com-munication abilities that is equipped with a small microprocessor and is able to receive or send da-ta/control from/to an external source. IEDs use fieldbus protocols and include functions and features such as self-check, diagnostics and historical data store.
I.4.1.4 Supervisory Control and Data Acquisition (SCADA)
One of the multiple definitions of SCADA is: “SCADA is the equipment and procedures for controlling one or more remote stations from a master control station. It includes the digital control equipment, sensing and telemetry equipment, and two-way communications to and from the master stations and the remotely controlled stations” (Gönen 2008, 216)
However, there are disagreements among experts. For instance, it can be found definitions like: “A SCADA system is a purely software layer, normally applied a level above control hardware within the hierarchy of an industrial network.” In fact, there is still a discussion between control engineers about the definition of Industrial Control System (ICS) and SCADA System (Byres 2012).
The definition of the SCADA retained in this thesis is an information system that allows the transfer of remote commands, annunciation and telemetry signals necessary to the monitoring and control of the electric power system.
Master Terminal Units are known as the heart of the SCADA system. MTUs are located at the operator’s control center facility. The data from all RTUs in remote sites are sent to the MTU to be processed and stored.
HMIs are the interface between the Operator (Human) and the electric power system (machine). They play a vital role for systems’ automation since they allow important tasks such as control, moni-toring, diagnosis and managing of EPS to be processed. Through HMIs, operators open and close cir-cuit breakers, visualize current operational parameters on screens (voltages, current, and state of switchgears), adjust system values and other functions, etc. Usually, HMIs are connected to one or more PLC and RTUs. HMIs show information on text displays, graphical panels, touchscreens or web-based interfaces.
I.4.2 Automation of Electric Power Systems
In the context of automation, Electrical Power Systems are generally divided into five hierar-chical levels as shown in Figure I:5. Three levels are for Substation Automation Systems: Process level, bay level and station level. The other two levels are: the regional control center (RCC) level and the national control center level (NCC).
16
Substation Automation Systems operate, protect and monitor the substation using dedicated technologies, such as sensors, actuators or relays, and communication links that create interfaces to exchange control and protection data. Substations are divided into levels to discriminate its main func-tions (IEC 61850 2003), (Zima and Bockarjova 2007), these levels are: process level, bay level and station level.
Process level is the lowest level and its devices are sensors and actuators; sensors report the sta-tus of switchgears, measure the voltage and currents through Voltage Transformers (VT) and Current transformers (CT); and actuators are used to perform the control actions, e.g. switchgears or breakers. Process level exchanges CT and VT data and control-data with Bay Level.
Bay level is composed of control and protection units. Usually each unit is implemented in a dif-ferent panel board. Each cubicle can have a CPU that interprets the data, storing devices for real-time computations, filters, AC/DC converters to transform analog measures into digital data, an HMI, a power supply module, an interface to exchange inter-bays’ information, an interface to process level, and an interface to station level. Bay level exchanges protection-data with external remote protection units, and control and protection data with station level.
Station level consists of a station computer with a database, the operator’s workplace, interfaces for remote control, and peripheral devices, e.g. alarm and event printers, a GPS master. Station level can exchange information with Regional Control Centers (RCC) and the National Control Center (NCC).
In the RCC level, operators supervise in real time the transmission network status, identify line faults, decide actions to recover the functionality of the transmission network and manage congestions in the network. Since EPS have many economic and security constraints, RCC exchanges data from control and protection devices with the Station level to adjust voltages at buses and current over lines.
The NCC level is the most important because it is considered as the brain of the system (Wu, Moslehi and Bose 2005). The NCC supervises the whole network state, including system frequency, grid voltages, powers and currents among others; as well, coordinates actions during large disturb-ances to restore the network. Both control centers are equipped with Energy Management Systems (EMSs).
EMS is an operators’ decision support tool to monitor, control, coordinate and optimize the per-formance of the system. EMSs have several supporting software applications, including on-line power flow, optimal power flow, voltage profile, state estimation, generation scheduling, load prediction and
security analysis. EMSs have two main classes, one to manage the transmission network, the other one, the Automatic Generation Control (AGC), used to adjust the power generated on power plants to match the load (Hadjsaid 2008), (Knight 2001).
EMS is considered as the heart of a control center, since it controls the flow of electricity through the system according to economic and security constraints. Economic constraints are defined by the Business Management System (BMS) that exchanges scheduled prices and settlements infor-mation with the EMS to fulfill electricity market rules (Tranchita, Hadjsaid, et al. 2010).
Figure I:6 presents the electric power system structure, including its control network, their ap-plications and the typical communication interfaces.
Control and protection data exchanged among levels include (Bompard, Cuccia, et al. 2012): bus voltage at every substation,
bus frequency,
active and reactive powers in lines and bus, positions of switchgears at every busbar, position of tap changers,
perturbations signals and alarms, regulation and parameters state,
load frequency control and automatic voltage regulation set point, remote commands,
load shedding remote command, power generation reduction command. …
These data are transmitted either periodically or by request and must be handled under strict
18
rules of confidentiality, acquisition, coordination and usage. Security issues handling this data and main vulnerabilities on power systems and ICT are discussed in the next section.
I.5 ICT and EPS Interdependencies
I.5.1 ICT Threats on Power Systems
As shown above, Electric Power Systems operators rely on Information and Communication Technologies to monitor and control the network. Nevertheless, there is still a critical question: Is the ICT infrastructure improving or endangering the security, the reliability and the resilience of Power Systems? Recent events (see Appendix B) revealed several facts. i) Failures in ICT infrastructure can actually affect Power Systems. ii) There is a tendency to perform targeted cyber and physical attacks. iii) Isolation from the internet is not an effective defense, and all power systems that are controlled by software are vulnerable to cyber threats. iv) Terrorists and war fighters recognized that it is more ef-fective to attack ICT infrastructures directly, than to physically attack their targets (Chen and Saeed 2011), (Trevorrow, et al. 2006).
Therefore, in order to study the interdependencies and vulnerabilities of Power Systems, it is important to identify the main threats for ICT and how they can affect the Power System.
In the ICT domain, information security is the process of defending information from unauthor-ized access, use, and modification. Its main objectives, according to the ANSSIviii are (ANSSI 2010):
Ensure the availability of data and information systems, i.e. information is available when it is needed;
Guarantee the integrity of information systems, i.e. originally sent information must stay unaltered;
Make sure that the data remains confidential, i.e. only authorized persons have access to the information;
Create practices to differentiate between legitimate and illegitimate users, i.e. Authenticity; Control the changes effectuated on information and trace the person that did the changes,
i.e. Traceability.
These objectives can be applied as well for Power Systems. Four cases show the criticality of these properties:
Availability: The regional control center requests load information to feed the state estima-tor, but this information is unavailable due to a Trojan that attacked the EMS (Santamarta 2011).
Integrity: An intruder changes the values of currents on power lines (virtually). Operators read on HMIs that the main transmission lines are overloaded, thus they decide to start the load shedding procedure, affecting the normal network condition (Liu, et al. 2012).
Confidentiality: A terrorist group steals sensitive documents from energy companies to plan a massive attack (Karpersky Laboratory 2012).