Estimation of dabigatran plasma concentrations in the perioperative
setting
An ex vivo study using dedicated coagulation assays
Jonathan Douxfils1*; Sarah Lessire1,2*; Anne-Sophie Dincq2; Paul Hjemdahl3; Yuko Rönquist-Nii3; Anton Pohanka3;
Maximilien Gourdin2; Bernard Chatelain4; Jean-Michel Dogné1; François Mullier1,4
1Department of Pharmacy, Namur Thrombosis and Hemostasis Center (NTHC), Namur Research Institute for LIfe Sciences (NARILIS), University of Namur, Belgium; 2Department of
Anaesthesiology, Namur Thrombosis and Hemostasis Center (NTHC), Namur Research Institute for LIfe Sciences (NARILIS), CHU Dinant Godinne UcL Namur, Université Catholique de Louvain, Belgium; 3Department of Clinical Pharmacology, Karolinska University Hospital and Clinical Pharmacology Unit, Department of Medicine Solna, Karolinska Institutet,
Stockholm, Sweden; 4Haematology Laboratory, Namur Thrombosis and Hemostasis Center (NTHC), Namur Research Institute for LIfe Sciences (NARILIS), CHU Dinant Godinne UcL
Namur, Université Catholique de Louvain, Belgium
Summary
The perioperative management of dabigatran is challenging, and rec-ommendations based on activated partial thromboplastin time (aPTT) and thrombin time (TT) are unsatisfactory. Dedicated coagulation tests have limitations at plasma concentrations < 50 ng/ml. Therefore, a more sensitive test, which is available 24/7, is required. It was our aim to investigate the performance of the Hemoclot Thrombin In-hibitors® LOW (HTI LOW) kit, a diluted thrombin time, and the STA® –
ECA II(ECA-II) kit, a chromogenic variant of the ecarin clotting time, that were developed to measure low dabigatran concentrations, com-pared to reference dabigatran analysis by liquid chromatography tan-dem mass-spectrometry (LC-MS/MS). This study included 33 plasma samples from patients treated with dabigatran etexilate who had plasma concentrations < 200 ng/ml. HTI LOW and ECA-II were per-formed along with HTI, aPTT (STA®-C. K.Prest® and SynthasIL®) and TT
(STA® – Thrombin). All procedures were performed according to
rec-ommendations by the manufacturers. Linear (or curvilinear) corre-lations and Bland-Altman analyses were calculated. For free dabi-gatran concentrations < 50 ng/ml, the R2 of linear correlations were
0.69, 0.84 and 0.61, with HTI, HTI LOW and ECA-II, respectively. The R2
for TT, STA®-C. K.Prest® and SynthasIL® were 0.67, 0.42 and 0.15. For
HTI, HTI LOW and ECA-II, Bland-Altman analyses revealed mean dif-ferences of –6 ng/ml (95 %CI: –25–14 ng/ml), 1 ng/ml (95 %CI: –18–19 ng/ml) and –1 ng/ml (95 %CI: –25–23 ng/ml), demonstrating that tests dedicated to measuring low concentrations are more accu-rate than HTI. In conclusion, the use of HTI LOW or ECA-II to assess low plasma dabigatran concentrations is supported by our findings.
Keywords
Dabigatran, monitoring, perioperative, guidelines
Correspondence to: Jonathan Douxfils Department of Pharmacy
Namur Thrombosis and Hemostasis Center (NTHC) Namur Research Institute for LIfe Sciences (NARILIS) University of Namur, B-5000, Belgium
E-mail: [email protected]
Received: September 30, 2014
Accepted after major revision: November 7, 2014 Epub ahead of print: December 18, 2014 http://dx.doi.org/10.1160/TH14-09-0808 Thromb Haemost 2015; 113: ■■■
* These authors contributed equally.
Introduction
Pradaxa® (Boehringer Ingelheim, Ingelheim, Germany), dabigatran
etexilate, has received its market authorisation for various indi-cations worldwide and was developed and marketed to be used in fixed dose regimens without a need for regular monitoring. How-ever, assessments of drug plasma levels are desired to ensure a safe use of the product in several specific situations (1). In this context, the perioperative management of dabigatran is quite challenging, es-pecially in the absence of a specific reversal agent. During the two years of follow-up in the RE-LY study, approximately 25 % of the pa-tients underwent at least one invasive procedure. Compared with warfarin, dabigatran is associated with a similar rate of perioperative bleeding and thrombotic complications, even among patients
hav-ing major or urgent surgery (2). However, in patients who had treat-ment withdrawn > 3 days before the intervention dabigatran was as-sociated with more bleeds, perhaps at least in part due to accumu-lation of the drug in patients with poor renal function. Furthermore, the equality of outcomes should be viewed in relation to how warfa-rin-related bleeds or risk of bleeding were handled in the study. Thus, vitamin K was given perioperatively to fewer than 5 % of war-farin-treated patients. Fresh-frozen plasma was given to 2 %, and prothrombin complex concentrate treatment was apparently not used at all. The comparison of bleeding problems might have been less favourable for dabigatran if patients taking warfarin would more often have received treatments that are recommended by expert opinion and guidelines (3). This underlines the necessity to imple-ment risk minimisation strategies in the perioperative manageimple-ment
of dabigatran in absence of specific antidote, especially for high-risk surgery, e. g. major interventions or neurosurgery.
In the initial assessment report of the European Medicines Agency (EMA), the marketing authorisation holder informed that a dabigatran concentration below 48 ng/ml is equivalent to elimin-ation of at least 75 % of dabigatran and should be reached before invasive intervention (4)... The “Groupe d’Intérêt en Hémostase Périopératoire (GIHP)” is much more conservative and put the threshold at 30 ng/ml (5). A diluted Thrombin Time (dTT, i. e. the Hemoclot Thrombin Inhibitors®, Hyphen BioMed,
Neuville-Sur-Oise, France) has been proposed for accurate determinations of dabigatran in plasma, but this test was not intended for measure-ments of low levels of dabigatran (6). Other studies have assessed the performance of this test, but also of a chromogenic variant of the well-established ecarin clotting time (7). Both tests had lower limits of quantitation between 30 and 50 ng/ml (8–11). Therefore, a specific laboratory test, which is accurate in the low concen-tration range and available 24/7, is highly requested. So far, most routine coagulation tests for assessments of dabigatran concen-trations or effects in the lower concentration range have been too insensitive. This limits their usefulness in the perioperative setting, and the use of the undiluted thrombin time test (TT) is currently presented as an alternative due to its very high sensitivity to dabi-gatran (12–14). This approach, although interesting, has some limitations because TT is affected by several analytical and biologi-cal variables making its standardisation difficult (15).
In this study, we investigated the performance of two coagu-lation tests specifically developed for measurements of low plasma dabigatran concentrations (the Hemoclot Thrombin Inhibitors®
LOW (HTI LOW), a diluted thrombin time (Hyphen BioMed®)
and the STA®-ECA II (ECA-II), a chromogenic variant of the
eca-rin clotting time (Diagnostica Stago®, Asnière-sur-Seine, France))
and to compare their results to direct measurements by a reference liquid chromatography coupled with a tandem mass-spectrometry (LC-MS/MS) method (9). We also assessed the performances of the standard procedure of HTI (Hyphen BioMed®) and the
acti-vated partial thromboplastin time (aPTT), which are recom-mended in the EMA documents (4, 16), as well as of the TT.
Materials and methods
The study was performed in accordance with the Declaration of Helsinki and was approved by the Medical Ethics Committee of the Centre Hospitalier Universitaire Dinant Godinne UcL Namur in Yvoir, Belgium. Written informed consent was obtained from each donor.
Clinical samples and normal pooled plasma
Thirty-three plasma samples from patients treated with dabigatran etexilate for stroke prevention in non-valvular atrial fibrillation were included in the study. Blood was taken by venipuncture in the antecubital vein and collected into 0.109 M sodium citrate (9:1 v/v) tubes (Venosafe®, Terumo, Heverlee, Belgium) using a
21-gauge needle (Terumo). Platelet-poor plasma (PPP) was ob-tained from the supernatant fraction after double centrifugation for 15 minutes (min) at 1500g at room temperature. Afterwards, plasma was aliquoted and frozen at –80 °C without delay. Frozen plasma samples aliquots were thawed and heated to 37 °C for at least 5 min just before experiments. Plasma samples were taken randomly and included in this study after a first assessment of plasma dabigatran concentrations using the HTI to select samples with plasma concentrations < 200 ng/ml. The exact plasma level of dabigatran was measured using a reference LC-MS/MS method, as described below (9).
Normal pooled plasma (NPP) was obtained from the PPP of 27 healthy individuals which was prepared as for the clinical samples. The exclusion criteria for the healthy individuals were: thrombotic and/or haemorrhagic events, pregnancy, and use of antiplatelet and/or anticoagulant medication and/or drugs potentially affect-ing platelet and/or coagulation factor functions duraffect-ing two weeks prior to sampling.
Liquid chromatography coupled with tandem mass spectrometry
This method has been described previously (9). Briefly, plasma concentrations of free dabigatran were determined after sample preparation by protein precipitation of 50 µL citrated plasma with 150 µL acetonitrile containing dabigatran-d3 as an internal stan-dard. The calibration curve for dabigatran in plasma was linear over the range 1–400 ng/ml and the limit of detection (LOD) was estimated to be < 0.5 ng/ml. Validation experiments with three lev-els of control samples (8.1, 202 and 393 ng/ml) on three different occasions (six determinations per concentration), showed an inter- and intra-assay precision between 6.0 % and 9.2 % and be-tween –0.9 % and 3.6 %, respectively.
Coagulation assays
For the ordinary HTI assay, a diluted thrombin time (dTT), the tested plasma was diluted 1:8 in Owren-Koller® buffer. Fifty µl of
diluted plasma were mixed with 100 µl of NPP and were incubated during 240 seconds (sec). One hundred µl of highly purified human thrombin, in the α-form pre-incubated at 37 °C was then added to start the reaction. The procedure was calibrated with a 3-calibrators kit at 35, 240 and 470 ng/ml (Hyphen BioMed®). For
HTI LOW, the methodology of the test was the same (i. e. it used the same reagent than HTI) except that 1) the dilution of the sample was reduced to 1:2 compared to 1:8 for the normal pro-cedure, and that 2) specific calibrators (and controls) at lower con-centrations (0, 57 and 110 ng/ml) were required (Hyphen BioMed®) to establish a new calibration curve. All calibrations were
defined by linear correlation.
For ECA-II, the tested plasma was diluted 1:5 in Owren-Koller®
buffer. Fifty µl of diluted plasma were mixed with 140 µl of pro-thrombin and then 70 µl of chromogenic substrate were added and incubated during 240 sec. Seventy µl of ecarin, pre-incubated at 37 °C, was then added to start the reaction. Optical density was
fol-lowed during 40 sec (from 70 to 110 sec after ecarin addition) and the result was expressed as the difference of OD/min. The procedure was calibrated with a 5-calibrator kit at 0, 50, 96, 177 and 240 ng/ml (Diagnostica Stago®) and results were fitted by an exponential decay
equation model. For results above 230 ng/ml, the ECA-II proposed an automatic re-dilution of the sample (1:10 instead of 1:5).
Thrombin Time (TT), using STA®-Thrombinat 1.5 NIH units/
ml, with an upper limit of measurement (ULM, i. e. the maximal clotting time for which the coagulometer provides a numerical re-sult) extended to 300 sec (Diagnostica Stago®; NPP baseline
clot-ting time: 16.8 sec; standard deviation: 0.3 sec; local acceptable range: 13.5–20.5 sec) and the activated partial thromboplastin time (aPTT), using STA®-C. K.Prest® (Diagnostica Stago®; NPP
baseline clotting time: 30.3 sec; standard deviation: 0.2 sec; accept-able range: 26.4–37.6 sec) and SynthasIL® (Instrumentation
Lab-oratory®; NPP baseline clotting time: 31.4 sec; standard deviation:
0.2 sec; local acceptable range 26.0–38.0 sec) reagents were also measured to compare the performance of each of these tests in presence of low concentrations of dabigatran.
All procedures were performed on a STA-R Evolution®
coagulo-meter (Diagnostica Stago®), according to the recommendations of
the manufacturers.
Statistical analyses
Statistical analyses were performed using GraphPad Prism version 5.00 (GraphPad Software, San Diego CA, USA, www.graphpad. com) for Windows. Results for coagulation tests expressed in ng/ ml were compared to the LC-MS/MS method by linear regression. Bland-Altman analyses were also performed and were calculated as follows: Difference (A-B)/average, where A was the result of the corresponding coagulation test and B, the result of the LC-MS/MS.
Thrombin time showed a linear regression while aPTT is better fitted by a curvilinear (first-order) relation described by the fol-lowing model: Y=Y0 + (Plateau-Y0)*(1-exp(-K*x)).
Sensitivity was defined as the concentration in dabigatran in the original sample required to double the clotting time or halve the optical density per min (OD/min). For the coagulation assays, the lower limit of detection (LOD) and the lower limit of quanti-tation (LOQ) were calculated as follows: LOD = [(3*standard devi-ation of Y0)/ slope] and LOQ = [(10*standard devidevi-ation of Y0/ slope]. The standard deviation of Y0 was calculated by running the tests 10 times with NPP.
Median
Range (min – max) Median
Range (min –max) Median
Range (min – max) Median
Range (min – max) Median
Range (min – max) Median
Range (min – max)
HTI: Hemoclot Thrombin Inhibitors®; LC-MS/MS: Liquid chromatography coupled with tandem mass-spectrometry.
LC-MS/MS (in ng/ml)
Time elapsed since the last dose: 0 hours† (n=2) 0
0 to 0
Time elapsed since the last dose: 2 hours (n=4) 133
65 to 185
Time elapsed since the last dose: 3 hours (n=4) 125
49 to 200
Time elapsed since the last dose: 12 hours (n=5) 76
52 to 88
Time elapsed since the last dose: 20 hours (n=8) 41
0 to 76
Time elapsed since the last dose: Unknown (n=10) 9 0 to 40 HTI (in ng/ml) 0 0 to 0 122 64 to 191 119 68 to 194 46 22 to 83 17 0 to 56 0 0 to 30 HTI LOW (in ng/ml) 0 0 to 0 138 87 to 168 132 79 to 179 76 61 to 103 42 0 to 95 1 0 to 41 STA®-ECA-II (in ng/ml) 0 0 to 0 153 77 to 204 146 77 to 161 83 65 to 118 34 0 to 83 8 0 to 37 STA®-Thrombin (in sec) 18.8 18.6 to 19.0 229.2 18.1 to M>MMax‡ 235.4 215.5 to 292.5 157.8 103.3 to 233.5 91.7 19.9 to 189.2 26.5 16.7 to 80.2 SynthasIL® (in sec) 31.7 31.5 to 31.8 56.8 32.6 to 59.3 51.1 42.1 to 57.7 48.2 38.3 to 56.5 39.5 24.8 to 52.5 32.0 21.9 to 55.2 STA®-C. K.PREST® (in sec) 32.5 27.5 to 37.5 52.9 27.5 to 56.9 48.3 42.2 to 57.1 42.9 38.7 to 54.6 40.4 24.2 to 46.5 28.7 22.7 to 35.5
Table 1: Median plasma drug concentrations according to the time elapsed since dabigatran etexilate administration. Two hours and 3 hours correspond to the expected Cmax of the drug while 12 hours
corresponds to the Cmin. Plasma samples taken more than 20 hours
after the last intake of dabigatran etexilate were grouped together.
For 11 samples, the exact time elapsed since the last intake was un-known. † 0 hours correspond to baseline value (before the first intake of
dabigatran etexilate). ‡ M>MMax means that the upper limit of
Results
The plasma concentration range of free dabigatran was from 0 to 200 ng/ml according to LC-MS/MS measurements.
▶
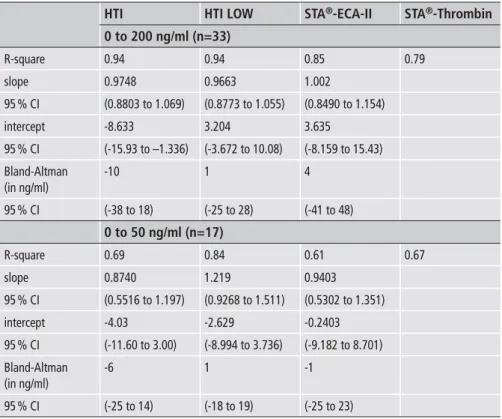
Table 1 sum-marises data on plasma drug concentrations according to the time elapsed since dabigatran etexilate administration. Among these samples, 17 were between 0 and 50 ng/ml. For assays that express re-sults in ng/ml (i. e. HTI, HTI LOW and ECA-II) the linear corre-lation parameters and the Bland-Altman analyses vs exact plasma concentrations are provided in▶
Table 2 and represented in▶
Fig-ure 1 for concentrations between 0 and 200 ng/ml. A stratification for results between 0 and 50 ng/ml is also provided in the same table and figure.▶
Figure 2 shows the results for TT and aPTT.Linear and curvilinear correlations
For concentrations between 0 and 200 ng/ml, the R2 of the linear
correlations were 0.94, 0.94 and 0.85 for HTI, HTI LOW and ECA-II, respectively. For STA®-Thrombin, the R2 of the linear
corre-lation was 0.79 and the clotting time ranged from 16.7 to 292.5 sec. For aPTT, the R2 were 0.62 and 0.43 for STA®-C. K.Prest® and
Syn-thasIL®, respectively. The clotting times ranged from 22.7 to 57.1
sec for STA®-C. K.Prest® and from 21.9 to 59.3 sec for SynthasIL®.
For concentration below 50 ng/ml, the R2 of the linear
corre-lations were 0.69, 0.84 and 0.61 for HTI, HTI LOW and ECA-II, respectively. The R2 of the linear correlation for TT was 0.67 and
the longest clotting time for this range of concentrations was 248.7 sec for a sample with 49 ng/ml. For aPTT, linear correlation R2
values of 0.42 and 0.15 were found for STA®-C. K.Prest® and
Syn-thasIL®, respectively. The highest clotting times in this
concen-tration range were 57.1 and 57.7 sec for STA®-C. K.Prest® and
Syn-thasIL® for the sample with a plasma concentration of 49 ng/ml.
Bland-Altman analyses
For concentration between 0 and 200 ng/ml, the Bland-Altman analysis showed a mean difference of –10 ng/ml (95 % confidence interval [CI]: –38 to 18 ng/ml), 1 ng/ml (95 %CI: –25 to 28 ng/ml) and 4 ng/ml (95 %CI:-41 to 48 ng/ml) for HTI, HTI LOW and ECA-II, respectively.
For concentration below 50 ng/ml, the Bland-Altman analysis showed a mean difference of –6 ng/ml (95 %CI: –25 to 14 ng/ml), 1 ng/ml (95 %CI: –18 to 19 ng/ml) and –1 ng/ml (95 %CI:-25 to 23 ng/ml) for HTI, HTI LOW and ECA-II, respectively.
Sensitivity and limits of detection/quantitation
The concentrations of dabigatran in the sample required to double the clotting time of HTI, HTI LOW, TT, aPTT (STA®-C. K.Prest®) and
aPTT (SynthasIL®) were 298, 67, 6, 585 and 551 ng/ml, respectively.
For ECA-II, the concentration of dabigatran required to halve the DO/min was 102 ng/ml. The LOD and LOQ were 8 and 25, respect-ively, for HTI compared to 2 and 7 ng/ml for HTI LOW. For ECA-II the entire calibration curve is not defined by a linear correlation but by a second order polynomial relation. Therefore, we took only the three first points of the calibration curve, i. e. 0, 50 and 96 ng/ml, to calculate the LOD and LOQ for ECA-II. These three points were well defined by a linear correlation model (R2 = 1.00). The LOD and LOQ for
ECA-II in this concentration range were 14 and 46 ng/ml while for TT, the LOD and LOQ were 1 and 2 ng/ml, respectively.
R-square slope 95 % CI intercept 95 % CI Bland-Altman (in ng/ml) 95 % CI R-square slope 95 % CI intercept 95 % CI Bland-Altman (in ng/ml) 95 % CI HTI 0 to 200 ng/ml (n=33) 0.94 0.9748 (0.8803 to 1.069) -8.633 (-15.93 to –1.336) -10 (-38 to 18) 0 to 50 ng/ml (n=17) 0.69 0.8740 (0.5516 to 1.197) -4.03 (-11.60 to 3.00) -6 (-25 to 14) HTI LOW 0.94 0.9663 (0.8773 to 1.055) 3.204 (-3.672 to 10.08) 1 (-25 to 28) 0.84 1.219 (0.9268 to 1.511) -2.629 (-8.994 to 3.736) 1 (-18 to 19) STA®-ECA-II 0.85 1.002 (0.8490 to 1.154) 3.635 (-8.159 to 15.43) 4 (-41 to 48) 0.61 0.9403 (0.5302 to 1.351) -0.2403 (-9.182 to 8.701) -1 (-25 to 23) STA®-Thrombin 0.79 0.67
Table 2: Summary of results obtained with the different analyses as related to direct measurements of dabigatran in plasma by LC-MS/MS. Results are given for the linear regression (R2, slope, intercept) and the Bland-Altman analyses. Results are also stratified for dabigatran concentrations up to 200 ng/mL and < 50 ng/mL.
Discussion
Currently, there is no clear consensus regarding the perioperative management of patients treated with dabigatran etexilate, es-pecially not among patients with impaired renal function in whom longer time periods are required to eliminate the drug (17). While several authors recommend the use of a dTT, such as HTI, or an aPTT in the perioperative context (18, 19), their insufficient
sensi-tivity (8–11) limits their utility in patients with low plasma levels of dabigatran (15, 20). The inaccuracy of HTI at low concentrations may not change the clinical outcomes in invasive interventions with low bleeding risk. However, in connection with high-risk sur-gery, such as neurosursur-gery, a more accurate assessment may be needed and risk minimisation strategies should be provided.
Thrombin time is an alternative in this context due to its very high sensitivity towards dabigatran (21). However, it is influenced Figure 1: Results of the linear correlation (A) and the Bland-Altman
analyses for the entire concentration range (B) for HTI, HTI LOW and ECA-II compared to LC-MS/MS. C) Bland-Altman analyses were also
extracted for concentration specifically < 50 ng/ml. Bland-Altman analyses
were calculated as follow: Difference (A-B)/average, where A was the result of the corresponding coagulation test and B, the result of the LC-MS/MS. HTI: Hemoclot Thrombin Inhibitors® – HTI LOW: Hemoclot Thrombin Inhibitors® – ECA-II: STA®-ECA II.
Figure 2: Results of the linear correlation for TT (STA®-Thrombin at 1.5 NIH/ml; NPP
baseline clotting time: 16.8 sec; SD: 0.3 sec; acceptable range: 13.5–20.5 sec) and the curvilinear correlation for aPTT
(STA®-C. K.Prest®; NPP baseline clotting
time: 30.3 sec; standard deviation: 0.2 sec; acceptable range: 26.4–37.6 sec and Syn-thasIL®; NPP baseline clotting time: 31.4
sec; SD: 0.2 sec; acceptable range 26.0–38.0 sec), respectively.
by several biological and analytical variables (22). Thus, up to now, anaesthetists, surgeons and doctors involved in critical care units are so far ill-equipped to cope with situations requiring accurate evaluations of residual dabigatran effects and/or plasma concen-trations and a specific laboratory test which is accurate in the low concentration range and available 24/7 is highly requested.
Performance of dedicated coagulation tests compared to global ones
Our results show that HTI LOW performs better than HTI and ECA-II in the concentration range assessed in this study, i. e. from 0 to 200 ng/ml. It provides a steeper correlation compared with ECA-II and a lower systematic difference compared to LC-MS/MS with a narrower 95 % confidence interval (
▶
Table 2). However, ECA-II provides less systematic deviation than HTI (4 ng/ml vs –10 ng/ml) for assessments of plasma concentrations in the 0–200 ng/ml range. For concentrations below 50 ng/ml, HTI LOW corre-lates better with LC-MS/MS than HTI or ECA-II, which were equivalent at these low concentrations. Regarding the systematic deviation, both HTI LOW and ECA-II performed very well with a small preference for HTI LOW due to a narrower 95 % CI.Regarding sensitivity, HTI LOW was the most sensitive assay followed by ECA-II and HTI. Surprisingly, ECA-II did not per-form better than previously shown for the “non-dedicated” meth-odology (10, 11). However, both HTI LOW and ECA-II reflect plasma dabigatran concentrations < 50 ng/ml reasonably well with a slight preference for HTI LOW due to narrower confidence in-tervals. However, HTI LOW requires a new calibration curve and a new set of controls which further increases the turn-around time in an emergency situation. This is not required for ECA-II which directly introduces a calibration curve for the low concentrations and an automatic re-dilution of the sample if the result exceeds 230 ng/ml. However, if the test is already calibrated on the coagu-lometer, our proposal for sample management (see below) can re-duce the turn-around time by choosing directly the right pro-cedure to use between HTI and HTI LOW.
As expected, the lowest LOD and LOQ were obtained with TT, i. e. 1 and 2 ng/ml, respectively. With the normal procedure (with an upper limit of measurement (ULM) of 120 sec with STA®-Thrombinat 1.5 NIH units/ml on a STA-R Evolution®
coagu-lometer), concentrations above 50 ng/ml frequently exceed the ULM making the evaluation of the degree of anticoagulation im-possible. For example, in our study, one sample with 49 ng/ml dabigatran gave a TT of 248.7 sec while in another sample, TT reached 86.2 sec for a plasma concentration of dabigatran of 54 ng/ ml (
▶
Figure 2). Thus, thrombin time may be less useful than dedicated assays to provide estimates of dabigatran effects. Initial recommendations on the periprocedural management of patients taking dabigatran etexilate stated that a normal aPTT indicated the absence of a significant dabigatran effect. It was also recom-mended that surgery should be delayed for ≥ 1 half-life after the last dose of dabigatran or until the aPTT is normal or “near nor-mal” (19). However, aPTT reacts differently depending on reagents, coagulometers and their combinations, and a normalaPTT may be found in the presence of therapeutic dabigatran con-centrations making these recommendations too simplistic (13, 23, 24). In the present study, one sample was within the normal range of the STA-C. K.Prest® (35.5 sec; normal range: 26.4 to 37.6 sec)
and SynthasIL® (32.1 sec; normal range: 26 to 38 sec), despite a
dabigatran concentration of 40 ng/ml. Two samples exhibited nor-mal Synthasil® and STA®-C. K.Prest® values despite concentrations
of 76 and 34 ng/ml, respectively. Thus, the aPTT alone is not re-liable and decisions based on aPTT should be avoided. Dedicated coagulation tests should be preferably used to guide the perioper-ative management. In the absence of dedicated coagulation tests, the aPTT may be used but, only concomitantly with the TT, as proposed previously (21, 22).
Proposal for sample management
The laboratory can be guided by TT regarding which dedicated coagulation assay to use. We propose the following approach for the rational management of plasma samples from patients on dabigatran etexilate: For TT that exceeds the ULM (i. e. a TT < 120 sec or ± 6 times the upper limit of normal on a STA-R Evolution®
coagulometer using the recommendations of the manufacturer), we propose the use of the standard HTI assay which has demon-strate a sufficient accuracy in estimating plasma concentrations of dabigatran above 50 ng/ml (6, 9–11). Following our experiments, if TT is between the baseline clotting time and the ULM, a dedi-cated method should be employed. The HTI LOW or the ECA-II assays both provide good estimates of the plasma concentrations but HTI LOW seems to be more accurate thanks to narrower CI. This simple paradigm may avoid unnecessary costs and ensure the best estimation of the plasma concentrations when required, e. g. in the perioperative setting.
Bridging therapy? The advantage of generating meizothrombin
A recent prospective and non-interventional registry revealed that heparin bridging did not reduce cardiovascular events in the peri-operative context but lead to a significantly higher rate of major bleedings. However, the use of heparin bridging increased with the severity of the procedure (30 % of patients in this registry received heparin bridging compared with 16 % in the RE-LY analysis). The authors conclude that patients at cardiovascular risk who need to undergo major procedures may benefit from heparin bridging (25). In case of heparin bridging, the anticoagulant effect is tran-siently affected by low-molecular-weight heparins to the effect of dabigatran. Despite being less accurate than HTI LOW, one of the main advantage of ecarin based assays is that in case of switching or bridging therapy, meizothrombin, i. e. the intermediate product released by ecarin from prothrombin, is unaffected by the presence of heparin and derivatives. This allows an accurate assessment of the direct thrombin inhibitor in plasma. This was demonstrated in one of our patients who was bridged from dabigatran etexilate to enoxaparin. While LC-MS/MS and ECA-II revealed no residual dabigatran in plasma (0 ng/ml) the HTI LOW assay yielded a
dabigatran plasma concentration of 8 ng/ml. The TT and the Syn-thasIL® were 53.9 and 52.9 sec, respectively. Thus, HTI LOW may
be influenced by the presence of heparin or LMWH and labora-tory tests should be interpreted in conjunction with the clinical history. Another advantage of the ECA-II method is that the user must not choose between a “LOW” or a “normal” procedure since the test is intended to perform both by itself on a Stago® platform.
However, this is at the expense of higher reagent consumption.
Limitations
Our study has some limitations. First, the LC-MS/MS method pro-posed in this study only measured free dabigatran and does not in-clude the conjugated form. However, the latter only contributes approximately to 20 % of the total dabigatran in plasma and is most likely of minimal importance at these low concentrations of dabigatran (15, 26). The second limitation concerns the low number of samples assessed that did not allow us to provide strong recommendations on whether HTI LOW or ECA-II should be used at the lowest plasma concentrations. Nevertheless, Bland-Alt-man analyses revealed that both HTI LOW and ECA-II perform better than HTI in the concentration range tested in this study and that they should be preferred to the standard procedure of HTI for evaluations of assess plasma concentrations between 0 and 50 ng/ ml. This single-centre pilot study with a small patient material was not designed and powered to address clinical outcomes. Conse-quently, the implementation of a second-tier assay for dabigatran testing in routine practice should be further investigated to con-firm clinical benefits in a large, multicentric study.
Conclusions
So far, TT has been the only functional test sufficiently sensitive to guide the management of patients in the perioperative context since both the Hemoclot Thrombin Inhibitors® (HTI) and the
Eca-rin Chromogenic Assay (ECA) showed weak performances when assessing low dabigatran concentrations. Measurements of such low plasma concentrations may have clinical implications for high-risk surgery, and dedicated coagulation tests are therefore required. The HTI LOW and the ECA-II assays, specifically adapted to evaluate low dabigatran concentrations, performed well with dabigatran concentrations in plasma < 50 ng/ml. We there-fore recommended the use of HTI LOW or ECA-II to assess the plasma concentrations when they are suspected to be low, such as those encountered in the perioperative context. HTI LOW seems to be more accurate due to a narrower confidence interval but this should be confirmed in a larger study. However, screening of such samples by TT may be useful when choosing dedicated coagu-lation tests in order to avoid unnecessary costs and ensure the best estimation of dabigatran plasma concentrations, when required. The clinical benefit of such a procedure should be confirmed in a large multicentric study that addresses its impact on clinical out-comes.
Acknowledgements
The authors would like to thank Mrs. Justine Baudar, Mr. Philippe Devel and Mr. Sébastien Walbrecq for their contributions to this work. The authors would also like to thank Hyphen BioMed® and
Diagnostica Stago® for supplies of reagents.
Conflicts of interest None declared.
References
1. Ten Cate H. New oral anticoagulants: discussion on monitoring and adherence should start now! Thromb J 2013; 11: 8.
2. Healey JS, Eikelboom J, Douketis J, et al. Periprocedural bleeding and throm-boembolic events with dabigatran compared with warfarin: results from the Randomized Evaluation of Long-Term Anticoagulation Therapy (RE-LY) ran-domized trial. Circulation 2012; 126: 343–348.
3. Hjemdahl P, Johnsson H, Wallen NH. Letter by Hjemdahl et al regarding article, „Periprocedural bleeding and thromboembolic events with dabigatran com-pared with warfarin: results from the Randomized Evaluation of Long-Term Anticoagulation Therapy (RE-LY) Randomized Trial“. Circulation 2013; 127: e505.
4. European Medicines Agency. Pradaxa – EMEA/H/C/000829/X/13/G. 2011 Jun 9 [cited 2014 Jul 17]; Available from: http://www.ema.europa.eu/docs/en_GB/ document_library/EPAR_-_Assessment_Report_-_Variation/human/ 000829/WC500110875.pdf
5. Pernod G, Albaladejo P, Godier A, et al. Management of major bleeding compli-cations and emergency surgery in patients on long-term treatment with direct oral anticoagulants, thrombin or factor-Xa inhibitors: proposals of the working
What is known about this topic?
•
The perioperative management of dabigatran is quite challenging especially in the absence of a specific reversal agent, and possibil-ities to evaluate the intensity of the treatment are therefore valu-able.•
The use of dTT or an aPTT has been recommended in the perioper-ative context, but their insufficient sensitivity limits their utility in patients with low plasma levels of dabigatran.•
Thrombin time is an alternative in this context due to its very high sensitivity, but it is influenced by several biological and analytical variables.What does this paper add?
•
The performance of two coagulation tests specifically developed for measurement of low plasma dabigatran concentrations (the Hemoclot Thrombin Inhibitors® LOW and the STA®-ECA II wasas-sessed and compared to direct measurements by a reference LC-MS/MS method.
•
The HTI LOW and the ECA-II assays, specifically adapted to evalu-ate low dabigatran concentrations, performed well with dabi-gatran concentrations in plasma < 50 ng/ml.•
Screening by the thrombin time test may be useful in choosing the dedicated coagulation tests (i. e. HTI or HTI LOW/ECA-II) in order to avoid unnecessary costs.group on perioperative haemostasis (GIHP) – March 2013. Arch Cardiovasc Dis 2013; 106: 382–393.
6. Stangier J, Feuring M. Using the HEMOCLOT direct thrombin inhibitor assay to determine plasma concentrations of dabigatran. Blood Coagul Fibrinol 2012; 23: 138–143.
7. Lange U, Nowak G, Bucha E. Ecarin Chromogenic Assay – A New Method for Quantitative Determination of Direct Thrombin Inhibitors Like Hirudin. Pa-thophysiol Haemost Thromb 2003; 33: 184–191.
8. Gosselin RC, Dwyre DM, Dager WE. Measuring dabigatran concentrations using a chromogenic ecarin clotting time assay. Ann Pharmacother 2013; 47: 1635–1640.
9. Douxfils J, Dogne JM, Mullier F, et al. Comparison of calibrated dilute thrombin time and aPTT tests with LC-MS/MS for the therapeutic monitoring of patients treated with dabigatran etexilate. Thromb Haemost 2013; 110: 543–549. 10. Antovic JP, Skeppholm M, Eintrei J, et al. Evaluation of coagulation assays
ver-sus LC-MS/MS for determinations of dabigatran concentrations in plasma. Eur J Clin Pharmacol 2013; 69: 1875–1881.
11. Hawes EM, Deal AM, Funk-Adcock D, et al. Performance of coagulation tests in patients on therapeutic doses of dabigatran: a cross-sectional pharmacody-namic study based on peak and trough plasma levels. J Thromb Haemost 2013; 11: 1493–1502.
12. van Ryn J, Stangier J, Haertter S, et al. Dabigatran etexilate--a novel, reversible, oral direct thrombin inhibitor: interpretation of coagulation assays and reversal of anticoagulant activity. Thromb Haemost 2010; 103: 1116–1127.
13. Douxfils J, Mullier F, Robert S, et al. Impact of dabigatran on a large panel of routine or specific coagulation assays. Laboratory recommendations for moni-toring of dabigatran etexilate. Thromb Haemost 2012; 107: 985–997.
14. Chin PK, Wright DF, Patterson DM, et al. A proposal for dose-adjustment of dabigatran etexilate in atrial fibrillation guided by thrombin time. Br J Clin Pharmacol 2014; 78: 599–609.
15. Skeppholm M, Hjemdahl P, Antovic JP, et al. On the monitoring of dabigatran treatment in „real life“ patients with atrial fibrillation. Thromb Res 2014; 134: 783–789.
16. European Medicines Agency. Pradaxa – Summary of Product Characteristics. 2014 Jul 17 [cited 2014 Jul 17]; Available from: http://www.ema.europa.eu/docs/
en_GB/document_library/EPAR_-_Product_Information/human/ 000829/WC500041059.pdf.
17. Ferrandis R, Castillo J, de Andres J, et al. The perioperative management of new direct oral anticoagulants: a question without answers. Thromb Haemost 2013; 110: 515–522.
18. Ortel TL. Perioperative management of patients on chronic antithrombotic therapy. Blood 2012; 120: 4699–4705.
19. Weitz JI, Quinlan DJ, Eikelboom JW. Periprocedural management and approach to bleeding in patients taking dabigatran. Circulation 2012; 126: 2428–2432. 20. Reilly PA, Lehr T, Haertter S, et al. The effect of dabigatran plasma
concen-trations and patient characteristics on the frequency of ischemic stroke and major bleeding in atrial fibrillation patients: the RE-LY Trial (Randomized Evaluation of Long-Term Anticoagulation Therapy). J Am Coll Cardiol 2014; 63: 321–328.
21. Hankey GJ. Unanswered questions and research priorities to optimise stroke prevention in atrial fibrillation with the new oral anticoagulants. Thromb Hae-most 2014; 111: 808–816.
22. Hapgood G, Butler J, Malan E, et al. The effect of dabigatran on the activated partial thromboplastin time and thrombin time as determined by the Hemoclot thrombin inhibitor assay in patient plasma samples. Thromb Haemost 2013; 110: 308–315.
23. Lindahl TL, Baghaei F, Blixter IF, et al. Effects of the oral, direct thrombin in-hibitor dabigatran on five common coagulation assays. Thromb Haemost 2011; 105: 371–378.
24. Van Blerk M, Bailleul E, Chatelain B, et al. Influence of dabigatran and riva-roxaban on routine coagulation assays. A nationwide Belgian survey. Thromb Haemost 2015; 113: 154-164.
25. Beyer-Westendorf J, Gelbricht V, Forster K, et al. Peri-interventional manage-ment of novel oral anticoagulants in daily care: results from the prospective Dresden NOAC registry. Eur Heart J 2014; 35: 1888–1896.
26. Stangier J, Rathgen K, Stahle H, et al. The pharmacokinetics, pharmacody-namics and tolerability of dabigatran etexilate, a new oral direct thrombin in-hibitor, in healthy male subjects. Br J Clin Pharmacol 2007; 64: 292–303.