RESEARCH OUTPUTS / RÉSULTATS DE RECHERCHE
Author(s) - Auteur(s) :
Publication date - Date de publication :
Permanent link - Permalien :
Rights / License - Licence de droit d’auteur :
Institutional Repository - Research Portal
Dépôt Institutionnel - Portail de la Recherche
researchportal.unamur.be
University of Namur
Are Stakeholders the Only Source of Information for Requirements Engineers? Toward
a Taxonomy of Elicitation Information Sources
Burnay, Corentin
Published in:
ACM Transactions on Management Information Systems
Publication date:
2016
Document Version
Peer reviewed version
Link to publication
Citation for pulished version (HARVARD):
Burnay, C 2016, 'Are Stakeholders the Only Source of Information for Requirements Engineers? Toward a Taxonomy of Elicitation Information Sources', ACM Transactions on Management Information Systems, vol. 7, no. 2.
General rights
Copyright and moral rights for the publications made accessible in the public portal are retained by the authors and/or other copyright owners and it is a condition of accessing publications that users recognise and abide by the legal requirements associated with these rights. • Users may download and print one copy of any publication from the public portal for the purpose of private study or research. • You may not further distribute the material or use it for any profit-making activity or commercial gain
• You may freely distribute the URL identifying the publication in the public portal ? Take down policy
If you believe that this document breaches copyright please contact us providing details, and we will remove access to the work immediately and investigate your claim.
1. INTRODUCTION
1.1. Context: Problems in Requirements Elicitation
Requirements Engineering (RE) is an activity in software, or more generally in sys-tems engineering, which consists in collecting, documenting and analyzing require-ments from some stakeholders toward a system-to-be, for the purpose of produc-ing specifications for that system [Zave and Jackson(1997); Nuseibeh and Easter-brook(2000); Pohl(2010)]. RE typically decomposes into a series of smaller, more clearly delimited activities, each one with its own purpose. Requirements elicitation (sim-ply elicitation hereafter) is one such activity, occurring early in the RE process, which focuses on collecting raw information about the expectations of stakeholders, and about the environment in which the system is going to operate [Nuseibeh and Easterbrook(2000); Zowghi and Coulin(2005); Podeswa(2009)]. Elicitation is often ac-knowledged as a highly critical and error-prone stage in the RE project [Coughlan et al.(2003)Coughlan, Lycett, and Macredie; Rajagopal et al.(2005)Rajagopal, Lee, Ahlswede, Chiang, and Karolak; Davey and Cope(2008)]. Among the various chal-lenges related to elicitation, one may cite for instance the problems of scope (collecting the correct amount of information), understanding (ensure the information is relevant) or volatility (ensuring the information will not change too frequently over time) [Mc-Dermid(1989); Christel and Kang(1992)]. Incompleteness and tacit knowledge have also proved to be important challenges during elicitation [Goguen and Linde(1993); Sutcliffe and Sawyer(2013); Burnay et al.(2014)Burnay, Jureta, and Faulkner]. To complete this list of elicitation challenges, the reader can refer to the various chal-lenges and early warning signs of projects failures listed in [Young(????); Tsumaki and Tamai(2006); Kappelman et al.(2006)Kappelman, McKeeman, and Zhang].
1.2. Problem: Insufficient Attention is Paid to Non-human Sources
As a way to manage the risk related to former challenges, significant research has been devoted in RE to the development of new models or techniques to help ana-lysts collect properly requirements [Christel and Kang(1992); Hickey and Davis(2004); Kujala et al.(2005)Kujala, Kauppinen, Lehtola, and Kojo; Zowghi and Coulin(2005); Sutcliffe and Sawyer(2013)]. Most (if not all) of these approaches are heavily ori-ented toward stakeholders; typically, researchers advocate the use of techniques such as interviews, workshops, surveys, card-sorting techniques, or ethnographic tech-niques such as introspection, observation, viewpoints, apprenticing, etc. [Goguen and Linde(1993); Sommerville et al.(1998)Sommerville, Sawyer, and Viller; Zowghi and Coulin(2005)]. Tremendous research has gone on the identification and selection of stakeholders against which such techniques should be applied [Pouloudi(1997); Sharp et al.(1999)Sharp, Finkelstein, and Galal; Glinz and Wieringa(2007); Ballejos and Montagna(2008)]. Recommendations are made in [Sommerville and Sawyer(1997)] about how to conduct proper elicitation; among other, it is suggested to “identify the people who will help specify requirements” and to “solicit participation from many peo-ple”. Significant effort has also been made to understand which techniques are the best to apply to some stakeholders [Hickey and Davis(2003); Tsumaki and Tamai(2006); Maiden and Rugg(1996)].
We see in previous works clear indications that stakeholders are perceived as a cen-tral source of information for business analysts during elicitation. While stakeholders represent an effective and significant source of information during elicitation, it is important to bear in mind that they are, as any human-being, fallible; there may be things they do not know, there may be things about which they are confident that in fact are not true, there may be things they tell to analysts which in fact are value judg-ment, etc. In other words, stakeholders are invaluable sources of information in RE,
but still sources that are not certain, exhaustive or even effective. This uncertainty may contribute to the elicitation challenges mentioned earlier, thereby decreasing the chances of success of the RE project. We found very few references in RE literature to elicitation techniques focusing explicitly on other sources than stakeholders; elicita-tion techniques suggested in RE make extensive use of stakeholders, and sometimes seem to overlook other sources of information that are available in the business, such as the existing IT documentation, management documentation, administrative docu-mentation, employment contracts, supplier contracts, market studies realized by the company, existing databases, etc.
1.3. Solution: Review Which Sources are Available in the Business
Our view on previous issue is that analysts should adopt more of a holistic view on the environment in which the system will operate, so as to ensure that information collected from stakeholders is consistent with that which can be collected from the en-vironment itself. One way to do so is to consider alternative sources of information, so as to make sure information elicited from stakeholders fit with other sources, to make sure no information has been omitted, to ensure the opinion of a person reflects the facts in the business, etc. In theory, this is a well accepted idea; humans (i.e., stake-holders) are likely not the only possible source of information. In [Jackson(1995)] for example, Jackson argues that requirements are in the environment, which is not solely composed of stakeholders. In [Zowghi and Coulin(2005)], authors argue there are many possible sources of requirements, including “the problem owners, the stakeholders, documentation, and other existing systems”. In [Nuseibeh and Easterbrook(2000)], it is explained that traditional elicitation techniques include the use of “questionnaires and surveys, interviews, and analysis of existing documentation such as organisational charts, process models or standards, and user or other manuals of existing systems. In [Schneider et al.(2008)Schneider, Stapel, and Knauss], a notation for visualizing the flows of formal and informal business documents is defined, thereby emphasizing the importance of non-human sources.
In theory therefore, there is agreement that stakeholders are one source of infor-mation, but not the only one source. Surprisingly, we found very little research about this very idea in practice. To the best of our knowledge, there is limited guidance of-fered to analysts about which other sources of information are accessible in a business, about whether/how existing elicitation techniques can be applied to elicit information from these sources, and about how information collected from stakeholders can be con-fronted to information collected from other sources. In other words, RE advocates to use sources other than stakeholders, yet gives few indications about how such sources can be identified and exploited for collecting relevant information. The present papers objective is to deal with the former gap; it aims to survey which sources of informa-tion - relevant to business analysts - there are in a business, and to investigate how these sources can be accessed and used to collect information. Ultimately, we believe such work might help analysts in dealing with the numerous elicitation challenges, and hence increase the chances of success of related RE projects.
1.4. Contribution: TELIS
The goal of the paper is to provide analysts with a tool to elicit information in a more systematic way, omitting fewer sources of information, and to raise questions about whether (and if so, how) existing elicitation techniques can be used to elicit informa-tion from such sources. The paper also aims to group the different sources of infor-mation into larger family sources, that we can then relate to research in RE; our goal in doing so is to make it clear where research is required so as to deal with the gap mentioned above. Our research question can be stated as follows: “What are the
rele-vant sources of information accessible in a business, how can these sources be grouped into categories that make them easier to work with, and what research is required to better understand those categories?”. Our contribution in this paper is twofold. First, we perform an empirical study to investigate which sources of information there are in an organization, and how these sources can be organized in a way that is sensible to business analysts. The result is TELIS (see Figure 1), a Taxonomy of Elicitation Information Sources, listing the different sources of information that can be used by analysts during elicitation.
TELIS is the result of a two-step qualitative study. In the first step, we interviewed management students about possible sources of information in a business. This gave us a set of 76 different sources, that we submitted in the second step to a group of business analysts. We asked these analysts to classify the sources using a card sorting method. This enabled us to draw a taxonomy of elicitation sources. To ensure the model is of some practical use, we also tested TELIS in a real RE project; we made use of the taxonomy to elicit requirements about a Document Management System in a Belgian company, and used TELIS to identify alternative sources of information. Although this case study is not a proper validation of TELIS, it demonstrates its feasibility and illus-trates its relevance through a series of observations made during the project. Second, we review the literature on requirements elicitation, and relate it to TELIS so as to stress the existence of some gaps in elicitation literature.
2. RESEARCH METHODOLOGY AND PAPER STRUCTURE
The research method we adopted to build TELIS is exploratory. At the beginning of the research, our objective was mainly to explore more systematically what other sources of information might be used by analysts during elicitation. The research sequence that we followed in this line of research was therefore as follows; we started from some a simple idea (the one discussed in our introduction), developed an exploratory empir-ical design to explore that idea, used the design to collect data, and then only proposed an actual theory to be tested in some subsequent empirical research. While we do not provide a proper validation of that theory, we provide a case study which illustrates how it can be used, and why we believe this is a relevant tool to be used by business analysts during elicitation. A graphical overview of that research sequence is provided in Figure Table 2. That same figure provides the structure for the remaining of this paper. Notice that the map has been built taking into account the recommendations from [Berg(2004)] on how to design qualitative research. It has been slightly adapted to fit the exploratory approach adopted in the present paper.
The development of an Idea is the purpose of Section 3. The section clarifies the con-cept of information source as discussed in the introduction, provides some examples of sources that can be used during elicitation and the reasons why it may be interesting to study these sources more carefully. The Exploratory Design is the focus of Section 4. In this section, we describe the way we investigated the idea described in our introduc-tion. We opted for an exploratory design because we found in RE no list of sources that could be exploited by analysts during elicitation. In order to avoid experimenters bias - by defining ourselves such a list of elicitation sources -, we decided to conduct a study in two rounds. The first step was intended to identify a list of candidate sources, which could then be used as a baseline for the second step intended to produce our actual model. Data Collection is the focus of Section 5. In this section, we explain the way we applied our empirical design to collect data, and present the results of the study; each round of the study involved between 15 and 31 people. Our concern was to offer highly interactive sessions, during which subjects were free to challenge or confirm any hypothesis we were working on. This partially justifies the use of relatively small samples in our study. Our Theory, TELIS, is the result of further treatment on the data
Fig. 2: Research Sequence
collected from business analysts, and is presented and further discussed in Section 6. We describe in Section 7 the Case Study we performed in order to illustrate the use of TELIS in a real-world RE project. The Literature related to TELIS is reviewed in Sec-tion 8 of this paper. SecSec-tion 9 provides a summary of the present paper, and discusses future works.
3. IDEA DEVELOPMENT - IMPORTANT CONCEPTS AND DEFINITIONS
To capture information about the system-to-be (be it requirements or domain con-straints), business analysts have to collect Statements. Roughly stated, a statement is a raw, self-contained, unit of information which can be documented. In other words, a statement is the representation of a raw piece of information, which a business an-alyst judges to be sufficiently self-contained, that it can be distinguished from other statements. Practical examples of statements include a paragraph describing an idea discussed during an interview, an answer from a stakeholder to one particular sur-vey question, a drawing on a storyboard, some notes, photos and other records that all seem to focus on one idea from a brainstorming session, etc. We argue elicitation is about collecting such statements. Once documented, statements can be used as in-put for downstream RE activities; for example, to identify goals, to refine the latter, to study domain constraints, to negotiate some requirements, to handle conflicts, to pick-up alternatives, etc. In other words, statements can be seen as the basic building blocks of the RE concepts. Note that this view on requirements is not new; in [Rolland et al.(1998)Rolland, Souveyet, and Ben Achour], requirements chunks - which are com-binations of some goals with scenarios - are presented as the building blocks of some larger requirements.
The reason why we distinguish statements from requirements (or any other RE con-cept) is that we believe a given requirement should build on several statements, and different statements likely have different sources. In other words, we believe that a requirement should be documented by a business analyst based on several different sources. For example, a statement A communicated by a stakeholder such as “Ive the right as an account manager to access customers information” may lead business an-alysts to document a requirement such as “Account managers shall be able to access customers data”. Using only one such statement to document a requirement might however be a risky strategy for the business analyst. In fact, it could happen that other statements contradict this first statement, or bring additional details about it. For example, looking at the privacy policy of the company, an analyst may find out that this is true only if the account manager is granted access to these data by its manager.
This second statement provides additional details about the initial statement made by the stakeholder, and enables to clarify the requirement.
Even though business analysts in practice do not systematically cross-validate the statements they collect from stakeholders, it is worthy to bear in mind that accounting for several sources of information might help in detecting more systematically elicita-tion defaults. In other words, the point with previous example is that business ana-lysts should account more systematically for the different sources of information that are accessible to them when eliciting requirements or information about the domain. Business analysts should not document requirements or business goals based solely on statements collected from stakeholders (even when several stakeholders say the things), and should ensure that several statements are consistent with each other be-fore actually documenting a requirement. Doing so might help in reducing recurring elicitation challenges such as incompleteness, vagueness, variability, etc. Notice that the methodology of confirming a requirement based on several statements - and hence several sources - is out of the scope of this paper, and will not be further discussed.
4. EXPLORATORY RESEARCH DESIGN
4.1. Step One - Brainstorming Sources of Information
The objective of this first step is to better understand the range of possible sources that are available in the business. The goal is to produce a list of candidate sources, which can then be used in the second step of this research. In this section, we provide more details about the population that we involved and the procedure we established to collect data.
4.1.1. Subjects. In this first stage, we resorted to purposive sampling [Berg(2004)]. Our target subject was any person with a sufficient managerial knowledge back-ground. Management sciences students appeared to be good candidates for our study in that regard. They are aware of the main concerns of a business, have been observ-ing and studyobserv-ing various types of organizations, have some insight into the concept of strategy and the relevance of IT to support that strategy, and likely have a good un-derstanding of the different sources of information within a business. Altogether, these qualities make them relevant subjects for this first exploratory phase of our research.
We selected 20 of them, from the business administration department of the Univer-sity of Namur, and presented them the purpose of our study as well as our expectations. Students were clearly told no compensation would be offered for participating to the study. Afterward, students were invited to actually take part to the study. It was im-portant for us to ensure participation on a voluntary basis, so that we told students they were free to leave if not interested in the study. Out of the 20 invited students, 15 agreed to participate. All remaining students were in their last year of study, so that their knowledge background on management sciences is assumed to be sufficient given the purpose of this first stage of the research. Beside, all students were or had been taking part to a internship in various belgian companies or organizations at the moment of the study, which suggests a minimum level of expertise of these students about the sources of information that are accessible in a business.
4.1.2. Procedure.Each subject was questioned individually. As we were exploring the concept of source and had no idea of what they could be at the beginning of the study, it was difficult to conduct an actual interview. Instead, we opted for a solitary brain-storming approach [Thompson(2003)]. Our objective in doing so was to minimize the role of the interviewer, and let the subject speak about whatever he/she judged rele-vant. Beside, it has the advantage of reducing the impact of possible barriers to cre-ativity such as social loafing or production blocking [Thompson(2003)].
To initiate the session, subjects were first explained the overall objective of the ses-sion; try to discover as much sources of information as feasible. Subjects were clearly told that there was no wrong answers, and that any suggestion would be accounted for. Secondly, the modus operandi was described; subjects had to brainstorm alone about the possible sources of information that exist in a business. Subjects had access to a white-board, paper sheets and a computer connected to the internet. They were free to use these tools as much as needed to help them in their reflexion. Notice that few subjects made use of the computer, but almost all of them used the paper or the white-board. Finally, subjects were asked to remind the last problem they faced during their traineeship, and to recall what type of information they needed to solve it. This en-abled to set up a context and ensure minimum ecological validity of the list of sources. Depending on the motivation and creativity of subjects, the length of brainstorming sessions varied between 10 to 35 minutes. Two subjects mentioned clearly that they were not comfortable with such exercise. The interviewer therefore gave them some additional guidelines as well as some examples of sources cited by other subjects. On average, these two subjects mentioned fewer information sources than other subjects.
4.2. Step Two: Grouping Sources of Information
We expected to collect a relatively large amount of data from step 1, that would have taken the form of a long list of information sources that could be used by analysts. In practice, presenting such list to business analysts may provide little support during elicitation; the list might be too long to read, too difficult to understand, too complex to apply to actual elicitation projects, etc. Our goal in this second step was therefore to find out if business analysts make use of some categories when using sources, and if so, to discover what categories they use. The classification of sources might then be used to better understand which type of source analysts tend to use the most and which are frequently overlooked during elicitation, to define techniques specifically intended to elicit some particular categories of sources, or to provide recommendation about how different classes of sources may complement each other. Notice that such questions remain for future works; our goal in this paper was simply to detect if such classification actually exists.
4.2.1. Subjects. In this second phase, we worked in collaboration with the non-profit organization Technofutur TIC (TTIC), a competence center located in Belgium which proposes high quality training on advanced ICT topics. TTIC is partially funded by the European Union FEDER-FSE funds and the Walloon region, and trained more than 11,000 people in 2011. In collaboration with TTIC, we selected a total of 31 business analyst trainees. These trainees all had strong business and IT experience; most of them were developers or technical analysts, who had been working for at least five years in Belgian companies. All of them were following the training program to gain access to business analyst positions in their own businesses, and claimed to already have some informal experience as business analysts on real RE projects. TTIC also granted access to its infrastructure in order to conduct the study. Notice that trainees were invited to take part to the study on a voluntary basis, and were not compensated, just as for students.
4.2.2. Procedure.The 31 business analysts were asked to form 9 groups of three people and 2 groups of 2 people. Each group was then invited to participate to a card-sorting activity. We described the purpose of the study to subjects - to discover the way busi-ness analysts classify information sources during elicitation -, and explained them the basic rules of the card-sorting technique. We conducted this second step following rigor-ously the recommendations and instructions proposed in [Rugg and Mcgeorge(1997)]. Each group was provided with a set of 76 cards (one per candidate source identified
in step 1). In addition, groups were provided with a dozen of empty envelopes, and a pencil. Before the sorting activity, we asked subjects to read the 76 cards carefully, and to ask questions about those that were unclear to them.
Subjects had the possibility during the entire session to reject cards from the sorting. To do so, we gave to groups an additional envelope with the word “Rejected” written on it, and told them this envelope was to be used whenever a card did not seem rele-vant to elicit information. After this preliminary step had been completed, we started the actual card-sorting activity. We opted for an “all in one” sort; each group performed only one sort on the different entities [Rugg and Mcgeorge(1997)]. We asked subjects to group sources into different clusters (represented via different envelopes), depending on how similar the sources are. Subjects were explicitly told that there was no wrong cluster, and that they were free to create as many clusters as needed. For each cluster, subjects were asked to mention the criteria they used to discriminate, together with a brief explanation. All groups were asked to handle the previous activity without inter-acting with the other groups, although it was strongly encouraged to ask questions to the experimenter whenever something was not clear. We organized three card-sorting sessions, which lasted between 65 and 105 minutes.
5. DATA COLLECTION AND TREATMENT
5.1. Step 1 - List of Candidate Sources of Information
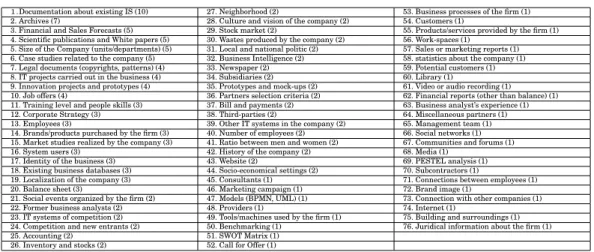
As a result of step 1, we collected 160 utterances. By utterance, we mean a subject proposing a source. Of course, many of these utterances are overlapping, i.e., dealing with the same source. When relevant, we therefore grouped the redundant utterances under the same source. This gave us the final list of 76 candidate sources, which are all reported in Table I. The sources are ranked by order of frequency (between brackets); the more a source has been suggested by subjects, the higher it is in the list. Note that at this stage of the research, we did not decide to reject any source. As a consequence, some sources listed in Table I may appear irrelevant in the scope of elicitation; ex-amples are source number 30 “Trash produced by the company” or source number 75 “Building and surroundings”. We leave the decision to reject or not these sources to the business analysts involved in step 2 of our study. This enables to reduce the influence of the experimenters in this exploratory research, and hence reduce the risk of bias.
Table I: Candidate Sources Identified Through Solitary Brainstorming Sessions
1.Documentation about existing IS (10) 27. Neighborhood (2) 53. Business processes of the firm (1) 2. Archives (7) 28. Culture and vision of the company (2) 54. Customers (1)
3. Financial and Sales Forecasts (5) 29. Stock market (2) 55. Products/services provided by the firm (1) 4. Scientific publications and White papers (5) 30. Wastes produced by the company (2) 56. Work-spaces (1)
5. Size of the Company (units/departments) (5) 31. Local and national politic (2) 57. Sales or marketing reports (1) 6. Case studies related to the company (5) 32. Business Intelligence (2) 58. statistics about the company (1) 7. Legal documents (copyrights, patterns) (4) 33. Newspaper (2) 59. Potential customers (1) 8. IT projects carried out in the business (4) 34. Subsidiaries (2) 60. Library (1)
9. Innovation projects and prototypes (4) 35. Prototypes and mock-ups (2) 61. Video or audio recording (1) 10. Job offers (4) 36. Partners selection criteria (2) 62. Financial reports (other than balance) (1) 11. Training level and people skills (3) 37. Bill and payments (2) 63. Business analyst’s experience (1) 12. Corporate Strategy (3) 38. Third-parties (2) 64. Miscellaneous partners (1) 13. Employees (3) 39. Other IT systems in the company (2) 65. Management team (1) 14. Brands/products purchased by the firm (3) 40. Number of employees (2) 66. Social networks (1) 15. Market studies realized by the company (3) 41. Ratio between men and women (2) 67. Communities and forums (1) 16. System users (3) 42. History of the company (2) 68. Media (1)
17. Identity of the business (3) 43. Website (2) 69. PESTEL analysis (1) 18. Existing business databases (3) 44. Socio-economical settings (2) 70. Subcontractors (1)
19. Localization of the company (3) 45. Consultants (1) 71. Connections between employees (1) 20. Balance sheet (3) 46. Marketing campaign (1) 72. Brand image (1)
21. Social events organized by the firm (2) 47. Models (BPMN, UML) (1) 73. Connection with other companies (1) 22. Former business analysts (2) 48. Providers (1) 74. Internet (1)
23. IT systems of competition (2) 49. Tools/machines used by the firm (1) 75. Building and surroundings (1) 24. Competition and new entrants (2) 50. Benchmarking (1) 76. Juridical information about the firm (1) 25. Accounting (2) 51. SWOT Matrix (1)
5.2. Step 2 - Clusters of Information Sources
As a result of step 2, we identified 67 clusters. As a reminder, a cluster is a grouping suggested by a group of a business analysts of at least two of the candidate sources listed in Table I. Note that clusters from one group are exclusive, but different clusters from different groups are non-exclusive: a same source likely appears in several of these 67 clusters. The clusters that have been suggested by analyst are reported in Table II. The complete set of data (the clusters and their related sources) is available in [Burnay(2015)]. We observe that groups defined, on average, 6 different clusters. The variance is large; some groups only defined two clusters, while others suggested up to 11 different clusters. Groups majoritarily agreed with 72 out of the 76 candidate sources. A majority of subjects disagreed (via the Rejected envelope) with sources 30 “Wastes produced by the company”, 32 “Business Intelligence”. Most group did not rejected sources 75 “Buildings and surroundings” and 76 “Juridical information about the firm”, but agree during the feedback session that these were actually sources they would never use as business analysts. The latter sources are therefore not further considered in TELIS.
It is interesting to note that different groups worked on different granularity levels; for example, group 4 proposed only two clusters - internal and external - while group 10 proposed 7 such clusters. It does not mean the classifications are contradicting; it simply suggests that they are established at different conceptual levels. Beside, it is important to note that we keep each of the 67 clusters as clearly distinct clusters, even though groups defined some clusters using the same discrimination criterion; for example, groups 1 and 2 both defined a cluster “Information System”. Nevertheless, we consider these two clusters separately during data treatment. The main reason is that two different groups of business analysts may apply the criterion differently, i.e., two clusters may have the same criterion, yet contain different sources. The question we are interested in next section is whether there actually are dependencies between these different clusters, and if one single taxonomy can be build from these 67 clusters.
Table II: Source Clusters identified Through Card-Sorting Technique
Group 1 (6) Archives Information on Company Commercial relations Information system 1 Competition Watch Group 7 (4) Group 10 (7) Physical Support Identity of the Company Business strategy/finance Infrastructure Internal Factor Context 1 Archives and Accounting Company history Actors People Brand image and com Financial Situation External Factor Tools/Methods Human Resources 2 Information on context Media Group 4 (2) Group 8 (5) Information on business Group 2 (11) Internal elements Information system 4 Human Resources 1 Documentation External elements Business activities CRM
Analysis of Context Group 5 (9) External information Group 11 (5) Company Members Documents Environment 1 Business models Strategies Financial Management Strategy Various information Information system 2 Enterprise Group 9 (9) Finance 1 Third-parties Operational Strategy System and Operation Company Brand Image Corporate Strategy Identity Participant Analysis and models Stakeholders Financial Analysis
Finance 2 Context 2 External sources Infrastructure Information system 3 Employees and users Related Companies Marketing Marketing/competition
Group 3 (7) Group 6 (2) Production
6. TELIS - THE TAXONOMY OF ELICITATION INFORMATION SOURCES
As a reminder, our goal in this paper is to provide a tool to business analysts that can help them discovering more systematically the possible sources of information avail-able in the business, and which can be used to elicit information about a system-to-be and its environment. We expect that tool to be clear, and straightforward to use. As such, the list of sources listed in Table I and the list of clusters listed in Table II do not meet such criteria. This section therefore aims to further treat collected data, so as to build a tool that is actually of some practical support to analysts during elicitation, and which is not too complex to assimilate. We do so through two different treatment phases. In a first phase, we simply want to reduce the number of clusters; our idea is that some clusters might be very similar and can be considered as one single cluster. In the second phase, our goal is to discover how the different remaining clusters relate to each other, through some hierarchical model. Once completed, these two phases enable us to draw TELIS.
6.1. Regrouping Similar Clusters
Each group who took part to step 2 suggested its own list of clusters. This implies that, among the 67 collected clusters, some clusters suggested by different groups may be very close similar to each other, i.e., there may be different clusters which contain -nearly - the same topics. In other words, it is likely that there is some redundancy be-tween the 67 clusters listed in Table II. As a first stage toward the definition of TELIS, we want to reduce as much as feasible this redundancy. To do so, we encoded the result of the card sorting session as a table. The columns of that table the variables -are the clusters listed in Table II. The rows of that table - the observations - -are the sources listed in Table I which have not been rejected by business analysts in step 2. The values of the table are binary; a source is (or is not) in a cluster. This results in a table with 67*76 values. In this phase, we want to reduce the number of variables.
To reduce the number of dimensions, we used the PROXIMUS technique as defined in [Mehmet and Grama(2003)]. PROXIMUS is defined as “a technique for reducing large datasets into a much smaller set of representative patterns, on which traditional (expensive) analysis algorithms can be applied with minimal loss of accuracy”. Roughly stated, PROXIMUS can be seen as a particular approach to Principal Component Anal-ysis for discrete (in our case binary) variables. The results we obtained via PROXIMUS are reported in [Burnay(2015)]. We summarize these results in Table III. We observe that 14 groupings of existing clusters are proposed. Half of these groupings consist of only two clusters. We also observe three groupings of 3 clusters, two groupings of 4 clusters, and one last grouping of 13 clusters. The Jaccard index (Jsim) computed for these groupings varies between 0.65 and 1; the latter indicates the degree of similarity between the different clusters which have been grouped. We tolerate a relatively low Jaccard index (down to 0.65); this means that the clusters that are grouped are some-how similar, but not perfectly identical. The groupings with a Jaccard index below 0.65 have been rejected. The clusters which are not listed in Table Table III are treated as self-standing clusters (i.e. groupings of only one cluster) in the second phase of the data treatment.
The PROXIMUS technique lead us to the definition of 14 new clusters, which came as substitutes to the 46 clusters listed in Table Table III. These new clusters were “computed” using the union of the different composing clusters; for example, a source is considered as part of the grouping 6 if and only if it belonged either to People, Stake-holders or Human resource clusters. Doing so, we reduced the number of clusters to be treated in phase 2 from 67 to 35.
Table III: Summary of the PROXIMUS Reduction Technique on the Card-Sorting Data
Id Size Error Jsim Grouped Clusters
1 13 0.070 0.66 Analysis and models, Archives, Brand Image, Context 2, Corporate Strategy, Environment 2, Identity, Information on context, Infrastructure, IS 2, Marketing, Strategies, Operating system
2 4 0.031 0.75 Finance 2, Financial Analysis, Financial Management, Fi-nancial Situation
3 4 0.021 0.75 Business models, Infrastructure, IS 1, IS 4 4 3 0.028 0.85 Actors, Commercial relations, Participant 5 3 0.014 0.83 External sources, IS 3, Media
6 3 0.023 0.81 People, Stakeholders, Human resource 2 7 2 0.049 0.73 Enterprise, Environment 1
8 2 0.069 0.81 External elements, External information 9 2 0.104 0.72 Business activities, Physical Support 10 2 0.042 0.70 CRM, Third-parties
11 2 0.083 0.71 Documents, Various information
12 2 0.069 0.67 Employees and users, Human Resources 1 13 2 0.021 0.75 Company history, Production
14 2 0.042 0.75 Analysis of Context, External Factor
6.2. Grouping Clusters into a Single Hierarchy
The second part of data treatment aims to group the 35 intermediate clusters into one final comprehensive model, that can be used by analysts during requirements elicitation. As already explained, the clusters defined by our groups of business an-alysts during the card sorting sessions seem to work on different granularity levels, so that there might be some hierarchy of sources hidden behind such list of clusters. To discover if such hierarchy actually exists, we used the Wards hierarchical clustering algorithm. Roughly stated, the agglomerative hierarchical clustering defined by Ward aims to group, iteratively, observations (in our case, the 76 sources) into clusters which minimize the error sum of square. We ran the clustering algorithm on a table formed by the crossing of the 76 sources and the 35 intermediate clusters. The complete table as well the results are reported in [Burnay(2015)]. The result of the algorithm is sum-marized in Figure 3 under the form of a dendrogram. The numbers reported in the dendrogram are those summarized in Table Table I. The dendrogram was produced using R-Project and its “hclust()” function, included in the stats package.
As a reminder, a dendrogram reads as follows: the longer is the height (the length of the vertical bar above the items) of a group, the more it is different from other groupings. For instance, the grouping of sources 37, 62, 20 and 25 is clearly different from the cluster located on its right, because it has a height of nearly 1. However, the height of the 62, 20 and 25 grouping is too small to be considered as a distinct cluster. Given our objective to build a taxonomy of information sources, we however proceed differently in this paper. We actually want to keep the structure of clusters as suggested in the dendrogram. To avoid too atomic or too large (and meaningless) groupings, we however focus on the taxonomy situated between an height of 0.8 and 1.5. We choose this interval because it suggests groupings of sources that have clear and straightforward interpretations, and which are neither too large nor too small to be of some practical use during elicitation. We discuss these aspects with more details in next subsections.
63 16 22 61 11 21 6 50 58 1 52 57 26 53 51 69 47 49 18 8 39 33 68 60 2 4 37 62 20 25 12 17 28 34 56 10 71 41 5 40 19 42 43 46 55 7 76 9 35 45 13 65 38 48 64 54 70 74 66 67 72 27 75 31 29 44 3 15 59 23 24 73 14 36 0.0 0.5 1.0 1.5 2.0 2.5 Cluster Dendrogram hclust (*, "ward.D2") d Height
Fig. 3: Result of Wards Agglomerative Hierarchical Clustering
6.3. Building TELIS
Again, previous dendrogram cannot be presented as such to business analysts; the clusters of sources it suggests have currently no names, and would be of relatively lit-tle support to analysts. To deal with this issue, we suggest the TELIS taxonomy, which is an improved representation of our empirical data. By improved, we mean that it includes some additional intermediary levels which do not exist in the dendrogram. These intermediary levels of the taxonomy have been labeled based on the interpreta-tion the authors made of the different clusters. Notice that the ground data are exactly the same in TELIS and in the dendrogram shown in Figure 3, i.e., data have been interpreted, but not changed.
We initiated the improvement work by looking at the largest clusters on the top of the dendrogram, i.e., the clusters with a height of 1.5. We then reported the sources contained in each of these clusters on post-its that we then arranged on a large ta-ble. For each grouping of post-it, we then tried to find a discrimination criterion that business analysts could use on real RE projects to identify underlying sources. Once a set of criteria was defined for these top clusters, we looked inside each cluster for new clusters with smaller heights, and repeated the process. Sometimes, criteria iden-tified in a tier N-1 were redundant with the one in the tier N, so that we had to revise the tier N criterion and define a new one, consistent with those of tier N-1. Consider as an example the society branch of the taxonomy; initially, we called it “Society”. When refining this first cluster, we found two sub-clusters dealing respectively with “Stakeholders” and their “Behaviour”. These two criteria were not consistently fitting with the criterion of their parent cluster; in fact, “Society” was too large and did not sufficiently reflect the “Behavior” cluster, so that we finally opted for a less abstract cri-terion like “People”. We proceeded this way iteratively, down to clusters with a height of 0.8. We did not work on smaller clusters, as those were too atomic and lacking of clear meaning. When put together, these different discrimination criteria form TELIS, our Taxonomy of Elicitation Information Sources, represented in our introduction in Figure 1.
Notice that the formulation of sources in TELIS might be slightly different from those provided in Table Table I. This is due to the fact we had to clarify some sources during card sorting sessions, and these new formulations better reflect the clarifica-tions we made. In the remaining of this section, we analyze and discuss in more de-tails the mains categories suggested by TELIS. Note that, for the sake of readability, we decompose our discussion into five subsections, each corresponding to one of the top cluster suggested by our hierarchical clustering. When possible, we also suggest some references that could be used to further enrich the taxonomy with additional sources.
6.3.1. Activities.Activities is a category of sources which is related to the way an orga-nization is working, to what the business does on a day-to-day basis to provide value to its customers and survive within the market. The category divides into two subcat-egories. A first sub-category deals with the sources related to the financial aspects of activities. It includes sources such as the bills and payments which have been made in the past by the business, the balance sheet, the various financial reports gener-ated by the operations of the company and the accounting. This list is exhaustive un-der no means, and other candidate financial sources could be identified from financial standards such as [IFRS(2014)], and used by analysts as additional sources of infor-mation during elicitation. The second sub-category gathers the sources related to the processes themselves, i.e., the activities that are carried out in the organization. It in-cludes sources such as marketing and sales, inventory and business processes of the business. In addition, this second sub-category also includes sources of information such as the analysis of the business structure and environment like SWOT analysis (which focuses on the strength/opportunities and weakness/threat in the business) or the PESTEL analysis (which concentrates on the analysis of environmental factors). These analysis are realized by the company itself, and are intended to better under-stand how internal or external factors may impact the activities of the company. More globally, we see this second branch of TELIS as related to the set of activities defined in the main value-chain model of Michael Porter [Porter(2008)], so that other activities like logistic, services or marketing and sales could also be considered.
6.3.2. Infrastructure.Infrastructure is a category of sources that deals with objects (physical or numerical) related to the company which contain information about the business itself. These sources are directly dealing with the company or its way of work-ing, and are generated by the organization itself or by any other external actor. Within the Infrastructure branch, we make a first distinction between sources focusing on IT artifacts and other sources related to business artifacts in a more general way. The IT artifacts are any object related to existing information systems, or to systems that still need to be designed and/or implemented. It typically includes sources such as UML models, databases schemas and other IT systems. In the latter branch (business ar-tifacts), a second distinction has to be made between public artifacts - produced by some external actors about the business - such as newspapers, expert media or public archives and private artifacts which are produced by people or teams inside the com-pany. In the latter branch, a third and last distinction can be made between artifacts dealing with the present - which reflect the situation of the business as it currently is - such as benchmarking documents, statistics, user guides, call for offer and artifacts dealing with the future - which reflect the situation of the business as it might be in the future - such as innovation projects or prototypes and mockups. Although most of the infrastructure sources listed in TELIS are documents, we believe this branch might also include other physical objects situated within the firm. Documents how-ever contain lots of easily accessible information for the analyst, so that they form a significant part of the infrastructure branch. We found no scientific work reviewing in
a systematic way the different artifacts accessible in a company that could enrich the current version of TELIS.
6.3.3. Vision. Vision is a category that is dealing with the overall orientation of the company; more precisely, it deals with anything that describes how a company intends to do its activities. This second branch of TELIS also divides into two sub-categories. A first one is dealing with what we call value proposition, and gathers all the sources which are dealing with the value a business intends to provide to its customers, be it a product or a service (what). This first branch has sources such as products and services, copyrights & patterns, website of the company or marketing campaign launched by the company. Value proposition is a well known topic in management sciences; a seminal work on this topic is the paper by Kaplan and Norton on strategy maps [Kaplan and Norton(2004)], which could be used to identify additional sources in the branch. The second sub-category is the Corporate Lifestyle, and is mostly focused on with the way the business intends to actually provide value to the customer (how). It divides in two different branches. A first one focuses on the Corporate Strategy - the high-level plans of the company to achieve its goals -, and gathers information sources such as the corporate strategy, vision, subsidiaries or the offices and workspaces organization, which all shape the way people work and interact in the company. A second one focuses on what we call Corporate Settings - the conditions in which people evolve within the company -, and gathers sources such as the job offer published by the company, ratio between men and women, structure of the company or number of employees. Additional sources related to the corporate lifestyle could be identified in literature about business culture and lifestyle [Denison(1990); Gordon and DiTomaso(1992)].
6.3.4. Environment. Environment is a category of sources that deals with the agents or structures which define the context in which the company runs its activities. It divides in three main sub-categories. A first one focuses on the Community, that is, people and companies - or more generally agents - that are somehow interested in what the company produces but who are not proper stakeholders. It includes sources like the Internet, social networks (online or not) and communities, conferences and expert forums. A second branch is called Market, and focuses on the marketplace in which the company is evolving. This second branch gathers sources such as politics, stock market, socioeconomic settings or market studies. A third branch called Interac-tions focuses on the way the company is connected to and interacts with the market. It divides in two sub-branches; a first dealing with competition watch - that is, the monitoring of the competition activities and of the market in general -, with sources such as potential customers and prospects, IT systems of competitors or existing competition and risk of new entrants, and a second one dealing with the Surrounding -sources of information related to the close environment of the company - with -sources such as products purchased by the company, neighborhood, miscellaneous partners or connections with other companies. We believe that Porters model of the five competi-tive forces that shape strategy offers a nice way for identifying additional alternacompeti-tive sources in the Environmental branch [Porter(1986)].
6.3.5. People. People is a category of sources that deal with agents who influence/will be influenced by the system-to-be. It divides in two main sub-categories. A first one deals with the Stakeholders themselves, and splits in Internal and External stake-holders. Internal stakeholders are agents who are bounded to the company and its activities (typically through a working/collaboration contract) like consultants, em-ployees and management team, while external stakeholders are agents having a stake in the system-to-be who are not working inside the company such as customers, subcontractors or providers. A second branch deals with the Behaviour of stakeholders
-that is, the way the work and live in the company, which may different from what they say or claim -, and splits in Experience and Practice branches. The Experience refers to what stakeholders know/have been doing in the past, and include sources such as users experience or knowledge background. Practice refers to what stakeholders do on a day-to-day basis, and include sources such as corporate events, video/audio record-ing or trainrecord-ings. Literature on stakeholders and behaviour is very large, and we invite the reader to refer to the related work section for references to other possible Society sources.
6.4. Initial Observations on TELIS
It is interesting to note that the structure of our taxonomy may appear unintuitive at first sight; for example, it would have been more intuitive to classify the Community sub-branch as part of the People branch, and not as part of the Environment branch, since it seems to deal mainly with external stakeholders. Similarly, it would have been more relevant, from a management point of view, to classify financial data such as bal-ance sheets and accounting in the Infrastructure branch - as parts of the documents being produced to support the businesss main activities -, not in the Activity one. This brings us to a more generic question that naturally arises when considering the pre-vious formulation of TELIS: what justifies this specific grouping of sources? In other words, what drove business analysts to classify elicitation sources this way and not another, more intuitive, way?
We have no proper empirical answer to this question, as we did not discuss system-atically this classification with business analysts after the study. The reason for this is that the treatment of data was a lengthy a process, so that most of the business analysts we involved in our study had left TTIC and where not reachable anymore when we analyzed the results. Based on informal discussions with some of the par-ticipants and based on our own interpretation of TELIS, we however identified a set of properties which could be associated with the categories of TELIS, and which give some preliminary indications to answer this question. We believe these properties of elicitation sources provide part of the rationale for the TELIS classification. We insist on the fact that the present discussion is still preliminary and requires more research in order to be verified. These properties are below.
— Property 1 - Dispensability (core - derived): the fact that the information pro-vided by one source could be elicited from another source, i.e., the extent to which one source is dispensable. A source is said to be core in case the information it con-tains could not be collected from any other source, and is said to be derived in case the analyst can rely on other sources accessible within the business in order to get the exact same information.
People and Environment branches mostly contain core sources; in case they disap-pear, the information that could have been collected from them likely disappear as well, with no alternative ways for a business analyst to collect that information. This is a well known problem for the People branch, with issues related to stakeholders knowl-edge transmission; when an employee or consultant for example leaves a company, so does much of the knowledge he/she accumulated that he/she did not documented in other sources. The same applies for Environment sources that are not properly docu-mented or understood within the company. On the contrary, information contained in the Activities, Vision and Infrastructure branches are the result of decisions made by some other sources, so that they can be considered as derived sources. For example, UML diagrams, SWOT analysis or the business strategy are defined by some stake-holders so that if these sources are lost, it is still possible to collect the information from the stakeholders.
— Property 2 - Proximity (direct - indirect): the fact that the information contained in a source and which is actually relevant to a business analyst can be reached without further treatment/analysis. A source is said to be direct in case information can be reached rapidly and at low cost, and indirect in case additional processing is required to reach the relevant information contained within the source.
Activities sources are indirect; they do not provide information as such and have to be observed/analyzed in order for the analyst to infer relevant information. For exam-ple, one can discover from the balance sheet of a company - using some pre-defined financial ratios - that expected revenue is small, which suggests budget for a new IT system will likely be limited and inextensible. The information however is not re-ported as such in the balance sheet, therefore making the balance sheet an indirect source of information. The same observation can be made for the Vision and Envi-ronment branches; sources like stock market or company website have to be analyzed and/or treated in order to provide relevant information to the business analysts. In-frastructure and People sources on the other hand contain information that can be directly accessed by an analyst, without further processing, i.e., there is no need to further process the source in order to extract relevant information. For example, ask-ing a stakeholder about his/her needs or readask-ing a business document gives instant access to relevant information.
— Property 3 - Openness (internal - external) : the fact that the information con-tained in a source can be accessed by people outside the company. A source is said to be external in case any person - even if not part of the company - can access the information it contains, and internal in case it can only be accessed by people work-ing in close collaboration with the company or who are expressly granted access to that source.
Activities sources are private; they are dealing with actions that are conducted within the structure of the business, and which are likely not accessible from outside the company. Similarly, Infrastructure and People branches are internal. For example, sources such as databases schema, mockups or training level and skills of employees will be private, as it seems clear that people outside the company will not be permit-ted to access such sources of information. On the other hand, Environment and Vision sources are typically public, in that any person outside the company can observe them, and it is not feasible for the company to prevent external people to access those sources. For example, information regarding the website of the company or the job offers it pub-lishes and communicates outside the firm and are open to virtually any person outside the company. Even sources like business strategies or number of employees are busi-ness information which can still be observed from outside the company.
— Property 4 - Validity (factual - subjective): the fact that information contained in a source is based on facts or is the result of subjective interpretation. A source is said to be factual in case the information consist of activities or phenomena that can be directly observed by the business analyst, and is said to be subjective in case the information cannot be observed directly and originate from the interpretation. Activities sources are factual sources; the information they contain are raw and have not been modified/interpreted by other people in any way, so that business analysts can consider that information to be unbiased. For instance, the inventory and stock source is the result of a series of facts and does not involve any interpretation activity. The same observation can be made for the Vision and Environment branches; sources like the company website, the identity of the business or the socio-economic settings are facts which provide information that can be directly observed by the business analyst,
without the intervention of another actor. In the People branch however, we see the sources as subjective; people share information that is the direct result of their own understanding of an activity or phenomena. Similarly, the experience of stakehold-ers and the way they behave in the company are the result of pstakehold-ersonal decisions, so that any information extracted from those sources are likely subjective. Infrastructure sources are also mostly subjective; the information they can provide to the business an-alyst likely are the result of interpretations, assumptions and analysis made by other people. The values of the different properties for the different top-categories of TELIS are summarized in Table Table IV. Again, it is important to note that these properties have been assigned to categories a-posteriori, based on informal discussion with some of the business analysts at the origin of TELIS. It is worthy to note that properties apply consistently to most sources within a branch, even though there might be some sources within a branch that do not verify the property. We consider these exceptions are due to the relative novelty of TELIS, and will hopefully disappear as the taxonomy evolves and gets more mature. Nevertheless, we consider these properties enable to clarify the differences between the different groups of sources, and may help in the identification of additional sources.
Table IV: Summary of the TELIS Sources Properties
Dispensability Proximity Openness Validity
Activities Derived Indirect Internal Factual Vision Derived Indirect External Factual Infrastructure Derived Direct Internal Subjective Environment Core Indirect External Factual People Core Direct Internal Subjective
As a concluding remark for this section, it is interesting to note that the branch RE research has been focusing on is the People, that is the branch where sources are direct and internal, and therefore readily accessible to business analysts. As we discussed in our introduction, the problem with this type of source is that they are subjective, and therefore present some risk during elicitation. The fact that the Infrastructure branch - which is also direct and internal - is derived may be the reason why less attention has been paid to the latter in literature on requirements elicitation. It is also interesting to note that former properties could be used in future RE research as a way to better select more consistently elicitation technique to exploit different elicitation sources; for example, one might recommend different techniques, depending on a source being direct vs. indirect, or being factual vs. subjective. This research direction is however out of the scope of this paper, and will not be further discussed.
7. CASE STUDY - APPLYING TELIS IN A LARGE BELGIAN COMPANY
The present section describes a real case study we used to illustrate the way TELIS can be used to elicit more systematically information during RE projects. As a reminder, there is no methodology introduced in this paper, so that the main intention in our case study is to show the type of improvements that can be expected using TELIS. We do so by using a procedure which consists in collecting information with and without TELIS, then comparing the results. The result of this procedure is a set of conflicts; a conflict occurs whenever there is a difference between a statement collected with and a statement collected without using TELIS, that we judge to be sufficiently significant to be reported as a potential source of requirements elicitation default. Based on this set of conflicts, we are able to make additional observations about what TELIS enables
to achieve during elicitation, and about the potential weaknesses of the current taxon-omy. While the case study is real, the reader should bear in mind that it does not come as a proper validation of the taxonomy, and that further applications of the taxonomy are needed to increase its external validity.
7.1. Project Description
To show the way TELIS can be used during real RE projects, we applied it during the elicitation step of a project in a large Belgian company called UCM. UCM (which stands for “Union des Classes Moyennes”) is an organization proposing administrative services (such as payroll, insurances, leave management, etc.) to small and medium enterprises which cannot afford an employee to do it internally. UCM has over 800 employees in two different main facilities, and services more than 100000 compa-nies/freelancers in Belgium. The project in which we were involved was an internal project intended to implement a new Document Management System (DMS) for man-aging and maintaining the documentation produced by the IT department, including documents as varied as requirements, test case, procedures & processes, communica-tion, planning, business cases, bug reports, release, etc. We intervened in the project as business analysts, in charge of identifying requirements of users toward the DMS-to-be. To do so, we involved 12 employees and 4 project leaders / managers which have all been interviewed at least one time. The whole project was initiated on April 2015, the elicitation step was initiated in the middle of June and ended in the middle of Au-gust 2015. The final requirements documentation was delivered to the UCM on early September 2015.
7.2. Procedure
In order to test TELIS, we defined a procedure. Defining such procedure for a case study helped us in improving the overall internal validity of our study. The main ob-jective of the procedure is to emphasize the potential differences between elicitation performed using regular elicitation techniques, and elicitation performed using regu-lar elicitation techniques in combination with TELIS. The procedure is rather simple, and consists of three main stages. These are defined as follows:
— In a first phase, we performed a series of sixteen standard interviews. The length of these interviews ranged from an hour to up to three hours. Interviewees were all experienced employees from the IT department of the UCM and were asked to take part to the project by their management team. During the interviews, subjects were asked to mention their expectations toward the system-to-be (requirement state-ment), as well as to share any information that could help the authors to under-stand the overall context in which the DMS was going to operate (domain state-ment), or the reasons why the system was needed (problem statement). Interviews were semi-guided; the authors prepared a standard list of questions to stimulate discussion (listed in [Burnay(2015)]), but subjects were free to mention any other information they judged relevant. Subjects were also invited to contact authors via email after the interview in case they had any additional piece of information they wanted;
— In a second phase, we looked for all available sources listed in TELIS which had not been used in the first phase, i.e., all TELIS sources including stakeholders. We tried to do this in a systematic way, and independently from stage 1; this means that we did not account for statements collected during phase 1 and tried to collect as much information as feasible using alternative sources. Our goal was to avoid bias in the research of complementary information, looking only for information that had already been identified during interviews. For example, we read various
busi-ness documents, we observed particular busibusi-ness processes or office atmosphere, we checked for information about UCM on the net or in public institutions, etc.; — In a third phase, we compared the analysis produced as results of phase 1 and phase
2. Our approach was to look for statements originating from different sources but dealing with a same topic, and observe whether these statements were equivalent or “conflicting”. As a reminder, we reported a conflict each time two sources were pro-viding contradicting information about a same domain/requirement/problem state-ment, or each time one statement was less accurate / clear than another.
7.3. Results
Table Table IV reports some example of the different conflicts we identified in phase 3 of our procedure. For confidentiality reasons, we can only publish a small subset of our entire analysis. In total, we identified 8 important conflicts out of approximately 47 “pairs” of statements, that is, a combination of a stakeholders and a TELIS statement dealing with the same topic. This suggests that, in the UCM project, more than fifteen percent of the statements collected from stakeholders were different from the state-ments we identified via other sources. These ten conflicts have been acknowledged by their respective stakeholders; we met the stakeholders after phase 3, and confronted them to the conflict we identified. Each one of the ten conflicts has been recognized, a-posteriori, as an unclear / incomplete / incorrect statement. Notice that we did not use TELIS as a way to identify stakeholders omissions. In fact, it could be possible to use TELIS as a way to identify statements which have not been mentioned at all by stakeholders. While this approach seems promising, it is out of the scope of this paper and will not be further discussed in the rest of this paper.
Table V: Some Conflicts between Stakeholder and TELIS sources at the UCM
Statements from Stakeholders Sources Statements from other TELIS Sources 1 “The main problem is that there is no formal
procedure that defines the way a documen-tation should be validated” (Stakeholder 2)
We found one internal procedure - accessible to everyone in the IT department - defining formally the main steps for vali-dation, in 12 different stages. (Documents about the present) 2 “People here are lazy to produce and
main-tain documents (especially Excel sheets), they find it boring and consider it as a rather ungrateful task” (Stakeholder 5 and 8)
We observed the way people were working (producing docu-ments); in fact, most people did not complain about writing documentation, but simply lacked of clearly defined period of time to complete these tasks. (Process, Internal Stakeholders) 3 “We never use graphical notations in our
documentation. We mostly use natural lan-guage and check-lists” (Stakeholder 5)
We detected in several documents the use of graphical nota-tions like flowchart and some UML-like diagrams. (IT arti-facts)
4 Im not sure there is a problem at all with the current DMS. It is working fine, nobody complains about it” (Stakeholder 8)
By observing and discussing with the teams collaborating and working together, we noticed that sharing documents was ac-tually an important issue, and a source of significant confusion among workers. (Corporate Settings, Internal Stakeholders) 5 “I would say there are approximately a
hun-dred documents produced each month that have to be stored”
(Stakeholder 1)
Looking at the documentation storage drive, we noticed that the production of documents was near a hundred a week, far above the one hundred a month. (IT artifacts)
6 “I think the management wants something new, some sort of novel approach to UCM documentation management, but it is still very unclear” (Stakeholder 5)
We heard about an innovation project intended to modernize the UCM IT infrastructure. The baseline documents of this project stated more clearly the vision and expectations of the management about IT. (Artifacts about the future/Corporate Strategy)
7 “The team manager is the only person who has access to all the documents being pro-duced by his/her team” (Stakeholder 4 and 14)
By studying the behavior of stakeholders when accessing and editing documents, we observed that in practice some people within the team had access to all the documents, in addition to the team manager. (Practice, External Stakeholders) 8 “Each time a problem with the operating
system is identified by the business, we sim-ply report it as a single line in a Excel docu-ment; that is it.” (Stakeholder 14)
When questioning a former member of the IT department, we learned that in addition to the Excel sheet, some important bugs had to be reported in an “Incident” document, with addi-tional details. (Experience)