HAL Id: tel-01278478
https://tel.archives-ouvertes.fr/tel-01278478
Submitted on 24 Feb 2016HAL is a multi-disciplinary open access archive for the deposit and dissemination of sci-entific research documents, whether they are pub-lished or not. The documents may come from teaching and research institutions in France or abroad, or from public or private research centers.
L’archive ouverte pluridisciplinaire HAL, est destinée au dépôt et à la diffusion de documents scientifiques de niveau recherche, publiés ou non, émanant des établissements d’enseignement et de recherche français ou étrangers, des laboratoires publics ou privés.
and a falling boulder
Lingran Zhang
To cite this version:
Lingran Zhang. Local field modeling of interaction between a soil body and a falling boulder. Me-chanics [physics.med-ph]. Université Grenoble Alpes, 2015. English. �NNT : 2015GREAI096�. �tel-01278478�
THÈSE
Pour obtenir le grade de
DOCTEUR DE L’UNIVERSITÉ GRENOBLE ALPES
Spécialité : Matériaux, Mécanique, Génie civil, Electrochimie
Arrêté ministériel : 7 août 2006
Présentée par
Lingran ZHANG
Thèse dirigée par François NICOT et codirigée par Stéphane LAMBERT
préparée au sein du Laboratoire IRSTEA
dans l'École Doctorale Ingénierie-Matériaux Mécanique
É
nergétique Environnement Procédés Production (I-MEP2)Modélisation en champ proche
de l
’interaction entre sol et bloc
rocheux
Thèse soutenue publiquement le 08 Décembre 2015, devant le jury composé de :
M. Jian-Fu SHAO
Professeur, Université Lille 1, Président
M. Olivier MILLET
Professeur, Université de la Rochelle, Rapporteur
M. Jérôme FORTIN
Professeur, Université Picardie Jules Verne, Rapporteur
M. David BERTRAND
Maître de Conférences, INSA Lyon, Examinateur
M. François NICOT
Directeur de Recherche, Irstea de Grenoble, Directeur de thèse
M. Stéphane LAMBERT
Acknowledgements
First of all, I would like to thank my two dear supervisors François Nicot and Stéphane Lambert. Thank them very much for giving me this great opportunity to come to France and to do this PhD study. I am lucky to have them as supervisors. They put students’ need in the first place and respond to student’s questions very rapidly. They guide me to do researches and teach me to have very serious attitude towards research through our numerous discussions. Besides, I admire them for their their responsibilities and their commitments to research.
Second, I would like to thank the jury committee. Thank Mr. Jiaofu Shao, Olivier Mil-let, Jérôme Fortin, David Bertand very much for accepting the invitations. Thank them for spending time reading my manuscript and travelling long distances to participate the defense. They asked important questions and gave suggestions for the manuscript improvement. Meanwhile, I would like to thank Mr. Thierry Faug, Franck Bourrier, Bruno Chareyre for their participations of my two committee of the thesis. They helped me a lot improve my work during the studies. Particularly thanks to Thierry and Franck, my presentation skills have been improved a lot.
Third, I would like to thank my dear colleagues of Irstea laboratory: Nejib Hadda, Adel Albaba, Raphael Maurin, Nguyen Nho Gia Hien, Pascal Hagenmuller, Francois Kenib, etc. They helped me a lot during our scientific discussions. Besides, thank col-leagues: Philomenon, Bel Coraline, Estelle, Isabelle et Fed Ousset, etc, for being very kind to me. They welcome me to join them and give me opportunity to feel their attitudes towards life.
In the end, I would like to thank my dear friends: Gilles Nicolet, Zhun Mao, Huaxiang Zhu, for their friendships and their encouragements. They helped me a lot during the hard times. Besides, I also thank my friends Wentao Cheng, Chao Quan, Meina Chang, Xiaoxiu Li, kai Wu, Chenggang Wang, zhenzhen Liu, etc. They make my life to be very colorful during my studies.
Abstract
The prediction of boulder trajectory and the design of protection structures are partic-ularly two main interests of rockfall engineering. The prediction of boulder trajectory largely depends on the bouncing of the boulder, and the design of protection structures, such as embankments, is closely related to the impact force directed by the boulder.
In this context, the thesis deals with the interaction between a falling boulder and a granular medium through numerical modelling based on a discrete element method. The objective of the thesis is to identify and quantify the mechanisms that govern the bouncing of boulder and the load transfer inside the impacted medium. The manuscript consists of three parts: DEM modelling of the impact process, global bouncing of the boulder and micromechanical behaviour of the impacted medium.
The boulder is modelled as a single sphere with an incident velocity, the medium is modelled as an assembly composed of poly-disperse spherical particles. An elastic-plastic contact law implemented with rolling resistance to consider particle shape effects is used to model the dynamic impact process. The numerical impact modelling is vali-dated by comparison with experimental results from literature in terms of impact force, impact duration, penetration depth.
Bouncing of the boulder is investigated together with energy propagation processes inside the impacted medium. Investigation shows that impact induces the increase of elastic strain energy inside the medium which is followed by a fluidization process characterized by the increase in kinetic energy and energy dissipation, as well as the decrease in coordination number. Boulder’s bouncing occurrence considering various boulder size and medium thickness obtained based on 3D simulations shows that three
impact regimes exist, which is consistent with the results ofBourrier et al.(2008). In
to the different strength and energy dissipation properties of 2D and 3D mediums during the impact loading. Based on the two aspects of investigation, the relation between the bouncing of boulder and the energy propagation within the impacted medium is discussed.
The behaviour of the impacted medium is investigated from a micromechanical point of view. The force chain network in the impacted medium is characterized based on particle stress information. The aim is to find the role of force chains in the strength and the microstructure evolution of the medium. Investigation of the impact force on the boulder by impacting samples composed of different grain sizes shows that sample composed of big grains result in a larger impact force, longer force chains with respect to the medium thickness, and large percentage of long age force chains. In addition, the spatial and temporal distribution of force chains are investigated. The results show that the strength of the medium under impact is contributed by chain particles located between the boulder and the bottom boundary, force transmission in the lateral direction of the medium plays a secondary role. Moreover, the investigation of force chain buck-ling mechanisms indicates that, triggered by the relative movements between the chain particles, the increase of buckling number is related to the decrease of impact force on the boulder as well as the increase of kinetic energy and energy dissipation within the medium.
Keywords: Impact, granular material, rockfall, discrete element modelling, bouncing,
Résumé
La prédiction de trajectoire des blocs et la conception de structures de protection sont deux questions importantes de l’ingénierie des chutes de pierres. La prédiction de la trajectoire d’un bloc dépend en grande partie des rebonds de ce bloc tandis que la conception de structures de protection, comme les merlons, est étroitement liée à la force d’impact sur le bloc.
Dans ce contexte, la thèse traite de l’interaction entre un bloc qui tombe et un milieu granulaire en utilisant une modélisation numérique par la méthode des éléments discrets. L’objectif de la thèse est d’identifier les mécanismes qui contrôlent le rebond du bloc et le transfert d’effort dans le milieu impacté. Ce travail s’articule autour de trois grands axes: la modélisation DEM du processus d’impact, le rebond du bloc et le comportement micromécanique du milieu impacté.
Le bloc est modélisé par une unique sphère avec une vitesse incidente tandis que le milieu est modélisé par un assemblage de particules sphériques poly-disperses. La loi de contact élastique-plastique, avec une résistance au roulement pour considérer les effets de forme des particules, est utilisée pour modéliser le processus d’impact. La modélisation numérique de l’impact est validée par des comparaisons avec des résultats expérimentaux issus de la littérature en termes de force d’impact, de durée d’impact et de profondeur de pénétration.
Le rebond du bloc est examiné en s’appuyant sur les processus de propagation d’énergie dans le milieu impacté. L’étude montre que l’impact provoque l’augmentation de l’énergie de tension élastique à l’intérieur du milieu qui est suivie par un processus de fluidisation caractérisé par l’augmentation d’énergie cinétique et la dissipation d’énergie ainsi que par la diminution du nombre de coordination. L’occurrence du rebond du bloc obtenue avec des simulations 3D en considérant plusieurs tailles de bloc et plusieurs
épaisseurs du milieu montre que trois régimes d’impact existent, ce qui est en accord
avec les résultats obtenu par Bourrier et al.(2008). De plus, il existe des différences
entre les diagrammes d’occurrence de rebond 2D et 3D en raison de résistances et de propriétés de dissipation d’énergie différentes. En se basant sur les deux aspects de l’étude, la relation entre le rebond du bloc et la propagation d’énergie dans le milieu est discutée.
Le comportement du système impacté est examiné d’un point de vue micromécanique. Le réseau de chaînes de force dans le milieu impacté est caractérisé à partir des con-traintes moyennes au sein des particules. L’objectif est d’identifier le rôle des chaînes de force dans l’évolution de la résistance et de la microstructure du milieu. Létudiant de la force d’impact sur le bloc avec des impacts sur des échantillons de grains de tailles différentes montre que l’échantillon composé de grains de taille importante induit une force d’impact plus élevée, des chaînes de force plus longues comparées à l’épaisseur du milieu ainsi qu’un pourcentage important de chaînes de force avec une longue durée de vie. De plus, l’étude de la distribution spatiale et temporelle des chaînes de force montre que la résistance du milieu pendant l’impact est due aux particules des chaînes situées entre le bloc et la frontière inférieure du milieu impacté et que la transmission des forces dans la direction latérale joue un rôle secondaire. Enfin, l’étude des mécanismes de flam-bage des chaînes de force indique que, induit par les mouvements entre les particules de la chaîne, l’augmentation de nombre d’éffondrement est liée à la diminution de la force d’impact sur le bloc ainsi qu’à l’augmentation d’énergie cinétique et de la dissipation d’énergie au sein du milieu.
Mots-clés: Impact, matériau granulaire, chute de blocs, modélisation par éléments
Abbreviations
BN Number of buckling chain segments
dFn Incremental normal contact force
dFs Incremental shear contact force
dm Mean diameter of grains
Ed Total energy dissipation
Edb Energy dissipation due to bending
Eds Energy dissipation due to sliding
Edtw Energy dissipation due to twisting
Ek Kinetic energy of the medium
Ekb Kinetic energy of boulder
Emgh Gravity potential energy
En Local normal modulus
Es Elastic strain energy
Et Total energy of the system
Fboul Impact force on the boulder
Fn Normal contact force
Fs Shear contact force
g(r) Radial distribution function
H Medium thickness
HDCD Homogeneously distributed chain domain
InEd Incremental of total energy dissipation
L Medium length
lchain Mean length of chain
lHDCD Critical length of HDCD
max ∆Fbott Maximum incremental transmitted force on the bottom boundary
pv p-value for chi-square test
pv Mean value of pv
Rb Radius of boulder
Rm Mean radius of grains
Timp Impact duration
Vboul Vertical velocity of the boulder
Zboul Penetration depth of boulder inside the layer
βr Bending stiffness parameter
βtw Twisting stiffness parameter
∆Fbott Incremental transmitted force on the bottom boundary
∆t Time step
σ1 The major principal stress
θ Orientation of σ1with the z axis
θb Critical chain buckling angle
θc Chain criterion
ηb Rolling elastic limit
ηtw Twisting elastic limit
µ Local Poisson’s ratio
ρ Mass density
φ Orientation of σ1with the x axis
Contents
Acknowledgements i Abstract iii Résumé v Abbreviation vii 1 General introduction 1 1.1 Rockfall hazards . . . 3 1.2 Engineering expectations . . . 4 1.2.1 Trajectory predictions . . . 51.2.2 Protection structure design . . . 6
1.3 The role of impact in rockfall predictions and mitigations . . . 7
1.4 Objectives and contents of the thesis . . . 8
2 State of the art 11 2.1 Interaction between a boulder and a granular medium . . . 13
2.1.1 Engineering practices . . . 13
2.1.2 Experimental investigations . . . 16
2.1.3 Numerical modelling . . . 19
2.2 Bouncing of a boulder on a granular medium . . . 20
2.2.1 Experimental investigations . . . 21
2.2.2 Numerical modelling . . . 24
2.3 Micromechanical properties of granular materials . . . 27
2.3.1 Bimodal character of load transmission in granular materials . . . 27
2.3.2 The role of force chains in granular materials . . . 29
2.4.1 Introduction of discrete element method . . . 31
2.4.2 Modelling of particle shape . . . 35
2.4.3 Energy dissipation in granular materials . . . 37
2.5 Conclusion . . . 39
3 DEM modelling of the impact process 41 3.1 Introduction . . . 43
3.2 Contact model description . . . 43
3.2.1 Description of Cundall-Strack contact law . . . 44
3.2.2 Rolling resistance . . . 46
3.2.3 Calculation of energy items . . . 48
3.3 Contact law calibration and validation . . . 52
3.3.1 Triaxial experimental test . . . 52
3.3.2 Contact law calibration . . . 54
3.3.3 Contact law validation . . . 64
3.4 Impact simulation . . . 64
3.4.1 Modelling of a falling boulder interacting with a granular medium 65 3.4.2 Validation of the impact modelling . . . 66
3.5 Conclusion . . . 75
4 Global bouncing occurrence of the boulder 77 4.1 Introduction . . . 79
4.2 Variability of the results with respect to impact locations . . . 79
4.2.1 Introduction . . . 79
4.2.2 Methodology . . . 81
4.2.3 Results . . . 82
4.3 Energy propagation inside the granular medium . . . 87
4.3.1 Layer division . . . 87
4.3.2 Evolution of kinetic energy Ek and elastic strain energy Es . . . 88
4.3.3 Evolution of coordination numbers . . . 90
4.3.4 Evolution of incremental energy dissipation . . . 91
4.3.5 Discussion . . . 95
4.4 Boulder’s global bouncing occurrence . . . 97
4.4.1 Impact simulations . . . 97
4.4.2 Definition of bouncing . . . 99
CONTENTS xi
4.4.4 Discussion . . . 107
4.5 Conclusion . . . 109
5 Micromechanical behaviour of the impacted medium 111 5.1 Introduction . . . 113
5.2 Characterization of force chains inside an impacted medium . . . 113
5.2.1 Major principal stress σ1of a particle . . . 114
5.2.2 Algorithms for selecting force chain particles . . . 115
5.2.3 Procedures for identifying force chain network . . . 116
5.2.4 Average major principal stress σ1 . . . 117
5.2.5 Number of chain particles and average chain length . . . 118
5.3 Parametric analysis of the effects of grain sizes . . . 121
5.3.1 Effect of grain sizes on impact force . . . 121
5.3.2 Effect of grain sizes on chain length . . . 122
5.3.3 Effect of grain sizes on chain age . . . 123
5.4 Spatial and temporal evolution of force chains . . . 125
5.4.1 Spatial structure of force chains . . . 126
5.4.2 Chain particle distances . . . 129
5.4.3 Population of chain particles and average chain distance inside the conical volume . . . 131
5.4.4 Critical length lHDCD . . . 133
5.5 Force chain buckling mechanisms . . . 137
5.5.1 Buckling angle and buckling number . . . 137
5.5.2 Triggering and energy dissipation of force chain buckling . . . 139
5.5.3 Relations between buckling, impact force and energy items . . . . 141
5.6 Potential of force chain micromechanisms for rockfall engineering . . . 144
5.7 Conclusion . . . 145
6 Conclusions and perspectives 147 6.1 Conclusions . . . 147
List of Figures
1.1 Schematic description of rockfall movement (Highland,2004) . . . 3
1.2 Examples of rockfall events occurred in: (a) Guilin China, (b) United States,
(c) Tramin Italy, (d) Arly Gorge in the French Alps . . . 4
1.3 (a) Rockfall hazard zoning (Irstea, F. Berger),(b) Simulations of rockfall
trajectories near a residence area(Agliardi et al.,2009) . . . 5
1.4 (a) Rockfall protection drapes (from Geobrugg company), (b) Rockfall protection barriers (from Geobrugg comany), (c) Railways protected by
rock sheds, (d) Rockfall protection embankment (Irstea, S. Lambert) . . . 6
1.5 Schematic description of the thesis structure . . . 10
2.1 Impact test devices (Labiouse et al.,1996) . . . 17
2.2 Time evolution of (a) the deceleration of the boulder, (b) the force
trans-mitted to the bottom (Plassiard and Donzé,2009) . . . 19
2.3 (a) Impact force as a function of impact energy; (b) Stresses on the plate as
function of impact force (Calvetti et al.,2005) . . . 20
2.4 Definition of incident (left) and rebound velocity components (right) for the rebound . . . 21
2.5 Concentric crown (Bourrier et al.,2010) . . . 25
2.6 Definition of the impact regimes, where H is the height of the impact
granular medium, Rbis the radius of the boulder, Rm is the mean size of
the grains, Rcrit
b is the asymptotic value between regime I and II, Rminb is
the critical value between regime II and III (Bourrier et al.,2008). . . 26
2.7 Probability density distribution of normalized force in Mueth’s
2.8 The force-bearing network of contacts in a biaxially compressed system of 4000 disks. The line thickness is proportional to the normal force. The strong and weak forces are shown in dark and light colors, respectively.
The sliding contacts are marked by small filled circles (Radjaï and Lanier,
2009) . . . 29
2.9 Photoelastic particles force chains obtained byMajmudar and Behringer
(2005): a low-force sheared state(left), a high-stress isotropically
com-pressed state (right) . . . 30 2.10 Calculation cycle of DEM method . . . 32 2.11 Isotropic polygonal grains (left) and elongated polygonal grains (right)
(Nouguier-Lehon et al.,2003) . . . 36
2.12 Parallelepiped-like clumps (left) and ellipsoidal clumps (right) (Nicot et al.,
2007) . . . 37
3.1 Two spheres in contact . . . 44 3.2 Description of the contact model . . . 49 3.3 Grain size distribution (left) and main characteristic (right) of the Ticino
sand used in the experiments (Salot et al.,2009) . . . 53
3.4 Mohr circles obtained based on experimental data of triaxial tests (Salot
et al.,2009) . . . 53
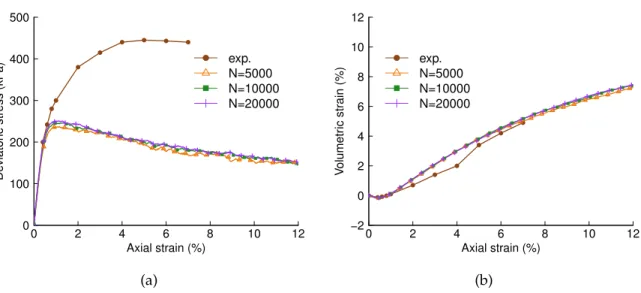
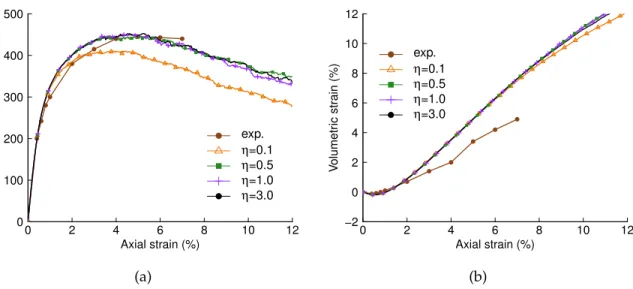
3.5 Procedure of numerical triaxial test . . . 54 3.6 Effects of the number of particles on (a) Deviatoric stress, (b) Volumetric
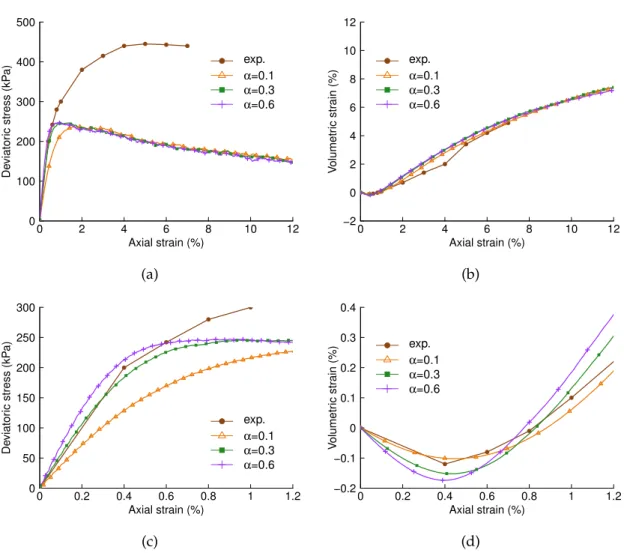
strain . . . 57 3.7 Effects of the local modulus on (a) Deviatoric stress, (b) Volumetric strain. 58 3.8 Effects of the local stiffness ratio on (a) Deviatoric stress, (b) Volumetric
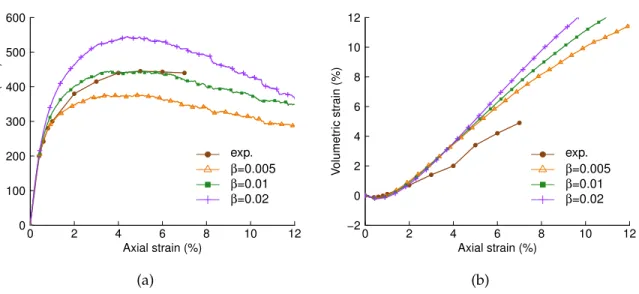
strain, (c) Zoom of deviatoric stress, (d) Zoom of volumetric strain . . . 59 3.9 Effects of the rolling stiffness coefficient β on (a) Deviatoric stress, (b)
Volumetric strain . . . 60 3.10 Effects of the rolling elastic limit coefficient η on (a) Deviatoric stress, (b)
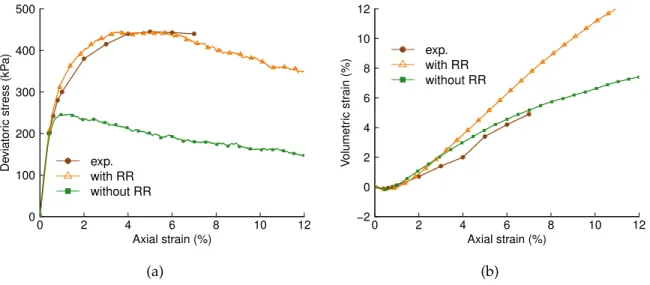
Volumetric strain . . . 61 3.11 Comparison between the cases of "with" and "without RR" (rolling
resis-tance) in terms of (a) Deviatoric stress, (b) Volumetric strain . . . 63 3.12 Evolution of (a) Deviatoric stresses, (b) Volumetric strains under the
con-fining pressures of 100 kPa, 200 kPa and 300 kPa . . . 64 3.13 Modelling of the boulder and the granular medium . . . 65
LIST OF FIGURES xv
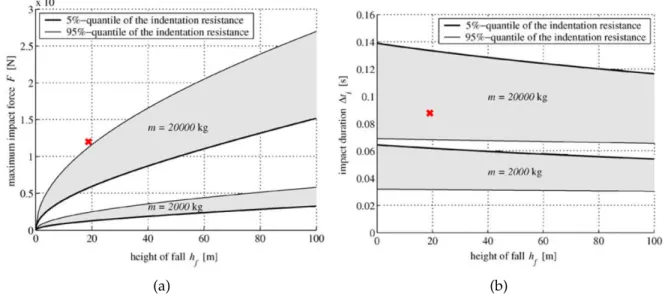
3.15 (a) Maximum impact force on the boulder, (b) Impact duration obtained
in Pichler et al. (2005). The red cross points correspond to the DEM
simulation results. . . 68
3.16 Time evolution of impact force Fbouland incremental transmitted force on
the bottom ∆Fbott . . . 70
3.17 Results in terms of the ratio of Max.∆Fbott to Max.Fboul obtained inStoffel
(1998) (page 90) . . . 70
3.18 Time evolution of impact force Fboul, boulder’s velocity Vboul and
Penetra-tion depth Zboul . . . 73
3.19 Positions of boulder and the granular medium at the time of (a) 0.053 s, (b) 0.51 s . . . 74
3.20 Penetration depth obtained inPichler et al.(2005). The red cross points
correspond to the DEM simulation results . . . 74
4.1 Variability of results in terms of (a) Impact force on the boulder Fboul, (b)
Vertical velocity of boulder Vboul with respect to two locations. In this
case, the radius of the boulder is 1.2 m, the layer thickness of the granular medium is 3 m . . . 80
4.2 n number of impact locations on the center surface area of 2 m ×2 m,
n =a2, with a=2, 3, 4, ..., 20. . . 82
4.3 Probability density distributions of (a) Maximum impact force on the
boulder max Fboul, (b) Maximum reflection velocity of boulder max .Vboul
of 400 simulations; Probability density distributions of (c) max .Vboul, (d)
max .Vboulof 49 simulations. The red curves are density estimates along
the histograms . . . 83 4.4 Evolution of s/x (the ratio of the standard deviation to the mean value,
for the case of maximum impact force on the boulder) versus Rb/Rm . . . 86
4.5 (a) Load diffusion angle, (b) Layer division for an impact case of a 4 Rm
boulder radius and 40 Rm layer thickness . . . 87
4.6 Time evolution of kinetic energy Ek and elastic strain energy Es inside
each volume . . . 89
4.7 Time evolution of kinetic energy Ek and elastic strain energy Es inside
each volume . . . 91 4.8 Time evolution of coordination numbers inside each volume . . . 92 4.9 Incremental sliding and rolling energy dissipation inside each crown volume 93 4.10 Number of sliding and rolling contacts inside each crown volume . . . 94
4.11 Schema of energy propagation process inside the impacted medium . . . 95
4.12 Evolution of collision time versus the ratio of Rb/Rm . . . 100
4.13 Time evolution of (a) impact force Fboul, (b) zoom of Fboul, (c) velocity Vboul and penetration depth Zboulfor the case of Rb =5Rm, H=15Rm . . . 101
4.14 Bouncing occurrence diagrams for both 2D and 3D cases by adopting two criterion parameters αcri =0.2 and Pcri =0.6 . . . 102
4.15 Bouncing occurrence diagrams for both 2D and 3D cases by adopting various pair of criterion parameters (αcri, Pcri) . . . 104
4.16 Bouncing occurrence diagrams for both 2D and 3D cases by adopting two criterion parameters αcri =0.2 and Pcri =0.8 . . . 105
4.17 Reaction of impact force on the boulder Fboul, velocity of boulder Vboul for the case of (a) Rb = 4Rm, H = 20Rm; (b) Rb = 4Rm, H = 40Rm; (c) Rb =6Rm, H =40Rm; (d) Rb =8Rm, H =10Rm . . . 106
4.18 Schema of the bouncing occurrence of boulders . . . 108
5.1 The major principal stress of a particle . . . 115
5.2 Intersection angle of chain particles . . . 115
5.3 Time evolution of (a) Impact force on the boulder and (b) Average major principal stress σ1of all particles . . . 117
5.4 Crown volumes of the medium . . . 118
5.5 Time evolution of (a) Impact force on the boulder Fboul, (b) number of chain particles inside crown layers, (c) Number of chain particles for the whole sample, (d) Average chain length . . . 120
5.6 Experiments set up for (a) Rb/Rm =2, (b) Rb/Rm =5, (c) Rb/Rm =10 . . 122
5.7 The average maximum impact force on the boulder versus the Rb/Rm . . 122
5.8 Evolution of (a) lchainand (b) lchain/Npversus Rb/Rm . . . 124
5.9 (a) Probability density distribution of chain age, (b) Zoom of (a) . . . 125
5.10 Propagating stresses at impact force for all three sets of particle used. (a) harder particles (M′ ≈0.1) correspond to fast, chain-like force propaga-tion, (b) forces for intermediate stiffness particles (M′ ≈0.3) are spatially more dense, but still relatively chain-like. (c) the softest particles (M′ ≈0.6) show a dense force structure which propagates with a well defined front (Clark et al.,2014). . . 127
5.11 Evolution of force chain network inside a 2D impacted medium . . . 128
5.12 The radial distribution function of chain particle distances . . . 130
LIST OF FIGURES xvii
5.14 Time evolution of (a) Percentage of chain particles in the conical volume
pcv, (b) Normalized chain distance dcvc , (c) Impact force on the boulder
Fboul and (d) Velocity of the boulder Vboul . . . 132
5.15 Description of chain section sub-divisions . . . 134
5.16 Distribution of chi-square p-values for t=0.04 s, the dotted line represents
pv=0.01 . . . 134
5.17 Time evolution of (a) lHDCD, (b) impact force Fboul and (c) boulder velocity
Vboul . . . 136
5.18 Geometry change of three particle segments during a force chain buckling event . . . 138 5.19 Time evolution of (a) average buckling angle ¯α and (b) buckling number BN138 5.20 Evolution of buckling number (BN), ratio of energy dissipation segments
to the total buckled force chain segments (Ratio_Ed), relative translational
velocity (Rel_v) and relative rotational velocity (Rel_w) versus the
buck-ling criterion angle θb . . . 139
5.21 Effects of number of particles on (a) Evolution of AS and AR versus time, (b) Comparison of energy dissipation by force chains buckling . . . 141
5.22 Correlation of buckling number BN with impact force on the boulder Fboul,
kinetic energy of the medium Ek and incremental energy dissipation InEd 143
6.1 Relation among macroscopic reaction of boulder, energy propagation and force chain microstructure evolution inside the impacted medium . . . 150
List of Tables
2.1 Parameters that influence the bouncing of block . . . 22 3.1 Values of the calibrated local contact parameters . . . 62 3.2 Parameters of the boulder and the granular medium . . . 67
4.1 Average value xn, standard deviation sn as well as the p-values of
Shapiro-Wilk normality tests for n number of simulations . . . 84 4.2 Confidence intervals between n number of simulations and the reference
Chapter 1
General introduction
Contents
1.1 Rockfall hazards . . . . 3 1.2 Engineering expectations . . . . 4 1.2.1 Trajectory predictions . . . 5 1.2.2 Protection structure design . . . 6 1.3 The role of impact in rockfall predictions and mitigations . . . . 7 1.4 Objectives and contents of the thesis . . . . 81.1 Rockfall hazards 3
1.1
Rockfall hazards
Rockfall is one of major risks in mountainous areas. Triggered by the detachment of rock fragments from cliffs, rockfall is an extremely rapid process with potentially long travel distances (Figure 1.1). A specific definition of rockfall is one or several frag-ments of rock blocks detached by sliding, toppling or falling, that fall along a vertical or sub-vertical cliff, and proceed down the slope by bouncing and flying along ballistic
trajectories or by rolling and sliding (Dorren et al.,2011). The carried kinetic energies of
rock blocks along their trajectories vary from a few kilojoules to 50,000 kJ or even beyond (Nicot et al.,2007).
Figure 1.1: Schematic description of rockfall movement (Highland,2004)
Rockfall can cause serious damage to residential areas and infrastructures. For in-stance, in a beautiful tourist spot of Guilin China, seven tourists were killed during a rockfall event on 19 March 2015 (Figure 1.2(a)). In United States, a rockfall event led to the injury of one motorist and the damage of a roadway on 24 February 2015 (Figure 1.2(b)). In south Tyrol Italy, around 4000 cubic meters of rocks detached from a near vertical rock cliff, the major part of debris consisted of a number of enormous boulders that slid and rolled down the slope before striking a 300 year old building on 21 January 2014 (Figure 1.2(c)). Another example of rockfall event occurred in the Arly Gorge in the French Alps (the road built there is the most expensive one in Europe due to the
protection structures constructed against mountain hazards: rockfalls, landslides, snow avalanches), a car was crushed by a 20-tonne boulder in February 2012 (Figure 1.2(d)). Moreover, due to the warming trends in world climate which have a significant influence on mountain permafrost and destabilize rockfall starting zones, more and more rockfall
events are expected to occur (Kenner et al.,2011;Einhorn et al.,2015).
(a) (b)
(c) (d)
Figure 1.2:Examples of rockfall events occurred in: (a) Guilin China, (b) United States, (c)
Tramin Italy, (d) Arly Gorge in the French Alps
1.2
Engineering expectations
Characterized by its rapid process, the occurrence of rockfall events is difficult to predict, while it is possible to reduce the damage by risk assessment and protection structure design. Rockfall engineering in particular concerns two interests: the prediction of boulder trajectory and the design of protection structures.
1.2 Engineering expectations 5
1.2.1
Trajectory predictions
The prediction of rockfall trajectories is of crucial importance in rockfall engineering. It is used not only for rockfall hazard assessment and hazard zoning, but also for the design of rockfall mitigation structures. Both of the two engineering expectations have
high requirements upon the trajectory predictions (Evans and Hungr,1993;Chau et al.,
2002;Dorren et al.,2006;Peila et al.,2007;Ronco et al.,2009;Peila,2011;Dorren et al.,
2011;Volkwein et al.,2011;Lambert and Bourrier,2013).
(a) (b)
Figure 1.3:(a) Rockfall hazard zoning (Irstea, F. Berger),(b) Simulations of rockfall trajectories
near a residence area(Agliardi et al.,2009)
Generally, rockfall hazard assessment and trajectory predictions would require evalu-ating the temporal probability and the spatial susceptibility of rockfall events, the 3D trajectory and maximum run-out distance of falling blocks as well as the distribution of rockfall intensity at each location and along each falling path (Figure 1.3). Particularly, the hazard mapping for defining levels of hazards taking into account both rockfall occurrence frequency and the kinetic energy of boulder allows to improve the hazard as-sessment accuracy (Figure 1.3(a) and 1.3(b)). The design of rockfall mitigation structures is based on an estimation of the size of the rockfall as well as the kinetic energy level of the boulder at the location where the mitigation device is to be installed.
1.2.2
Protection structure design
Based on the knowledge of rockfall risk assessment and trajectory analysis, rockfall mitigations which include active and passive protection systems can be carried out. Active protection systems (Figure 1.4(a)) are designed to avoid rockfalls from occurring, while passive protection structures are designed to protect at-risk structures from the rockfall event. The most commonly used passive protection structures include flexible fences and barriers (Figure 1.4(b)), rockfall galleries and rock sheds (Figure 1.4(c)), em-bankments (Figure 1.4(d)). The choice between different protection strategies depends on the site topography and the impact energy of falling boulders.
(a) (b)
(c) (d)
Figure 1.4:(a) Rockfall protection drapes (from Geobrugg company), (b) Rockfall protection
barriers (from Geobrugg comany), (c) Railways protected by rock sheds, (d) Rockfall protection embankment (Irstea, S. Lambert)
In general, the sheltering structures (rock sheds or galleries) devoted to the protec-tion of roads and railways against rockfalls consist of a reinforced concrete roof-plate supported by a bearing structure (Figure 1.4(c)). The roof-plate is usually covered by a cushion layer to attenuate the impact force of rockfall and diffuse transmitted impact
1.3 The role of impact in rockfall predictions and mitigations 7
stress side the concrete plate. The current engineering practice consists in using on-site
material as cushion layer, sand or other ’specific’ materials are marginally used (Calvetti
et al.,2005).
Apart from rockfall sheltering structures, embankments have shown to be an efficient way of protecting areas where the falling blocks have volumes or velocities large enough to break through the net fences, or where frequent rockfall events have to be faced within
a short interval of time (Lambert and Bourrier,2013). Different types of embankments
made of natural compacted soil, huge rock blocks, gabions or reinforced ground are used in rockfall engineering. The embankments should have the abilities of controlling block’s trajectory and resisting against the impact force of the boulder. In addition, embankments are usually associated with catching ditches made of loose materials to dissipate the block’s energy (Figure 1.4(d)).
1.3
The role of impact in rockfall predictions and
mitiga-tions
The trajectory prediction particularly depends on the bouncing of boulder. The design of protection structure relies on the impact force and the transmitted force inside the granular medium which are sometimes used to estimate the stress within the protection
structures and verify the deformation and the stability of the structures (Labiouse et al.,
1996;Pierson et al.,2001;Peila et al.,2007;Schellenberg,2009;Peila,2011;Lambert and
Bourrier,2013).
Both the trajectory prediction of boulder and the design of the protection structures are related to the interaction of a boulder and a granular medium. This medium can represent either natural or man-made soils, covering the slope or constituting protec-tion structures. This boulder-medium interacprotec-tion issue is of paramount importance for governing the bouncing of the boulder and the response of the protection structure. Therefore, this boulder-medium interaction issue is important not only for conducting rockfall trajectory predictions, but also for defining optimum protection strategies and design protection structures.
The impact of a boulder on a granular medium is characterized by rapid loading and unloading, large deformations, rapid energy exchange and compression wave
propaga-tion process (Makse et al.,2004;Crassous et al.,2007). The boulder-medium interaction is
a very complex process which depends not only on the mass, shape, velocity of boulder, but also on the characteristics of the granular medium such as stiffness, density, porosity,
medium thickness (Ciamarra et al.,2005;Bourrier et al.,2008;Pacheco-Vázquez et al.,
2011;Kondic et al.,2012). The bouncing and the design of protection structures therefore
require well taking into account the complex mechanisms that are working during the impact.
However, for either the design of protection structures or the bouncing of a block, the current investigation approaches dealing with the boulder-medium interaction have limi-tations. The analytical models were calibrated based on global measurements obtained in specific impact and boundary conditions. These models are limited to these specific cases and cannot be generalized, due to the lack of sufficient knowledge of the mechanisms actually occurring in the granular material during the impact. Meanwhile, these models are most often based on strong assumptions which also limit their reliability. Numerical models calibrated based on experiments are relevant for predicting the bouncing and the impact force on the boulder. However, numerical modelling does not sufficiently go deep enough to address the micromechanisms that govern the bouncing of the boulder and the response of the granular medium. Therefore, research-based investigations of a boulder impacting a granular medium to well understand the mechanisms that govern the bouncing of the boulder as well as the response of the granular medium are required.
1.4
Objectives and contents of the thesis
This thesis addresses the boulder-medium interactions from both global and mi-cromechanical points of view through numerical modelling approach. The objective is to identify and quantify the mechanisms involved in load transfer in the neighbourhood of the impact and to estimate their consequences on the global response of the granular layer. The investigations mainly focus on the bouncing of the boulder and the microme-chanical load transfer inside the impacted medium.
1.4 Objectives and contents of the thesis 9
The work of the thesis includes (Figure 1.5):
Chapter 2, State of the art reviewing researches concerning rockfall impact reported in the literature. The important issue is interaction between a boulder and a granular medium, including the bouncing of the boulder on a granular medium. In addition, micromechanical properties of the granular material are important issue that controls the response of the granular medium during the impact. In the end, numerical modelling based on a discrete element method is introduced.
Chapter 3, DEM modelling of the impact process by adopting rolling resistance in the contact law to model the particle shape effects. The contact parameters will be calibrated based on quasi-static triaxial tests of angular Ticino sand. This sand is chosen since it can be used to represent the soil composing the slopes or rockfall protection structures. The impact simulation will be validated by comparison with experimental results from literature.
Chapter 4, Investigation of the global bouncing of the boulder on the medium. First of all, effects of the local configuration are investigated, a specific number of simulations is shown to be sufficient to capture the average impact force and reflect velocity of boulder. Second, elastic strain and kinetic energy propagation inside the medium is quantified in order to investigate the relation between energy processes within the specimen and the rebound of he boulder. Third, the bouncing occurrence diagrams are investigated by fixing the grain size while varying the boulder size and the medium thickness. The studies permit to better quantifying the bouncing of boulder in 3D context, which can be useful for improving the prediction of the boulder trajectories.
Chapter 5, Investigation of the micromechanical behaviour of the impacted medium from a micromechanical point of view. The aim is to give the macroscopic behaviour of the impacted medium a micromechanical explanation. First, force chain network inside the impacted medium is characterized based on particle stress information. Sec-ond, impacts of boulders on granular mediums composed of different grain sizes are investigated. Third, the spatial and temporal distribution of force chains are investigated. Finally, studies are conducted to investigate the buckling mechanism of force chains and its relation with impact force and energy items. The investigations indicate that force
chains play a fundamental role in governing the impact force on the boulder as well as the microstructure strength of granular medium. The micromechanial features allow to better serve the design of protection structures.
Chapter 6, Conclusions and perspectives.
Rockfall engineering interest
Boulder trajectory analysis Protection structure design
Bouncing of boulder Impact force
DEM modelling of Rockfall impact
Model calibration and validation
Global behaviour Micromechanical behaviour
Energy propagation Bouncing occurrence diagrams
Force chain structure Force chains buckling
Chapter 2
State of the art
Contents
2.1 Interaction between a boulder and a granular medium . . . 13 2.1.1 Engineering practices . . . 13 2.1.1.1 Chinese design codes . . . 14 2.1.1.2 Swiss design codes . . . 15 2.1.1.3 Japanese design codes . . . 15 2.1.2 Experimental investigations . . . 16 2.1.3 Numerical modelling . . . 19 2.2 Bouncing of a boulder on a granular medium . . . 20 2.2.1 Experimental investigations . . . 21 2.2.2 Numerical modelling . . . 24 2.3 Micromechanical properties of granular materials . . . 27 2.3.1 Bimodal character of load transmission in granular materials . . 27 2.3.2 The role of force chains in granular materials . . . 29 2.4 Numerical modelling based on a discrete element method . . . . 31 2.4.1 Introduction of discrete element method . . . 31 2.4.1.1 Calculation cycle . . . 31 2.4.1.2 Principle of the calculation . . . 32 2.4.1.3 Contact laws . . . 33 2.4.1.4 Critical time step . . . 34
2.4.1.5 Yade-DEM code . . . 35 2.4.2 Modelling of particle shape . . . 35 2.4.3 Energy dissipation in granular materials . . . 37 2.5 Conclusion . . . 39
2.1 Interaction between a boulder and a granular medium 13
Studies have been reported in the literature to understand the boulder-medium
interaction mechanisms by analytical models (e.g.Pichler et al.,2005), experiments (e.g.
Stoffel,1998;Calvetti et al.,2005;Plassiard et al.,2009;Plassiard and Donzé,2009) or
numerical simulations (e.g.Calvetti et al.,2005;Bourrier et al.,2008,2010). This state
of the art particularly reviews the studies concerning the interaction between a falling boulder and a granular medium, including the bouncing of a boulder on a granular medium.
2.1
Interaction between a boulder and a granular medium
2.1.1
Engineering practices
Design engineers adopt easy-to-use expressions to estimate the impact force, impact duration and block penetration. The principal parameters of the expressions include:
— M: Boulder mass [kg]; — W: Boulder weight [kN];
— R: Boulder equivalent radius [m];
— Vi: Impact velocity of the boulder [m/s];
— Hc: Falling height of the boulder [m];
— ϕ: Internal friction angle of the medium [◦];
— ν: Poisson’s ratio of the medium [-];
— ρ: Density of the medium [kg/m3]
— γ: Unit weight of the medium [kN/m3];
— e: Medium thickness [m];
— ME: Static compression modulus of the medium [kN/m2];
— g: Gravity acceleration [9.81 m/s2];
— Timp: Impact duration [s];
— P: Dynamic impact force [kN];
— Pmax: Maximum impact force [kN];
— Pint: Transmitted force on the bottom [kN];
2.1.1.1 Chinese design codes
Strictly speaking, Chinese design codes do not include specific sections dealing with the calculation of rockfall impact force, however, the impact force can be calculated
following suggestions from "Specifications for design of highway subgrades" (JTJ013-95,
1995) and "Technical design manual for railway engineering" (China railway eryuan
engineering group,1995).
InJTJ013-95(1995), the dynamic impact force is calculated as:
P= P(Z)S =2γZ(2 tan4(45◦+ ϕ 2) −1)S (2.1) Z =Vi v u u t2γgSW × 1 2 tan4(45◦+ ϕ 2) −1 (2.2)
where P(Z)is the unit resistance of the medium, S is rockfall equivalent spherical cross
sectional area.
In the "Technical design manual for railway engineering", the dynamic impact force is calculated as: P = WVi g Timp (2.3) Timp = 2e c (2.4) c = s 1−ν (1+ν)(1−2ν) × ME ρ (2.5)
where c is the compression wave velocity inside the medium [m/s].
The impact force calculated by these two expressions are actually average impact force instead of the maximum impact force. The underestimation of the impact force
might result in structural failure when subjected to impact (Ye et al.,2010). Therefore,
2.1 Interaction between a boulder and a granular medium 15
2.1.1.2 Swiss design codes
Swiss federal roads office proposed to calculate the impact force P and the penetration depth Z in the case of a boulder impacting a granular medium resting on a rigid slab
(ASTRA,2008): Z = MV 2 i 1000P (2.6) P=2.8e−0.5R0.7M0.4E tan ϕ(MV 2 i 2000)0.6 (2.7) Ad =CP (2.8)
where Ad is the static equivalent force transmitted on the bottom slab [kN], C is the
construction coefficient whose value depends on the rupture mode of the slab.
The approach of considering a statically equivalent load for assessing the stability of the structure may not be fully appropriate. The main reason is that this approach neglects some mechanisms that work during the impact and govern the actual response of the whole structure.
2.1.1.3 Japanese design codes
Based on experimental data and the elastic Hertz contact theory, Japanese road
association proposed to calculate the impact force as (Kawahara and Muro,2006):
P =2.108(1000M)(2/3)λ0.4H0.6c (2.9)
where λ is the Lamé coefficient of the medium [kN/m2], the most often used value of λ
is 1000 kN/m2.
This expression is proposed for the aim of rockfall protection structure design. It is
assumed that the rockfall is a rigid sphere having a specific gravity of 2.65 (Kawahara
and Muro,2006). This expression allows to obtain more realistic impact force, but the
Even though these expressions are very simple to use from a practical point of view, they are obtained from rough analytical estimations or drawn from specific experimental results. Without considering the detail mechanics that govern the interactions between the boulder and the medium, these expressions might be inappropriate for some impact cases.
2.1.2
Experimental investigations
Experimental investigations of boulder-medium interaction are usually conducted in small scales, half scales, or in few cases in real scales, associated with small or big boulder incident kinetic energies. Impact experiments deal with various impact problems and impact conditions. For instance, boulder impacts on natural or man-made slopes, rockfall
shelters, embankments of simple and complex configurations (e.g.Labiouse et al.,1996;
Stoffel,1998;Calvetti et al.,2005;Pichler et al.,2005;Peila et al.,2007;Peila,2011). Mea-surements are set in experiments to record the acceleration of boulder, the penetration depth of the boulder, the impact time, the stresses within the granular medium. The obtained experimental results were used for improving rockfall protection structure design.
Most part of the work concerns the response of a granular layer covering a rigid
structure, for the case of a boulder impacting a rock shed. Labiouse et al.(1996) conducted
half-scale impact experiments of a boulder impacting a granular layer covering a concrete
slab. The size of the slab is 3.2 m×3.2 m×0.2 m (Figure 2.1). Four essential parameters
influencing the design of rock shed structures were investigated: weight of blocks (100, 500, 1000 kg), falling height (0.25 to 10 m), cushion thickness (0.35, 0.5, 1.0 m) and material of the soil cushion (three different soils). Empirical expressions are proposed based on experimental results:
Pmax =1.765 M0.4E R0.2W0.6H0.6c (2.10)
In addition,Stoffel(1998) conducted similar experiments asLabiouse et al.(1996) and
proposed expressions to calculate impact force, transmitted force and penetration depth during a boulder impacting a granular medium:
Pmax =1.33 exp(1.5eR )M
1 3 E (tan ϕ)0.2E 2 3 pot (2.11)
2.1 Interaction between a boulder and a granular medium 17
Figure 2.1: Impact test devices (Labiouse et al.,1996)
Pint =2.6 R−0.24e−0.01exp( R
2.5e)M0.25E E0.75pot (2.12)
where Pint is the maximum transmitted force on the bottom, Epotis the potential energy
of the boulder.
In case of a boulder impacting a medium resting on a rigid wall, the expression is:
Pmax =1.35 R0.2exp(3eR)M0.4E (tan ϕ)0.2E0.6pot (2.13)
Calvetti et al.(2005) investigated experimentally the phenomenon of boulder
impact-ing granular soils typically used to reduce loads on shelters. Series of full scale tests were performed to investigate the influence of geometrical and mechanical properties of the
results of Calvetti et al. (2005) show that relative density of the superficial layers of the stratum is the key factor that determines the peak value of impact force, while the inclination of the stratum plays a less significant role.
Both the experimental results ofStoffel(1998) andCalvetti et al.(2005) proved that the
impact force transmitted to the rigid bottom from the impacted granular medium is much larger than the impact force on the boulder, with a ratio of 1 to 3. This ratio is inversely proportional to the layer thickness. The existence of a larger value of transmitted force on the bottom than the impact force is called dynamic effects. This phenomenon is also
observed in numerical simulations (Calvetti et al.,2005). In addition, the propagation
of compression waves within the medium is governed by the mechanical properties of
the granular material (Calvetti et al.,2005). For a given impact, the impact force and
the speed of compression waves in the granular soil are mainly affected by the elastic properties of the soil.
Pichler et al. (2005) designed real-scale experiments based on analytical relations,
the corresponding results were used to conduct back-analysis to obtain the indentation resistance of gravel. This permits to estimate of penetration depths caused by rockfall events which are beyond the experimental acceleration measurements. In addition, small
scale laboratory experiments of Degago et al. (2008) showed that the hemispherical
impactor induced higher impact force as well as less penetration as compared to the pyramidal impact boulder.
Gerber and Volkwein(2010) conducted 54 tests with two different concrete boulders
(800 kg and 4000 kg) dropped on two ground layers (0.5 m and 1.3 m). The deceleration curves show either two significant local maximum accelerations or one maximum and a plateau-like behaviour. The observations illustrated the importance of compaction in
the ground layer, which is consistent with the conclusion drawn byLorentz et al.(2006)
that layer compactness has a major effect in increasing the peak value of the transmitted impact force. The results of the 4000 kg block tests show a correlation between the
2.1 Interaction between a boulder and a granular medium 19 Pmax =1000M Vi Timp c Z= ViTimp c amax = Vi2 Z (2.14)
where c is a constant value.
2.1.3
Numerical modelling
An alternative approach for studying the impact mechanisms is through numerical
modelling. Plassiard and Donzé(2009) modelled the impact process of a boulder on
a granular medium with a discrete element method. Both quasistatic and dynamic behaviours of soil have been examined and additional contact laws were used to be rep-resentative. The impact corresponded to a 500 kg boulder hitting a 50 cm thick layer of a compacted soil, with a falling height of 10 meters. The impact force was well reproduced, while the transmitted force through the granular medium was less well modelled even with the introduction of additional dissipation laws (Figure 2.2).
(a)
(b)
Figure 2.2: Time evolution of (a) the deceleration of the boulder, (b) the force transmitted to the
Calvetti et al. (2005) performed numerical simulations with the aim of investigat-ing loadinvestigat-ing conditions characterised by different values of stratum thickness under a wide range of impact energy. A simplified DEM model of the experimental set-up is established, the stratum is represented by a 2 m thick assembly of about 10000 spheres with uniform diameter distribution between 0.1 and 0.3 m. The results of the numerical simulations show that the peak value of impact force may be conveniently correlated to impact energy (Figure 2.3(a)), although a more refined approach should consider the individual effects of boulder mass and falling height. In addition, for a given impact force, the stresses on the plate decrease with the thickness of the stratum. A linear correlation between impact force and stresses on the plate was proposed to describe the dynamic amplification effect that characterised the wave propagation within the stratum (Figure 2.3(b)).
(a) (b)
Correlation equation
Figure 2.3: (a) Impact force as a function of impact energy; (b) Stresses on the plate as function
of impact force (Calvetti et al.,2005)
2.2
Bouncing of a boulder on a granular medium
Among the motions of boulder (free falling, sliding, rolling, and bouncing) along the trajectory down the slope, bouncing, occurring when the falling block collides with the
slope surface, is the most difficult one to predict (Dorren,2003;Labiouse and Heidenreich,
2.2 Bouncing of a boulder on a granular medium 21
according to Newton’s second law. However, the interaction is a very complex process, the force on the boulder, the contact points or surfaces evolves with time depending on the substrate properties, rock properties and the kinematics of the boulder before the impact. The use of computer programs in rockfall simulations is one of the most popular
approaches for accounting for the bouncing of a boulder on a granular medium (Prisco
and Vecchiotti,2006;Bourrier et al.,2009;Lambert et al.,2013).
2.2.1
Experimental investigations
Most computer codes model the bouncing simply by adopting one or two resti-tution coefficients which are obtained by analytical, back-analysis, experimental and
numerical modelling results (Wong et al.,2000;Nouguier-Lehon et al.,2003;Heidenreich,
2004;Oger et al.,2005,2008;Bourrier and Hungr,2011;Vijayakumar et al.,2011). The
trajectory simulations are very sensitive to these restitution coefficients, and the
accu-racy of the simulations depends to a large extent on these parameters (Dorren et al.,2011).
��� ��� �� � � ��� ��� �� �� �� ��
Before rebound After rebound
Figure 2.4: Definition of incident (left) and rebound velocity components (right) for the rebound
The most commonly used restitution coefficients are expressed in terms of velocity or energy, indicating the amount of velocity or energy dissipated during the impact (Figure 2.4): RV = Vr Vi (2.15) RE = Vr2 Vi2 (2.16)
Rn = −Vrn
Vin (2.17)
Rt = Vrt
Vit (2.18)
where Vr and Vi are the incident and reflected velocity of the boulder respectively, Vin
and Vrn are the normal components of incident and reflected velocity respectively, Vit
and Vnt are the tangential components of incident and reflected velocity respectively.
Initially, the restitution coefficients are adopted as constant values irrespective the various impact conditions and the properties of boulder. For instance, restitution coeffi-cient used in Rocscience software are originally derived from analytical research results and back-analysis. Afterwards, more researches were conducted to investigate the effects of the properties of the boulder and the medium, as well as the boulder kinematics on
restitution coefficients (Wong et al.,2000;Nouguier-Lehon et al.,2003;Heidenreich,2004;
Oger et al.,2005,2008;Bourrier and Hungr,2011;Vijayakumar et al.,2011). Table 2.1 lists
the parameters that influence the restitution coefficients.
Table 2.1: Parameters that influence the bouncing of block
Substrate properties Block properties
Material properties Slope characteristics Block characteristics Block kinematics
Strength Slope angle Mass Translational velocity
Rheology Roughness Shape Rotational velocity
Surface fitting Size Incidence angle
Thickness Strength Orientation
The restitution coefficients are influenced by the mass of the block (Asteriou et al.,
2012,2013a), the impact velocity (Asteriou et al.,2012,2013a), the impact angle (Asteriou
et al.,2012), the shape of boulder (Chau et al.,1999;Wong et al.,2000). More specifically,
the experimental results ofAsteriou et al.(2013a) show that the coefficients decrease with
both the increase of the block mass and the impacting velocity. The results ofAzzoni et al.
(1995) shows that there is generally an increase trend in rolling velocity with increase in
dimension of the falling blocks, but little relationship between rolling velocity and shape parameter based on experiments conducted on debris slopes. Those studies pointed out
2.2 Bouncing of a boulder on a granular medium 23
ofChau et al.(1999) found that Rnincreases with the angularity of the boulders, a more
angular boulder will lead to lower rebound amplitude with rotation, with this induced rotation, the normal rebound velocity is reduced but the tangential velocity is increased
(Wong et al.,2000). Experiments emphasize a clear dependency of restitution coefficients
on parameters characterizing the kinematics as the impact velocity. The observation of
Chau et al.(2002) indicates that Rn increases with the slope angle, while there appears to
have no clear correlation between Rt and the slope angle. On the other hand, a very clear
increasing trend in the RV and REwith slope angle is observed.
Mechanical properties of the boulder are shown to have influence on the restitution
coefficients. The results ofAsteriou et al.(2013b) shows that the kinematic restitution
coefficients RE increases with increasing hardness and shows also an increasing trend
with the uniaxial compressive strength and the tensile strength.
In addition, the study ofWong et al.(2000) found that the restitution coefficients are
strongly affected by the elastic modulus of the platform: slopes with smaller value of
Young’s modulus result in lower restitution coefficients. Azzoni et al.(1995) shows that
the restitution coefficient ranges between 0.51 and 0.92 for rock and between 0.32 and 0.65 for debris.
Restitution coefficients that characterize the bouncing of boulder during rockfall
events should not be considered as constant. The normal (Rn), tangential (Rt) and
ener-getic (RE) coefficients of restitution measured during half-scale experimental study range
between the following values (Labiouse and Heidenreich,2009): Rn is between 0.003 to
0.257 (mean value of over all tests is 0.04), Rt is between 0.07 to 1 (the mean value over
all tests is 0.48); REis between 0.0003 to 0.336 (the mean value over all tests is 0.03).
Although the rough classification of restitution coefficients is relevant from a practical point of view, it is nevertheless not very satisfactory from a scientific point of view. The main limitations of these trajectory models include two aspects. First of all, these
restitution coefficients are usually obtained from field tests (Evans and Hungr, 1993;
Zhang et al., 2011), by back analysis (Budetta and Santo, 1994) or by analytical
esti-mations (Bozzolo and Pamini,1986;Azzoni et al.,1995). On one hand, they are just
rough estimations. On the other hand, they are usually obtained subjectively based on specific cases and cannot be generalized. Second, the restitution coefficients used in the models are mainly obtained based on global approaches, without detail consideration
of interactions between the boulder and the impacted granular medium. There are not enough investigation linking the restitution coefficients to the soil mechanisms. The bouncing of boulder on a granular medium is still poorly understood.
2.2.2
Numerical modelling
Hungr and Evans(1988) divided the existing computer models into two categories:
"rigorous" methods and lumped-mass methods. In the lumped mass analysis method, the block is considered to be a simple point with mass and translational velocity, rota-tional velocity is also considered in some cases. The advantage of lumped mass analysis method is the high efficiency in calculation and limited number of parameters to be calibrated. However, the parameters of such models are not very reproducible from one test site to another, besides, the model should be well calibrated by back-analysis method
before being used for a given site (Bourrier and Hungr,2011). In the "rigorous" models,
the size and shape of the blocks are assumed to be known "a priori" and all the block
movements, including those involving the block rotation, are considered (Stoffel,1998;
Descoeudres et al.,1999;Bourrier and Hungr,2011).
Among the "rigorous" modelling dealing with the bouncing of boulder,Bourrier et al.
(2008,2010) conducted simulations to investigate the energy propagation process inside
the granular medium subjected to a normal projectile impact based on a 2D discrete element method. The interactions between particles are governed by a contact model based on an approximation of the Hertz-Mindlin theory with the consideration of only frictional energy dissipation.
In order to characterize energy propagation, the evolution of all energy items during the impact process are observed on concentric crowns centred around the impact point. The concentric crowns are located at distances h from the impact point with a layer thickness of approximate 3 particle diameters (Figure 2.5). The micromechanical process occurring inside the impacted granular medium were investigated in short and long durations.
2.2 Bouncing of a boulder on a granular medium 25
Figure 2.5: Concentric crown (Bourrier et al.,2010)
The investigation shows that impact process starts with the partial energy exchange from the impacting boulder to the soil. This phase is followed by the propagation of a compression wave from the impact point to bottom wall of the sample. The initial stage can be divided into two successive phases: a compression phase associated with a local strain energy peak on the central crown, a restitution phase inducing a kinetic energy peak near the impact point. A second energy exchange from soil particles to the impacting particle can occur if the reflected wave reaches the soil surface before the end of the impact. The bouncing of the boulder is related to this second energy exchange.
In addition,Bourrier et al.(2008) conducted extensive 2D numerical simulations and
a boulder bouncing occurrence diagram was obtained (Figure 2.6). The local bouncing occurrence criterion is the change in the impacting particle’s vertical velocity sign after the interaction with the soil. The global bouncing criterion is defined as a percentage of local bouncing occurrences for varying impact points and fixed incident conditions. The diagram indicates that the rebound of boulder depends not only on the size of the
boulder itself, but also on the medium thickness. By dividing the (H, Rb) plane into
rebound and non-rebound domains, three impact regimes are observed (Figure 2.6): • For a small boulder (regime I), bounce occurs for any sample height;
• For a medium size boulder (regime II), bounce does not occur in all cases, the curve
decreases as Rb increases;
• For a big boulder (regime III), on the contrary, the curve increases as Rb increases.
Rbcrit Rm Rbmin Rm Rb Rm H Rm Rebound domain Non−rebound domain I II III
Figure 2.6: Definition of the impact regimes, where H is the height of the impact granular
medium, Rbis the radius of the boulder, Rmis the mean size of the grains, Rcritb is the asymptotic value between regime I and II, Rmin
b is the critical value between regime II and III (Bourrier et al.,2008).
This diagram was interpreted by Bourrier et al. (2008) from an energy exchange
point of view. The bouncing is closely related to energy transfers between the projectile and the soil. For a small impacting particle, the impact is mainly determined by the first interaction between the impacting particle and the soil. For an intermediate-sized impacting particle, the compression wave propagation through the sample is the lead-ing phenomenon. Impactlead-ing particle bounclead-ing is attributed to a second energy supply from the soil after the compression wave’s round trip through the sample. For a large impacting particle, bouncing is associated with the formation of a compact layer below the impacting particle.
The studies of Bourrier et al. (2008) provide new insights into the bouncing and
energy propagation processes, however, a more detailed layer division can be conducted since the behaviours of different parts of the same crown should be different due to different loading and boundary conditions. In addition, while the bouncing occurrence regime is obtained in 2D impact cases, the limitation is the difference between 2D simula-tions and 3D reality. Specially, energy dissipation in 3D simulasimula-tions might lead to the
2.3 Micromechanical properties of granular materials 27
restriction of the second regime because this regime is mainly caused by energy transfers associated with elastic strain energy propagation and small-particle rearrangements. In addition, the microstructure of the medium and micromechanics taking place at grain scales were proven to be key parameters that influence the response of the granular
medium (Oda and Kazama,1998;Radjaï et al.,1998;Tordesillas et al.,2014). Therefore,
further identification and quantification of the micromechanisms involved in the load transfer inside the impacted granular medium should be conducted.
2.3
Micromechanical properties of granular materials
The granular material, as a discontinuous medium, is heterogeneous with a disor-dered texture. The mechanical response of the granular medium generally depends on two aspects, one is the grain properties: size, shape, rigidity, friction, the other is their
ag-gregation: packing, void ratio, loading path, fabric tensor (Bardet,1994;Nouguier-Lehon
et al.,2003;Antony and Kuhn,2004;Ciamarra et al.,2005;Calvetti et al.,2005;Bourrier
et al.,2008;Kondic et al.,2012;Cambou et al.,2013). Particularly,Kondic et al.(2012)
modelled the impact of an intruder on a dense granular material based on a 2D discrete element method. The results indicate that polydispersity and related structural order, as well as frictional properties of the granular particles, play crucial roles in determining the impact dynamics.
2.3.1
Bimodal character of load transmission in granular materials
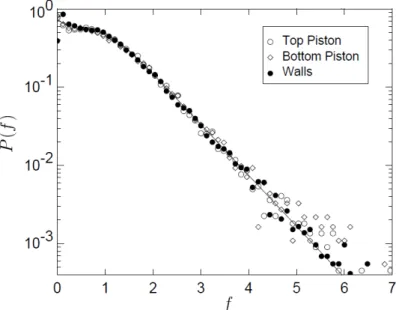
Experimental and numerical studies of the probability density distribution of contact forces show that, in all cases, the distribution decays exponentially at large forces and shows a plateau or possibly a small peak near the average force (Figure 2.7). Particularly,
the simulations ofCiamarra et al. (2005) show that the exponential decrease trend is
time-independent during a projectile’s deceleration in the medium. Compared to a Gaussian profile, the exponential tail indicates a significantly higher probability of an individual contact force greatly exceeding the mean force.