HAL Id: tel-01743913
https://tel.archives-ouvertes.fr/tel-01743913
Submitted on 26 Mar 2018
HAL is a multi-disciplinary open access archive for the deposit and dissemination of sci-entific research documents, whether they are pub-lished or not. The documents may come from teaching and research institutions in France or abroad, or from public or private research centers.
L’archive ouverte pluridisciplinaire HAL, est destinée au dépôt et à la diffusion de documents scientifiques de niveau recherche, publiés ou non, émanant des établissements d’enseignement et de recherche français ou étrangers, des laboratoires publics ou privés.
Functional study of mouse olfactory bulb inhibitory
circuits
Alvaro Sanz Diez
To cite this version:
Alvaro Sanz Diez. Functional study of mouse olfactory bulb inhibitory circuits. Neurobiology. Uni-versité de Strasbourg, 2017. English. �NNT : 2017STRAJ037�. �tel-01743913�
ÉCOLE DOCTORALE SCIENCES DE LA VIE ET DE LA SANTÉ
UPR 3212
THÈSE
présentée par :Álvaro SANZ DÍEZ
soutenue le : 20 Juillet 2017pour obtenir le grade de :
Docteur de l’université de Strasbourg
Discipline/ Spécialité : Neurosciences
Functional study of mouse olfactory
bulb inhibitory circuits
THÈSE dirigée par :
M DE SAINT JAN Didier Dr., Institut des Neurosciences Cellulaires et Integratives,
Strasbourg
RAPPORTEURS :
Mme BUONVISO Nathalie Dr., Centre des Recherches en Neurosciences de Lyon
Mme DIDIER Anne Pr., Centre des Recherches en Neurosciences de Lyon
AUTRES MEMBRES DU JURY :
M SCHLICHTER Rémy Pr., Institut des Neurosciences Cellulaires et Integratives,
Strasbourg
UNIVERSITE DE STRASBOURG
ÉCOLE DOCTORALE SCIENCES DE LA VIE ET DE LA SANTÉ
UPR 3212
THÈSE
présentée par :
Álvaro SANZ DÍEZ
soutenue le : 20 Juillet 2017
pour obtenir le grade de :
Docteur de l’université de Strasbourg
Discipline/ Spécialité
: Neurosciences
Functional study of mouse olfactory bulb
inhibitory circuits
THÈSE dirigée par :
M DE SAINT JAN Didier Dr., Institut des Neurosciences Cellulaires et Integratives, Strasbourg
RAPPORTEURS :
Mme BUONVISO Nathalie Dr., Centre des Recherches en Neurosciences de Lyon Mme DIDIER Anne Pr., Centre des Recherches en Neurosciences de Lyon
AUTRES MEMBRES DU JURY :
M SCHLICHTER Rémy Pr., Institut des Neurosciences Cellulaires et Integratives, Strasbourg
A mi padre, Gracias por todo
Objective statement
Neurons, the principal cell type in the nervous system, form a vast and complex network of interconnected cells in constant exchange of information. The diversity of neurons present in one single organism is great but they can be classified into two major categories, excitatory and inhibitory neurons. Excitatory neurons release neurotransmitters that depolarize targeted cells and facilitate, in return, the release of other messengers by the targeted cells. Inhibitory neurons have the exact opposite role. They release neurotransmitters that hyperpolarize their targets and temporally inhibit their activity.
Excitatory neurons carry the information coming both from the outside as well as the internal medium of each individual. This information is critical for all species to interact with their environment and cover all their vital needs. Although this information is crucial for survival it often needs to be tuned, shaped or sharpened so the information gets to be as accurate and precise as possible. Local inhibitory neurons play an active role in this process of information refinement modulating the activity of excitatory neurons within a particular circuit and constitute the majority of inhibitory neurons in the nervous system. However, they represent a great heterogeneous group of cells with different anatomical, physiological and molecular properties that suggest specific different functions that remain poorly understood. In recent years, many neuroscientists have joined minds, resources and strength in order to better understand the functional diversity of local interneuronal circuits. In the mammalian olfactory bulb, inhibitory interneurons are especially abundant and as an exception to the rule, they outnumber excitatory neurons. Among bulbar interneurons granule cells and periglomerular cells are the most common inhibitory cell types. However, each group of cells is heterogeneous and can be subdivided in subgroups due to intrinsic differences. The abundance and diversity across and within classes, makes fundamental to understand the physiological relevance of this heterogeneity. Moreover, the OB also receives centrifugal inhibitory inputs from the basal forebrain (Zaborszky et al., 1999; García-Llanes et al., 2010; Nuñez-Parra et al., 2013). However, these poorly studied projections densely innervate the olfactory bulb and have the potential to coordinate the timing of activity in the bulb, playing a major role in network activity coordination.
and synaptic organization of the olfactory bulb, paying special attention to the inhibitory interneurons, the circuits they form and their functional implications. Then, I present two chapters of results. In the first chapter, I highlight how my results, which have been incorporated in two papers (Najac et al., 2015; Benito et al., in preparation) provide a new classification of the diversity of periglomerular cell subtypes based on their synaptic inputs, membrane properties and molecular markers. In the second part of the results I intended to decipher the circuits that mediate the inhibition of these interneurons and their physiological relevance. This part is presented as a paper manuscript which will be submitted soon (Sanz Díez et al., GABAergic projections from the basal forebrain control multiple
inhibitory interneuron subtypes in the olfactory bulb). To do so, I used several transgenic
mouse lines and a combination of electrophysiological, optogenetic, immunohistochemical and neuronal tracing techniques that have allowed me to explore these questions. Each chapter of results is followed by a discussion that puts in perspective the achievements.
Table of contents
ACKNOWLEDGMENTS 1
LIST OF ABBREVIATIONS 2
RESUMÉ DETAILLÉ EN FRANÇAIS 3
INTRODUCTION 11
CHAPTER I. ANATOMICAL AND CELLULAR ORGANIZATION OF THE
OLFACTORY SYSTEM 12
1.1Odorant detection by Olfactory Sensory Neurons 12
1.1.1 The olfactory epithelium 12
1.1.2 Odor coding from the OSNs, from chemical to electrical 13 1.1.3 OSN activation creates spatial maps in the Olfactory Bulb 14
1.2 The olfactory bulb 15
1.2.1 The olfactory bulb is organized in concentric layers 15
1.2.2 Cellular organization 16
i. Excitatory cells of the OB 16
a. Mitral Cells 16
b. Tufted cells 17
c. Axonal projections of M and T cells in the olfactory cortex 18 d. External Tufted Cells 19
ii. Inhibitory cells of the OB 19
a. Periglomerular cells 20
b. Superficial Short Axon cells 20 c. Deep Short Axon cells 22
d. Granule cells 24
e. Interneurons from the EPL 25 f. Adult Newborn interneurons 26
1.3 The diversity of Periglomerular cells 28
1.3.1 Morphological diversity 28
1.3.2 PG cell subtypes express diverse molecular marker 30 1.3.3 PG cells have diverse membrane properties 32 1.3.4 Synaptic diversity: Type1 vs Type2 PG cells 33 1.3.5 Heterogeneity of postnatally-‐generated periglomerular cells 34
CHAPTER II. SYNAPTIC CIRCUITS AND PHYSIOLOGY OF THE
OLFACTORY BULB 36
2.1 Intraglomerular synaptic circuits 36
2.1.1 Glomerular activation of M/T and ET cells 36 2.1.2 Odor-‐evoked M/T cells activation in vivo 38
2.1.3 Glomerular activation of PG cells 39 2.1.4 Type 1 PG cells mediate presynaptic inhibition of OSN glutamate release 41 2.1.5 Type 2 PG cells mediate intraglomerular inhibition of principal neurons 42
2.2 Interglomerular lateral interactions 43 2.3 Dendro-‐dendritic interactions in the EPL 44
2.3.1 Local dendro-‐dendritic inhibition at reciprocal synapses 45 2.3.2 Lateral inhibition of principal neurons 47
2.4 Inhibition of GABAergic interneurons 47
2.4.1 Centrifugal inhibition 50
2.5 Centrifugal afferences to the OB 51
2.5.1 Glutamatergic cortical feedback 52 2.5.2 Cholinergic modulation from the basal forebrain 53 2.5.3 Serotoninergic afferences from the Raphe Nucleus 54 2.5.4 Noradrenergic afferences from the Locus 54
RESULTS 55
Results I: Characterization of PG cell diversity 56
Introduction 57
Results 59
Discussion 63
Article: Najac, M. et al., (2015) JNeurosci. 69
Results II: GABAergic projections from the basal forebrain control multiple inhibitory
interneuron subtypes in the olfactory bulb. 83
Manuscript 84
Discussion 108
Acknowledgments
I would like to thank in the first place Dr. Didier Desaintjan for giving me the opportunity to do my doctoral thesis under his supervision and accept me to join him in Strasbourg. I thank him for his scientific advice and guidelines in the professional field and his friendship in the personal life. Thank you for all your time, energy and patience. I’m glad we did this together.
Thanks to Dr. Philippe Isope and Dr. Bernard Poulain for hosting me on their lab and for their scientific advice. Thanks to Nuria Benito for sharing her thoughts, ideas and joy with me. A special thank you to Jean Luc Dupont for all the things he had taught me. Thank you to Francesca Binda for sharing her skills on stereotaxic viral injections with me. Thank you to Fred Dousseau, Kevin Dorgans, Anaïs Gangeray, Fernando Giuliani, Flavia Heid, Aline Huber, Seher Kossar, Orkan Ozcan, Sebastien Roux and Ludovic Spaeth for sharing everyday life in the lab I have learned from all of you and I have loved working next to you.
Thank you to Aurea Blancas, Catherine Estay, Tando Maduna and Elise Savier, four women that have specially inspired me during the last three years for their strength, intelligence and resources.
Thank you to Benjamin Bellanger, Dhanasak Dhanasobhon, Inés González, Sherazat Kavraal, Mari Carmen Medrano, Jérôme Wahis and Ivan Weinsanto, great colleagues that have become great friends.
Thanks to all my INCI colleagues that have me advice and provided material for my research, specially Anne Marie Heberlé, Matilde Cordero and Ipek Yalcin and of course to the Noemi, Sophie, Dom, Stephane and Edouard from the animal facility that have always taken so good care of my animals.
I want to specially thank Romain Sabathier for his personal support during all this years. He has been next to me to celebrate on the good occasions and to listen and support me during the hardest moments.
Thanks a lot, to my brother and my parents, with a special thought to my father, for giving me an education, believe in me and encourage me to always keep learning. Without it, I would have never come until here.
To all those people other that have somehow contributed to achieve this thesis by making part of my life these last years: David, Sylvain, Marion, Ara, Céline, Vero. And all my frieds and family that are still there despite the distance Thanks to all of you.
List of abbreviations
-A- ACh Acetylcholine AIS Axon initial segment
AMPA α-amino-3-hydroxy-5-methyl-4-isoxazolepropionic acid AON Anterior olfactory nucleus
-C- CB Calbindin
Chrna cholinergic receptor nicotinic α subunit ChR2 Channelrhodopsin 2
CR Calretinin -D- DA Dopamine
DAT Dopamine transporter dSAC Deep short axon cell
-E-
EGFP Enhanced green fluorescent protein EPL External plexiform layer
EPSC Excitatory postsynaptic current ET External tufted cell
EYFP Enhanced yellow fluorescent protein -G-
GABA gamma-Aminobutyric acid (γ-Aminobutyric acid)
GAD
GBZ Gabazine GC Granule cell GCL Granule cell layer GFP Green fluorescent protein GL Glomerular layer
-H-
HCN Hyperpolarization-activated cyclic nucleotide-sensitive cation
HDB Horizontal limb of the diagonal band of Broca
-I- IN Interneuron
IPL Internal plexiform layer IPSC Inhibitory postsynaptic current
-J-
JG Juxtaglomerular -L- LCA Loose cell attached LLD Long lasting depolarization LOT Lateral olfactory tract
-M- M Mitral
MCL Mitral cell layer
mGluR1 metabotropic glutamate receptor 1 -N-
NA Noradrenaline
NMDA N-Methyl-D-aspartic acid NOS Nitric oxide synthase
-O- OB Olfactory Bulb OC Olfactory cortex ONL Olfactory nerve layer OR Olfactory receptor OSN Olfactory sensory neurons
-P- PC Piriform cortex PG Periglomerular PV Parvalbumin
-R- RMS Rostral migratory stream
-S- SAC Superficial short axon cell SOM Somatostatin
sSAC Superficial short axon cell SVZ Subventricular zone -T- T Tufted TH Tyrosin hydroxylase TTX Tetrodotoxin -V- VGAT Vesicular GABA transporter VIP Vasointestinal peptide
Resumé en Français
Contexte
Le bulbe olfactif est le premier relai de l’information sensorielle olfactive dans le cerveau. Les neurones sensoriels détectent les particules odorantes dans l’épithélium nasal grâce à des récepteurs olfactifs. L’activation de ces récepteurs provoque une dépolarisation membranaire du neurone sensoriel qui génère des potentiels d’action et transmet l’information directement au bulbe olfactif (Buck and Axel, 1991). Chaque neurone sensoriel exprime un seul type de récepteur olfactif et tous les neurones exprimant le même récepteur projettent au même endroit dans le bulbe olfactif, plus concrètement, dans des structures sphériques nommés glomérules situés dans la couche la plus superficielle du bulbe. Au niveau glomérulaire, l’information olfactive est transmise aux cellules mitrales et à panache, les cellules principales qui projetent leurs axones vers des régions corticales supérieures pour le traitement de l’information.
Le bulbe olfactif est une structure organisée en couches. L’extérieur du bulbe est recouvert par les axones des neurones sensorielles qui forment la couche du nerf. Immédiatement sous cette couche se trouve la couche glomérulaire qui contient les glomérules. Autour des glomérules se situent divers types de neurones glutamatergiques, gabaergiques et dopaminergiques. Les glomérules sont des structures sphériques contenant un grand nombre de synapses entre les neurones sensoriels, les cellules principales glutamaterigiques et les interneurones. Dans les glomérules les neurones sensoriels forment des synapses avec les dendrites apicales des cellules mitrales et à panache. Les somas des cellules mitrales se situent alignés plus en profondeur et forment la couche des cellules mitrales. Du soma des mitrales sort une dendrite apicale. Elle traverse la couche plexiforme externe jusqu’à la couche des glomérules et un axone myélinisé qui traverse la couche plexiforme interne et la couche granulaire vers intérieur du bulbe. Ici, les axones des cellules principales forment un faisceau d’axones et abandonnent le bulbe formant le tracte latéral olfactif.
Dans le bulbe olfactif il y a environ 50.000 cellules mitrales et 150.000 cellules à panache (Meisami and Safari, 1981 ; Richard et al., 2010). Ces deux types de cellules possèdent une dendrite apicale qui projette dans un seul glomérule et des dendrites latérales qui projettent dans la couche plexiforme externe où elles font des synapses avec les dendrites des interneurones ici présentes (Macrides and Schneider, 1982 ; Orona 1984). Les cellules à panache sont légèrement plus petites que les cellules mitrales et leur corps cellulaire se situe au niveau de la couche plexiforme externe (Macrides and Schneider, 1982). Un glomérule reçoit les dendrites d’environ 10-15 cellules mitrales et le double des cellules à panache (Richard et al., 2010). En revanche, ces neurones projettent dans des endroits différents dans le cortex olfactif, ce qui fait perdre la somatotopie du bulbe (Poo and Isaacson, 2009; Apicella et al., 2010).
Dans le bulbe olfactif, la grande majorité des neurones sont des interneurones inhibiteurs. Il existe quatre types principaux d’interneurones bulbaires qui modulent de façon directe ou indirecte la décharge des cellules principales du bulbe : les cellules periglomerulaires (PG), les interneurones de la couche plexiforme externe, les cellules granulaires et les “short axon cells” (SAC). Les cellules PG sont une population hétérogène de petits neurones, qui entourent chaque glomérule dans lesquels elles établissent des synapses dendro-dendritiques avec les cellules mitrales (Panzanelli et al., 2007) de la même façon que les cellules granulaires et les interneurones de la couche plexiforme externe le font dans des couches plus profondes (Isaacson and Strowbridge, 1998). Au contraire, les SAC situées dans la couche des glomérules (superficielles) ou dans la couche des granules (profondes) possèdent de très longues axons ramifiés qui interagissent avec différents types de neurones (Eyre et al., 2008 ; Kiyokage et al., 2010).
Comme je l’ai mentionné auparavant les cellules PG forment une population hétérogène qui se reflète au niveau de leur anatomie, des marqueurs moléculaires, des propriétés membranaires ou encore de leur connectivité synaptique.
Morphologiquement il n’est pas clair si les cellules PG ont ou non un axone et quelle est l’étendue de leur arbre dendritique. De mon expérience, je suis prêt à affirmer que les cellules PG n’ont pas d’axone et que leur arborization dendritique est limité à un seul glomérule ou deux occasionnellement (Kosaka and Kosaka, 2010).
Au niveau moléculaire il est clair que les cellules PG sont des neurones GABAergiques par leur expression de GAD, l’enzyme de synthèse du GABA. Cependant, il existe des sous-groupes de neurones qui expriment d’autres marqueurs tels que les protéines de liaison au calcium Calbindine (CB) ou Calretinine (CR) ou encore la Tyrosine hydroxylase, l’enzyme de synthèse du précurseur de la dopamine (Panzanelli et a., 2007 ; Parrish-Aungst et al., 2007). Ceux-ci sont les trois marqueurs les plus communs parmi les cellules PG. Ils sont toujours exprimés de façon indépendante et dans les mêmes proportions, les neurones CR (+) étant deux à trois fois plus nombreux que les autres. De plus, les neurones qui expriment tyrosine hydroxylase ont des projections vers plusieurs glomérules, une morphologie qui ressemble plus aux “short axon cells” superficielles qu’aux PG (Kiyokage et al., 2010). Pour cette raison je ne considère pas ces neurones comme des PG.
Plusieurs études ont montré une large diversité parmi les patrons de décharge des cellules PG. Cela révèle ce qui reflète des différences de proprietés membranaires.
Au niveau synaptique, les cellules PG ont été historiquement classées comme type 1 ou type 2 en fonction de leurs entrées synaptiques excitatrices. Les cellules de type 1 reçoivent des entrées directes des neurones sensoriels olfactifs (Kosaka et al., 1998 ; Shao et al., 2009). En revanche, les cellules PG de type 2 reçoivent ses entrées excitatrices des dendrites des cellules mitrales et à panache(Kosaka et al., 1998 ; Shao et al., 2009). De plus, les cellules PG de type 2 peuvent être subdivisées en fonction de l’expression des marqueurs moléculaires CR et CB (Panzanelli et al., 2007).
Il existe de nombreuses évidences qui suggèrent que les cellules PG jouent un rôle majeur dans la modulation de la décharge des cellules mitrales et touffues (Shao et al., 2006; Fukunaga et al., 2014; Geramita et al., 2017). L’objectif de ma thèse a été de caractériser la diversité des neurones PG du bulbe et de déterminer l’origine de leurs entrées inhibitrices. Je me suis principalement servi de la technique du patch-clamp et de l’optogénétique sur des tranches de bulbe olfactif pour resoudre ces questions.
Le grand nombre d’interneurones GABAergiques dans le bulbe et leur diversité suggèrent l’importance de l’inhibition dans cette structure. C’est pourquoi l’impact de l’inhibition sur les neurones principales du bulbe a été longtemps étudié. Les interneurones GABAergiques du bulbe sont aussi sous influence inhibitrice, mais les circuits de cette inhibition ont été peu étudiés. Une des sources majeures d’afférences
GABAergiques du bulbe olfactif est la branche horizontale de la bande diagonale de Broca (HDB) (Garcia-Llanes et al., 2010 ; Niedworok et al., 2012 ; Nuñez-Parra et al., 2013). Cette structure est située dans la partie ventrale du téléncéphale et est constituée par des neurones GABAergiques et cholinergiques qui projettent vers les couches granulaire et glomérulaire du bulbe. Récemment il a été démontré que les projections GABAergiques de la HDB exercent une inhibition fonctionnelle des cellules granulaires mais cela n’a jamais été démontré pour les cellules PG (Nuñez-Parra et al., 2013).
Résultats
I. Caracterisation de la diversité des cellules periglomerulaires.
Pendant la première partie de ma thèse j’ai utilisé des lignées de souris transgéniques qui expriment une protéine fluorescente dans les populations des cellules PG CB(+) ou CR(+) afin d’étudier leurs propriétés intrinsèques et leur connectivité. J’ai pu contribuer à la caractérisation de ces deux sous-types de cellules en collaboration avec d’autres membres de l’équipe. On a pu démontrer que les cellules PG CB(+) sont représentatives d’un groupe plus large de PG de type 2 responsable d’une grande partie de l’inhibition intraglomerulaire. En revanche, les cellules PG CR(+), qui sont le type le plus abondant, conservent des propriétés de neurones immatures et ne semblent pas participer de façon très active à l’inhibition intraglomerulaire (Benito et al. in prep). J’ai aussi pu décrire un troisième sous type de cellules PG qui se différencie des PG CB (+) ou CR (+) par sa réponse à la stimulation du nerf olfactif. A la différence des groupes décrits précédemment cette stimulation provoque une bouffée de courants excitateurs postsynaptiques d’une durée beaucoup plus longue (>100ms). De plus, on a pu constater que ces cellules ont des propriétés membranaires intrinsèques à chaque groupe. Ces résultats démontrent que les neurones PG de type 2 sont plus complexes que ce que l’on croyait précédemment. II. Etude des circuits d’inhibition des cellules periglomerulaires.
Sur des tranches de bulbe on peut constater que toutes les cellules PG reçoivent des entrées synaptiques inhibitrices (IPSCs). Afin d’élucider l’origine de ces entrées j’ai premièrement exploré la possibilité que les cellules PG s’inhibent entre elles. Nos observations nous ont mené à écarter cette hypothèse puisqu’une stimulation glomérulaire suffisante pour provoquer la décharge par des cellules PG ne produit pas d’IPSCs sur les neurones PG de type 2. Par contre, quand une stimulation est faite dans la couche glomérulaire à plusieurs centaines de micromètres d’écart, ou même dans la couche granulaire il est possible de provoquer un IPSC monosynaptique dans toutes les différentes classes de PG de type 2. Ces résultats suggèrent que l’inhibition des cellules
PG de type 2 provient d’axones remontant des couches profondes du bulbe et parcourant horizontalement la couche glomérulaire. Dans le cas des cellules PG de type 1 nos expériences ont montré que la stimulation glomérulaire peut activer des entrées inhibitrices. Ces résultats laissent penser que les cellules PG de type 1 peuvent être inhibées par d’autres cellules PG mais cette option n’a pas été confirmée.
J’ai ensuite cherché à élucider l’origine de l’inhibition des neurones PG de type 2. L’un des possibles candidats pour cette inhibition sont les “short axon cells” profondes. Certaines de ces cellules ont leurs somas dans la couche granulaire et projettent leurs axones à travers la couche des glomérules. De plus, il existe des évidences anatomiques qui suggèrent que ces cellules font des synapses sur des interneurones de la couche glomérulaire (Eyre et al., 2008 ; Burton et al., 2017). Pour étudier cette hypothèse, j’ai recouru à une approche opto-génétique en utilisant la lignée transgénique murine Thy1-ChR2-EYFP. Ces animaux expriment une protéine-canal actionnable par la lumière (ChR2) couplée à une protéine fluorescente (EYFP) sous le control du promoteur Thy1. Sur des tranches aiguës du bulbe olfactif de souris Thy1-EYFP-ChR2 j’ai constaté que les cellules PG de type 2 répondent à une stimulation lumineuse par des IPSCs monosynaptiques. Ce constat montre que les neurones responsables de cette inhibition expriment la ChR2 dans cette lignée. J’ai aussi constaté que la même stimulation lumineuse provoque des IPSCs similaires au niveau des cellules granulaires et des SAC profondes. Or, mes enregistrements démontrent que ni les SAC, ni aucun autre type d’interneurone bulbaire, n’expriment ici la ChR2. Par conséquent, si ces résultats n’excluent pas l’inhibition des cellules PG par des “short axon cells”, ils suggèrent qu’il y a aussi une voie GABAergique extrabulbaire qui pourrait exercer son influence sur les principaux types d’interneurones du bulbe olfactif.
L’objectif suivant a été de déterminer l’origine de ces afférences. On a établi alors l´hypothèse que les neurones PG du bulbe sont inhibés par des neurones GABAergiques provenant de la HDB. Conformément à cette hypothèse j’ai montré une forte expression de ChR2 dans la HDB des souris Thy1-ChR2-YFP. Pour la confirmer, j’ai effectué une ablation unilatérale de la HDB par injection locale de NMDA à forte concentration. J’ai ensuite enregistré l’inhibition des interneurones bulbaires et comparé les deux hémisphères. Mes résultats indiquent que la probabilité d’induire
avec la lumière des réponses inhibitrices dans les interneurones du bulbe olfactif est plus faible cöté lésé que du côté contrôle.
Afin de raffiner mon approche et vérifier l’implication de la HDB dans l’inhibition des interneurones du bulbe, j’ai induit une expression locale et sélective de ChR2 dans les neurones GABAergiques de la HDB. J’ai utilisé lors de ces expériences des souris qui expriment Cre spécifiquement dans les neurones GABAergiques. Pour cela, j’ai injecté dans la HDB des souris transgéniques Dlx 5/6-Cre une construction virale floxée codant pour la ChR2. Ces expériences ont révélé une forte expression de ChR2 des afférences GABAergiques de la HDB ainsi que dans leurs axones dans toutes les couches du bulbe olfactif. Mes expériences d’électrophysiologie sur tranche ont montré que dans les animaux ayant subi ces injections, un flash de lumière est suffisant pour évoquer des IPSCs monosynaptiques dans les cellules PGs de type 2 appartenant aux trois groupes décrits précédemment. Cependant, les IPSCs reçus par les différents types de cellules PG de type 2 semblent avoir des cinétiques différentes. De plus, on a observé que les afférences GABAergiques de la HDB inhibent aussi les cellules granulaires ainsi que les SAC profondes. Ces résultats confirment que les projections GABAergiques provenant de la HDB sont envoyées dans toutes les couches du bulbe olfactif et qu’elles contactent les trois types majeurs d’interneurones dans le bulbe olfactif.
Finalement, on s’est intéressés à l’impact fonctionnel des afférences de la HDB sur la décharge des cellules PG. On a examiné les effets de l’IPSC évoqué par la lumière dans des tranches de bulbe olfactif des souris Dlx 5/6-ChR2-EYFP. Dans des enregistrements en cellule attachée des cellules PG on a pu constater que l’activation des fibres en provenance de la HDB peut altérer le patron de décharge de trois façons différentes. Dans un premier groupe de cellules l’IPSC produit une excitation de la cellule qui produit un seul potentiel d’action. Dans le deuxième groupe, l’activation des fibres de la HDB par la lumière inhibe la décharge pendant ∼100ms. Enfin, dans un troisième groupe de cellules, l’activation de ces fibres a un effet inhibiteur suivi d’une excitation soutenue pendant plusieurs secondes. Des résultats préliminaires suggèrent que le premier groupe correspond aux PG CR(+) et le troisième aux PG dont la stimulation évoque une bouffée des courants excitateurs plus longue.
Les résultats obtenus pendant cette thèse approfondissent la diversité des interneurones periglomerulaires du bulbe olfactif et permettent une classification plus
approfondie. Ils démontrent aussi que la plupart des interneurones du bulbe olfactif sont sous le contrôle de la HDB, une région du cerveau qui pourrait par conséquent synchroniser l’inhibition dans le bulbe olfactif.
Chapter I. Anatomical and cellular organization of the olfactory
system
Chemosensation is the ability of metazoans to perceive the external chemicals present in their surrounding environment. Chemosensory systems (smell and taste) are crucial for many species to successfully achieve vital functions such as food seeking, predator or pray detection and mate recognition. In terrestrial animals, the olfactory system is specialized in the detection of volatile chemicals present in the air. In mammals, odorant particles present in the air enter the nasal cavity at each respiration. There, they bind to specialized receptors expressed by olfactory sensory neurons (OSNs) in the nasal epithelium. The odorant information is then transmitted to the olfactory bulb (OB) where it is transformed in a spatial and temporal code. Olfactory bulb principal neurons finally transfer the sensory information to the olfactory cortex for further processing of the olfactory perception. In this chapter I will describe the anatomical and cellular organization of the mammalian olfactory system, from the olfactory epithelium to the highest regions of the brain. I will pay special attention to the organization of the olfactory bulb, a spherical structure organized in layers, bilaterally located in the rostral extremity of each hemisphere of the brain.
1.1Odorant detection by Olfactory Sensory Neurons
1.1.1 The olfactory epithelium
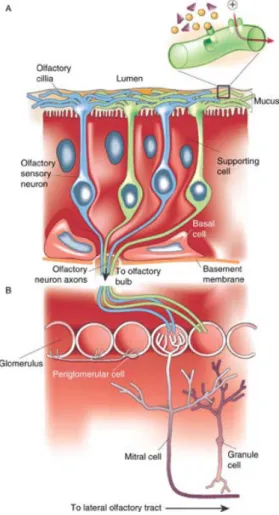
The olfactory epithelium is located in the caudal region of the nasal cavity. It is composed of basal and supporting cells and contains the soma of millions of OSNs. OSNs are bipolar neurons with apical ciliate dendrites that bath in the olfactory mucosa, a diffusing medium for volatile odorant molecules secreted by the olfactory epithelium (Figure 1A). From the basal pole of the OSN somas arise long non-ramified axons that leave the olfactory epithelium and gather in bundles forming the olfactory nerve. The axonal terminals of OSNs project directly in the most superficial layer of the OB, making synapses with bulbar principal neurons inside concrete spherical structures called glomeruli. OSNshave an average lifespan of 30-40 days, and are continuously renewed from basal cell division (Costanzo, 1991; Caggiano et al., 1994).
1.1.2 Odor coding from the OSNs, from chemical to electrical
OSN cilia express seven transmembrane domain G-protein-coupled receptors called olfactory receptors (OR) (Buck and Axel, 1991). When an odorant binds an OR, the receptor interacts with the G-protein and the GTP-coupled ⍺-subunit (G⍺olf) stimulates adenylyl cyclase type III. The resulting cAMP increase induces the opening of nucleotide-gated cation channels and the entrance of cations (Na+ and Ca2+ ions) into the cell. As a result, OSN membrane depolarizes and generates action potentials that directly transmit the odor information to the OB (Figure 1B)(Buck and Axel, 1991; Firestein, 2001)
ORs are encoded by a family of ~1000 genes for mouse and rat, ~600 genes for humans and ~100 genes in zebra fish with five conserved amino acid motifs that differentiate them from other seven transmembrane domain G-protein-coupled receptors (Buck and Axel, 1991; Parmentier et al., 1992; Mombaerts, 1999). OR expression is monoallelic, ensuring that each OSN only expresses one type of OR (Buck and Axel, 1991; Ressler et al., 1993; Vassar et al., 1993). The olfactory epithelium is divided in four zones or stripes. OSNs
Figure 1. Anatomical representation of the olfactory epithelium and OSN projections. (A) Odorant molecules
bind to OR on the surface of OSN cilia provoking changes in the membrane conductance of the cells. The newly generated odor code is directly sent to the OB. (B) OSN axons make synapses onto mitral cells apical dendrites. The information is transmitted to higher regions though the principal cells axons to be integrated and processed (Adapted from Fierstein, 2001)
expressing the same OR are located in the same zone, but their distribution in that zone is stochastic (Ressler et al., 1993; Vassar et al., 1993; Mombaerts et al., 1996). OSNs expressing the same OR converge in two glomeruli per bulb, distant and symmetrically positioned in each OB, and each glomerulus exclusively receives inputs from OSNs expressing the same OR (Ressler et al., 1993; Vassar et al., 1993; Mombaerts et al., 1996). The glomerular map is precise and conserved among individuals of the same species, as well as among different species like mouse and rat (Potter et al., 2001; Mombaerts, 2006; Imai and Sakano, 2007; Soucy et al., 2009).
1.1.3 OSN activation creates spatial maps in the Olfactory Bulb
ORs have a low selectivity for odorants. Thus, different odorants with similar chemical properties can bind to the same OR and one odorant can also bind to several ORs. Such effect increases with odor concentration (Friedrich and Korsching, 1997; Rubin and Katz, 1999; Wachowiak and Cohen, 2001; Bozza et al., 2004; Brunert et al., 2016). As a result, each odorant molecule, depending on its concentration, will activate a specific group of glomeruli forming a spatial map at the surface of the bulb. These maps are present in many different animal species such as insects, fish or mammals. Several techniques allow the visualization of odor-activated spatial maps in vivo. Some researchers have used intrinsic signaling to capture small activity changes from the glomerular pattern (Luo and Katz, 2001; Soucy et al., 2009; Banerjee et al., 2015). It has been recently reported that intrinsic imaging detection relies in water changes along OSN axons reflecting water movement following action potential propagation (Vincis et al., 2015). The activity of presynaptic OSNs can also be monitored with voltage sensitive dyes (Friedrich and Korsching, 1997), calcium imaging (Lecoq et al., 2009; Soucy et al., 2009) or pH sensitive proteins detecting synaptic vesicle fusion (Bozza et al., 2004; Fleischmann et al., 2008). Others have monitored the activity of postsynaptic neurons using calcium or voltage-sensitive probes (Spors and Grinvald, 2002; Davison and Katz, 2007; Tan et al., 2010) demonstrating that spatial activation maps detected at the postsynaptic level match well with those revealed at the OSN presynaptic level.
Different odorants from similar chemical classes activate clusters of glomeruli in specific regions of the bulb (Johnson and Leon, 2007). Yet, this organization is not precise and nearby glomeruli do not present more similarities in their odor sensitivity than distant
glomeruli (Soucy et al., 2009). Moreover, the activation of the spatial map follows temporal dynamics. In mammals, the input frequency from the OSNs to the OB is primarily determined by the respiration frequency but OSNs coding for different odorants have distinct temporal dynamics and activate odor-specific sequences of glomeruli (Spors et al., 2006).
1.2 The olfactory bulb
1.2.1 The olfactory bulb is organized in concentric layers
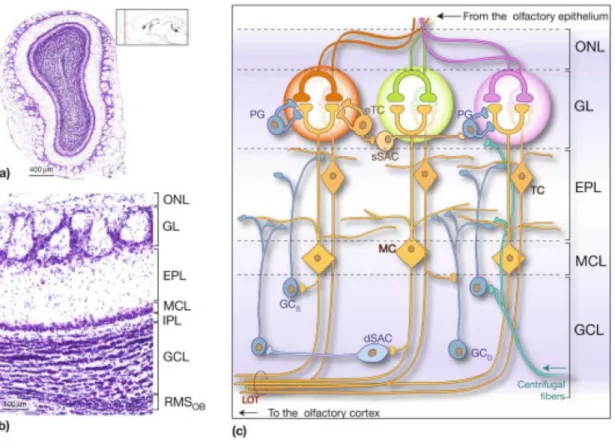
The anatomy of the OB is structured as a set of concentric layers recovered by the olfactory nerve forming the Olfactory Nerve Layer (ONL). Aligned glomeruli form the Glomerular layer (GL) just below the ONL. Diverse GABAergic, glutamatergic and dopaminergic neurons, collectively called juxtaglomerular (JG) cells, surround each glomerulus. Glomeruli are spherical neuropils containing a high density of synapses. They are highly compartmentalized with OSN projection zones and non-OSN zones (Chao et al., 1997; Kasowski et al., 1999). In the OSN-zones, OSNs make synapses with the apical dendrites of mitral and tufted (M/T) cells, the principal glutamatergic cells of the bulb. The non-OSN glomerular zones contain dendro-dendritic synapses between M/T cells and interneurons and between interneurons. M cell somas are aligned in a single plane forming the Mitral cell layer (MCL). From the M/T cell somas arises their apical dendrite, crossing the External Plexiform layer (EPL) up to the GL, and a myelinated axon that crosses the Internal Plexiform layer (IPL) and the Granule cell layer (GCL) towards the core of the bulb, gathering into axonal bundles to form the Lateral Olfactory Tract (LOT) which constitutes the main bulbar output to higher brain regions. The most inner part of the OB layers is formed by the Rostral Migratory Stream (RMS), the access pathway for newborn cells (Figure 2).
Figure 2. Laminar organization of the OB. (a) Nissl staining of a coronal section of OB. (b) Inset of A to highlight
all the layers. Outside-in: Olfactory Nerve Layer (ONL), Glomerular Layer (GL), External Plexiform Layer (EPL), Mitral Cell Layer (MCL), Internal Plexiform Layer (IPL), Granule Cell Layer (GCL), RMS (Rostral Migratory Stream). (c) Scheme of the OB layers and principal cell types. Glutamatergic cells are represented in yellow (M/T cells), GABAergic cells appear in blue (PG cells, GC and dSAC) and GABA/dopaminergic cells in pale orange (sSAC). From Lepousez and Lledo, 2013.
1.2.2 Cellular organization
i. Excitatory cells of the OB
In each OB there are around 33.000-70.000 M cells and 100.000-160.000 T cells
(Meisami and Safari, 1981; Richard et al., 2010). Although much less abundant than inhibitory neurons, bulbar excitatory neurons have the important role of receiving olfactory information from the outside and transferring it as a spatiotemporal sensory code directly to higher processing areas of the brain, without any thalamic relay in contrast with other sensory systems.
a. Mitral Cells
M and T cells are the principal glutamatergic neurons of the bulb. M cells present piriform somas of 20-30 µm diameters, the largest in the OB. Several dendrites arise from
the M soma. A thick primary apical dendrite crosses the EPL and projects inside a single glomerulus were it densely ramifies forming an apical tuft (Macrides and Schneider, 1982; Orona et al., 1984). According to recent studies, only 10-15 M cells project into the same glomerulus (Richard et al., 2010; Ke et al., 2013; Kikuta et al., 2013). These so called “sister” M cells are dispersed within a 4-7 fold larger radius than the average radius of a glomerulus and intermingled with other M cells projecting into different glomeruli (Buonviso et al., 1991; Ke et al., 2013; Kikuta et al., 2013). M cells also emit several lateral dendrites that project into the inner part of the EPL, spreading parallel to the MCL (Figure 3A). These dendrites ramify and extend over up to one millimeter making synaptic dendro-dendritic contacts with GABAergic interneurons (Mori et al., 1983; Kishi et al., 1984; Orona et al., 1984).
Figure 3. Morphology of mitral (A) and tufted cells (B). M/T cells apical dendrite projects into one glomerulus
where it densely ramifies and forms a tuft. Lateral dendrites arising close to the soma project in the EPL parallel to the bulbar layers. Cells filled by iontophoresis after Horse Radish Peroxidase injection (asterisk shows injection site) (modified from Orona et al., 1984).
b. Tufted cells
T cells anatomy is very similar to M cells. However, their somas are smaller (15-20µm) and distributed across the EPL. Since Cajal, T cells have been classified as deep (or internal), intermediate (or medial) and superficial (or external) depending on the position of their
soma in the EPL. Like M cells, they have one single apical dendrite that projects into one glomerulus and emit long lateral dendrites expanding horizontally across the intermediate and superficial portion of the EPL (Macrides and Schneider, 1982) (Figure 3B). However, the number of T cells projecting into one same glomerulus is around 2-3 fold larger than M cells (Meisami and Safari, 1981; Kikuta et al., 2013). T cells have lateral dendrites that occupy the upper half of the EPL whereas M cell lateral dendrites occupy the deepest half. As I will describe later, the functional properties of T cells also resemble those of mitral cells (See chapter 2.1.1), albeit with some small differences.
c. Axonal projections of M and T cells in the olfactory cortex
A major difference between M and T cells resides in their axonal projection. Several anatomical studies show that M and T cells axons target different regions of the olfactory cortex (OC) (Scott, 1981; Ghosh et al., 2011; Miyamichi et al., 2011; Sosulski et al., 2011; Igarashi et al., 2012). The OC is located in the ventral and ventrolateral portion of the forebrain and composed of several cortical and striatal subregions that differ in their output and local circuits. Thus, the anterior olfactory nucleus (AON), tenia tecta, dorsal peduncular cortex, piriform cortex (PC), olfactory tubercule, cortical amygdala, granular insulata and the entorhinal cortex are all part of the OC, the PC being the principal structure of this complex ensemble. The axons of T cells are shorter and project to discrete zones in anterior areas of the OC (AON, anterior PC, and olfactory tubercle). In contrast, M cells have much longer and complex axon anatomy with a high number of collateral ramifications that disperse and project to all OC areas (AON, the olfactory tubercle, the PC, the cortical nucleus of the amygdala and the entorhinal area)(Igarashi et al., 2012).
The OB spatial organization in well-defined odor-evoked spatial maps of activated glomeruli is lost in the OC. Thus, a single M cell which is activated by OSNs expressing the same OR sends collaterals to several pyramidal cells and a single pyramidal cell receives inputs from M cells associated with distinct glomerular units (Poo and Isaacson, 2009; Stettler and Axel, 2009; Apicella et al., 2010). As a result, a single odorant activates an ensemble of pyramidal cells scattered across the cortex.
d. External Tufted Cells
External T cells have recently received a lot of attention. They are a particular subtype with unique properties that distinguish them from other T cells located in or close to the GL. This subtype, that has often been called ET cell, has a 10-15 µm soma located in the ventral part of the GL, a single apical dendrite that projects inside a glomerulus, and in contrast to M and T cells, no lateral dendrites suggesting that it does not interact with granule cells (GC) (Hayar et al., 2004b; Antal et al., 2006). The absence of lateral dendrites, which is somehow controversial perhaps because they can be confounded with basal dendrites, is however, not the only feature that differentiates ET cells from other T cells. ET cells spontaneously fire bursts of action potentials at theta frequencies, an activity that persists when synaptic transmission is blocked (Hayar et al., 2004a).This pacemaker activity is mediated by a unique repertoire of several voltage-dependent ion channels (Ih, INaP, ICaL, ICaT,…)(Hayar et al., 2004a; Liu and Shipley, 2008) that make ET cells hyperexcitable. We will see in chapter 2.1.1 that ET cells, thanks to their explosive membrane properties and strong OSN connections, have a critical role in driving the activity of the glomerular network and in shaping the synaptic activation of M and T cells. ET cells have an axon that projects into the EPL but the final targeting site remains unknown. It is therefore not demonstrated that they are, like M and T cells, real principal output neurons. However, the confusion persists in the literature and it is not rare that this subtype is considered as a principal neuron (see for instance Vaaga and Westbrook, 2016).
ii. Inhibitory cells of the OB
Inhibitory cells represent approximately 80-90% of the total cell population in the OB (Parrish-Aungst et al., 2007). OB interneurons have diverse morphologies, molecular markers expression, intrinsic membrane properties, synaptic connections and functions. Most of them, if not all, are constantly generated and integrated into the OB network throughout lifetime, including adulthood, from neural stem cells located in the walls of the subventricular zone (SVZ). The proportion and abundance of inhibitory cells along with their permanent renewal, suggest that inhibition in the OB is of great relevance for olfactory processing. In the following part I will describe the different subtypes of inhibitory interneurons present in the OB.
a. Periglomerular cells
Classically, periglomerular (PG) cells have been defined as small round (occasionally ovoid) JG cells with one or more thin dendrites that arborize within the depths or near the periphery of the glomeruli (Pinching and Powell, 1971; (Kosaka and Kosaka, 2010). Occasionally they give rise to a very thin axon coursing more or less tangentially between glomeruli and then ends by ramifying within one of them (Pinching and Powell, 1971). Precise quantification of PG cells is hard to assess. Yet, Parrish-Aungst et al. (2007) estimated that each glomerulus is surrounded by 400-450 PG cells, representing 60-70% of all juxtaglomerular neurons. PG cells are considered to be GABAergic interneurons. They express glutamate descarboxilase (GAD), the enzyme responsible for gamma-aminobutyric acid (GABA) synthesis and the vesicular transporter for GABA (VGAT), at presumed synaptic contacts facing clusters of GABAA receptors (Kosaka et al., 1998; Panzanelli et al., 2007; Parrish-Aungst et al., 2007). However, this cell population is highly heterogeneous and GABAergic markers are often associated with other non-overlapping markers. Such diversity is further supported by anatomical and physiological evidence. Characterizing PG cell diversity has been one of my objectives during my thesis and I will therefore dedicate a specific chapter (1.3) to the description of this complex heterogeneity.
b. Superficial Short Axon cells
Unlike what their name suggests, these bulbar inhibitory interneurons have a long ramifying axon that forms broad intrabulbar and interglomerular connections. Short axon cells (SACs) can be classified in two subgroups regarding the location of their soma:
superficial and deep SACs.
Superficial SACs (sSACs) are intermediate size (8-12 µm soma) juxtaglomerular cells that extend their projections throughout the GL. They are GABAergic/DAergic cells immunoreactive to the GAD67 isoform (Toida et al., 2000; Parrish-Aungst et al., 2007; Kosaka and Kosaka, 2008, 2009; Kiyokage et al., 2010) and to Tyrosine-hydroxylase (TH) and Dopamine transporter (DAT) (Kosaka and Kosaka, 2008, 2009; Kiyokage et al., 2010; Kosaka and Kosaka, 2010; Banerjee et al., 2015). However, two distinct populations of TH-expressing SACs with different morphologies and temporal origins have been described (Kosaka and Kosaka, 2008, 2009; Kiyokage et al., 2010). The first population projects its axons only into adjacent glomeruli (Figure 4A) (i.e. oligoglomerular projection). This sSAC subtype is mainly
generated postnatally, including during adulthood (Kosaka and Kosaka, 2009, 2010). The second group presents larger somata and an axon that expands throughout several hundreds of µm within the GL, making contacts within up to 50 glomeruli (Figure 4B). These large poliglomerular sSACs are mainly generated prenatally but not in juvenile or adult animals (Aungst et al., 2003; Kosaka and Kosaka, 2009; Kiyokage et al., 2010; Kosaka and Kosaka, 2010).
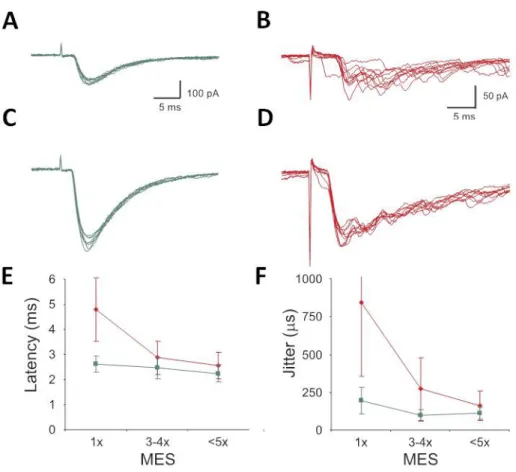
TH(+) sSACs have also been classified in two groups based on their excitatory input. Electrophysiological evidence suggests that only 30% of the population of dSACs receives a direct excitatory input from OSNs. The other 70% receives excitatory inputs from principal glutamatergic neurons (Figure 4C) (Kiyokage et al., 2010). These functional data seem contradictory with previous ultrastructural studies claiming that 70% of TH(+) JG neurons project their dendrites into the OSN-zone of the glomeruli where they make asymmetrical synapses with OSN terminals (Kosaka et al., 1997; Kosaka and Kosaka, 2005). However, recent physiological and confocal evidence suggest that all SACs receive both inputs, the majority coming from OSN axon terminals on distal parts of the dendrites (Kiyokage et al., 2017). Those distal OSN inputs may therefore be smaller and more difficult to detect than proximal excitatory inputs provided by principal glutamatergic cells (Hayar et al., 2004b; Kiyokage et al., 2010; Kiyokage et al., 2017).
Figure 4. Superficial Short Axon Cells.
(A,B) Morphology of poliglomerular (A) and oligoglomerular (B) GAD67(+)/TH(+)sSACs. Scale bar 100 µm. (C) Representative traces of sSAC monosynaptic excitatory OSN-evoked response (green trace) and polysynaptic excitatory OSN evoked response (red trace).
c. Deep Short Axon cells
As their name suggests, deep SACs (dSACs) are located in the deepest bulbar layers (IPL and GCL). Their somas are ovoid and can measure from 10 to 20 µm. dSACs can be classified into three groups based on the bulbar layer into which their axon projects: GL, EPL or GCL (Eyre et al., 2008). GL-dSACs have their elongated soma in the MCL and the IPL, and axons projecting up to the GL where they ramify and horizontally expand over several hundreds of µm. In addition, long dendrites arising from the soma project into the MCL and the IPL. In early studies, these cells were identified as Horizontal cells or Golgi cells (Schneider and Macrides, 1978). EPL-dSACs soma are located in the GCL and their axon cross the MCL and ramify in the EPL while dendritic ramifications are restricted to inframitral layers. These cells where previously known as Blanes cells or Cajal cells (Schneider and Macrides, 1978). Finally, GCL-dSACs soma and axonal projections are restricted to the IPL and GCL. Interestingly, (Eyre et al., 2008) and (Kosaka and Kosaka, 2007) suggest that some GCL-dSACs project axon collaterals outside the OB, towards higher olfactory brain structures like the PC or the AON, establishing the idea of inhibitory bulbar projections. All these cellular types are illustrated in Figure 5.
Diverse dSACs express a wide range of molecular markers. Classical interneuronal markers such as Calbindin (CB), Nitric oxide synthase (NOS) or vasoactive intestinal peptide (VIP) label small subpopulations, whereas, voltage-gated potassium channel subunits Kv2.1, Kv3.1b, Kv4.3 and the GABAA receptor α1 subunit are present in 70-95% of dSACs, without any subtype-selective expression. It is thus complicated to selectively identify dSACs subpopulations (Eyre et al., 2009). Two studies, however, have found markers of GL-dSACs. 20% of dSACs, preferentially GL-dSACs, are immunoreactive to the metabotropic glutamatergic receptor 1α (mGluR1α) (Eyre et al., 2009). However, mGluR1α is not selectively expressed by SACs but also strongly by M cells (Vandenpol, 1995). In a recent study, (Burton et al., 2017) identified the nicotinic cholinergic receptor α2 subunit (chrna2) as a selective marker of GL-dSACs, using it to explore the synaptic and membrane properties of this specific cell subtype (Burton et al., 2017). Unfortunately, this marker is also expressed by other neuronal types that project into the OB, making it complicated to use chrna2-cre mice to selectively manipulate GL-dSACs.
Figure 5. Deep Short Axon Cells. (A-F), Examples of Post-hoc reconstruction of biocytin filled dSACs. (A and B)
GL-dSACs have their soma and dendrites located in the IPL, the axon and its collaterals project and ramify in the GL. (C and D) GCL-dSACs: all the parts of the cell are located in the GCL. (E and F) EPL-dSACs: their somas are located in the GCL and their axons densely ramify within the EPL. Gray scale bars A-F 50 µm. Insets in B, C and F show cell response in current clamp to 100pA/1s depolarizing step. Scale 10mV/200ms. The color bands represent the edges of bulbar layers. G, Electron microscopy photograph of a synaptic contact (arrow) between a biocytin filled GL-dSAC (b) and the soma of a PG cell. Bottom-right, image enlarged. Scale bars 500nm, 2µm. (Modified from Eyre et al., 2008).
dSACs membrane properties are divergent among the three subpopulations. EPL-dSACs and GCL-EPL-dSACs have, for example, lower spontaneous firing rates than GL-dSAC but all of them present a regular firing profile in response to a depolarizing current (Figure 5B and 5F). However, some GL-dSAC can also fire bursts of action potentials (Eyre et al., 2008; Burton et al., 2017). There are also marked differences in their membrane resistance values which reflect differences in membrane channel expression. Thus, EPL-dSACs have lower membrane resistance values (~160 MΩ) than GC-dSACs (~400 MΩ) or GL-dSACs (~300 MΩ).
Functional and anatomical evidence suggest that dSACs only target GABAergic interneurons. Electron microscopy images show symmetric synapses from dSACs onto GC and PG cells (Figure 5G) (Eyre et al., 2008). Paired recordings between dSACs and GCs have further demonstrated functional connections (Pressler and Strowbridge, 2006; Eyre et al., 2008), while optogenetic experiments supported functional connections between dSACs and PG cells (Burton et al., 2017). The heterogeneous morphologies and membrane properties of dSACs together with the diversity of their cellular targets suggest that different types of dSACs could execute different inhibitory functions.
d. Granule cells
GC are the most abundant cells in the OB, some estimations oscillate between 6x10⁶ to 107 GCs (Parrish-Aungst et al., 2007; Richard et al., 2010). GCs are small GABAergic neurons (6-8 µm) disposed in the inner part of the bulb, forming the GCL. GCs are axonless but use a ramifying apical dendrite to interact with M and T cells lateral dendrites in the EPL. GC dendrites are covered with synaptic spines that host reciprocal contacts with the lateral dendrites of principal cells (Figure 6) (Mori et al., 1983; Orona et al., 1983; Geramita et al., 2016). GCs have been divided into three different types regarding their anatomy (Figure 6). Type I GC somas have a widespread distribution in the GCL and their dendrites are present all the way from the MCL to the upper part of the EPL, suggesting that they establish synapses with the lateral dendrites of M and T neurons. Type II GC somas are located deeply in the GCL and their dendrites project to the deepest portion of the EPL, right above MCL, establishing contacts more likely with M cells lateral dendrites. Finally, type III GCs have their somas in the most superficial fraction of the GCL and their apical dendrite projects to the outer portion of the EPL, suggesting preferred interactions with T cells lateral dendrites (Mori et al., 1983; Orona et al., 1983). GC also have relatively short basal dendrites in the GCL, covered in synaptic spines as well but that most likely receive axonal inputs from M/T cell axon collaterals (Halabisky and Strowbridge, 2003) and from centrifugal projections (Boyd et al., 2012; Markopoulos et al., 2012; Nunez-Parra et al., 2013). More recently, Merkle and colleagues described type IV and type V GCs (Merkle et al., 2014). Type IV GC soma and dendrites are located in the GCL and rarely overpass the MCL, while type V GC have their soma in the MCL and do not have basal dendrites. Only few molecular markers have been associated to GCs. Some superficial GCs are responsive to calretinin (CR) staining
(Batista-Brito et al., 2008) and 5T4, a leucine-rich-repeat transmembrane protein (Imamura et al., 2006; Yoshihara et al., 2012).
Figure 6. Granule cells. Examples of
different morphologies of GC obtained with Camera lucida following HRP staining processed with Hanker-Yanes method. Asterisk indicated HRP injection site. Dotted lines represent the limits of GL and MCL (Orona et al., 1983
e. Interneurons from the EPL
GABAergic interneurons with heterogeneous morphology are also found in the EPL. These cells are immunoreactive to several molecular markers like somatostatin (SOM), parvalbumin (PV), VIP or CR (Schneider and Macrides, 1978; Lopezmascaraque et al., 1989; Kosaka et al., 1994; Toida et al., 1994; Crespo et al., 2002; Shepherd et al. 2004). Most of these cells are axonless and make reciprocal interactions with MCs lateral dendrites. PV(+) are the most common interneuron cell type in the EPL and around 90% of them co-express corticotropin-releasing hormone (Huang et al., 2013). PV(+) cells are fast spiking neurons that make reciprocal dendritic and non-reciprocal perisomatic synapses with ~60% of the surrounding M cells, in contrast to GCs that make synapses with a much lower number of surrounding M cells (~5%). In addition, PV(+) EPL-interneurons make perisomatic synapses onto M cells, a more effective inhibitory input than dendro-dendritic synapses to drive M cell inhibition. Thus, PV(+) neurons represent a powerful and broad source of M cell inhibition (Kato et al., 2013; Miyamichi et al., 2013).
SOM(+) neurons are located in the basal portion of the EPL, outlining the region where M cell lateral dendrites interact with GC. 50% of SOM(+) EPL-interneurons co-express PV (Lepousez et al., 2010b). SOM(+) cells were previously known as Van Gehuchten SACs. These cells were described as a subpopulation of axonless EPL interneurons with a
medium-sized fusiform soma, from which emerge one or two thick and highly varicosed dendrites that arborize next to the cell body forming a dense ovoid dendritic field (Schneider and Macrides, 1978; Lopezmascaraque et al., 1990; Brinon et al., 1992; Kosaka et al., 1994). The functional implication of M cell-SOM(+) interneuron interactions is not clear although it has been proposed they have an active role in rhythm generation in the bulb (Lepousez et al., 2010a).
f. Adult Newborn interneurons
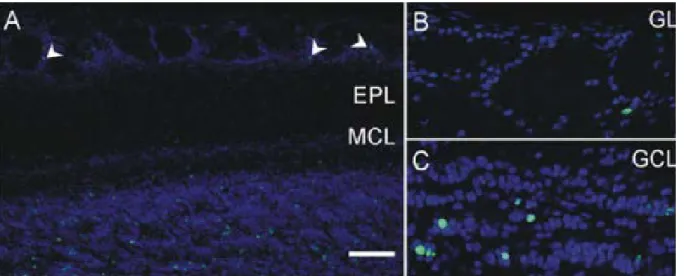
It has long been considered as a dogma that neurogenesis only occurred during pre- and perinatal stages. However, in the 1990 decade the combination of new techniques combining graft experiments, BrdU staining, confocal microscopy and transgenic mice generation proved that adult neurogenesis occurs in two niches of the brain: The Subgranular zone of the Hippocampus and the SVZ. For instance, (Lois and Alvarezbuylla, 1994) grafted labeled neuroblasts from a donor transgenic mouse into a non-transgenic adult host and after several days they observed that grafted and endogenous cells coming from the SVZ migrate to the OB through the RMS and differentiate into GCs and PGs as ilustrated in Figure 7 (Luskin, 1993; Alvarez-Buylla and Garcia-Verdugo, 2002).
Many studies have explored the maturation process of adult newborn cells. Much of this work has been conducted in adult newborn cells of the hippocampus, showing how these cells go under a complex and gradual process of maturation before becoming functional interneurons integrated in the circuits. The maturation degree of adult-newborn hippocampal cells can be defined by the expression of several molecular markers that gradually appear and follow up each other in time, such as Nestin, CR and Doublecortin. The membrane of these cells follows a functional maturation as well, highlighted by a number of factors. In early stages, immature neurons have very high membrane resistance, indicating lack of ion channels. They express small Na+ currents and are not able to fire full size action potentials. In early stages these cells do not establish synaptic contacts with other cells. The first synaptic inputs they receive are GABAergic but their high Cl- internal concentration makes GABA depolarizing. Later on, excitatory synaptic inputs appear and GABA becomes hyperpolarizing. Finally, neurite length that progressively increases while the new cell creates new synapses, is another marker of maturation (For review see Overstreet-Wadiche and Westbrook, 2006).
The maturation process is essentially similar for newborn neurons in the OB but far less studied. Newly generated GCs form the majority (~90%) of adult born interneurons in the bulb (Hack et al., 2005). During migration, adult-born GCs have a very simple morphology. When they arrive to their final destination, indistinctly in all regions of the GCL, their apical dendrite starts to develop and ramify reaching mature morphology when dendritic spines appear. Once mature, adult-generated GCs are able to fire action potentials and establish functional synapses with output neurons as well as with local interneurons (Carleton et al., 2003; Whitman and Greer, 2007; Kelsch et al., 2008; Bardy et al., 2010). This migration and maturation process can last from two weeks up to a month (Petreanu and Alvarez-Buylla, 2002). Although 50% of adult GC cells die within the first month following their birth (Lemasson et al., 2005; Magavi et al., 2005), new-born GCs generated during adulthood become functional and integrate the preexisting OB network.
PG cells are also constantly generated throughout adult life in the SVZ from where they migrate to OB and integrate the network (Alvarez-Buylla and Garcia-Verdugo, 2002; De Marchis et al., 2007; Whitman and Greer, 2007). However, only ~10% of adult newborn cells migrates and maturates in the GL. The maturation process of these cells follows a similar time-course as GCs and within 6 weeks these cells have mature-like spiny dendritic morphology, although not all the generated cells reach complete maturation (Whitman and Greer, 2009). As in GCs, the functional maturation of newborn PG cells is reflected by a gradual expression of voltage dependent ion channels, an increasing number of synaptic inputs as well as a growing expression of glutamate and GABA receptors (Belluzzi et al., 2003). In vivo, newborn PG cells are activated by odorants as early as 2 weeks after their birth. 2 weeks later, newborn PG cells are highly responsive and non-selective to odor stimuli (Livneh et al., 2014). Odor enrichment during newborn PG cells maturation narrows their odor response selectivity, suggesting that the physiological fate of newly generated PG cells is experience dependent (Livneh et al., 2014).
Figure 7. Adult generated interneurons in the Olfactory Bulb. (A) Low magnification image showing BrdU
labeled cells (green) 30 days after BrdU injection, in the glomerular (arrowheads) and granule cell layers. The number of new PG cells is small compared with the number of new granule cells. (B) High magnification view of the GL showing an individual BrdU labeled cell. (C)High magnification view of the GCL showing several BrdU labeled cells.Scale bar 100 µm in A and 38µm in B and C. (Whitman and Greer; 2007)
1.3 The diversity of Periglomerular cells
As I mentioned previously, PG cells form a heterogeneous population of interneurons. This heterogeneity is reflected by anatomical differences (Pinching and Powell, 1971; Hayar et al., 2004b; Kosaka and Kosaka, 2010; Kiyokage et al., 2010), expression of different molecular markers (Panzanelli et al., 2007; Parrish-Aungst et al., 2007; Whitman and Greer, 2007; Batista-Brito et al., 2008), different membrane properties (McQuiston and Katz, 2001; Hayar et al., 2004b; Murphy et al., 2005; Shao et al., 2009) and differences in synaptic connectivity (Toida et al., 1998; Hayar et al., 2004; Shao et al., 2009; Kiyokage et al., 2010). In the following chapter I will describe these differences in detail and explore the extension of the heterogeneity within the population.
1.3.1 Morphological diversity
The morphological diversity of PG cells lies in their axonal and dendritic projections. Historical controversy resides in the presence or absence of axon from these cells. Some authors consider that PG cells have axons based on Golgi staining showing a short and thin axon-like structure, different than dendritic processes, that projects within a distance of 3 or 4 glomeruli (Pinching and Powell, 1971; Lopezmascaraque et al., 1990). However, the Golgi staining technique only allowed axon detection in rare occasions, and instead of excluding
the axonal presence from other PG cells, it was argued that a staining problem prevented axon visualization in other PG cells. The presence of axon bearing PG cells has also been observed with confocal imaging of newborn interneurons (Tucker et al., 2006). Electron microscopy imaging of the axon initial segment (AIS) of axon-bearing PG cells revealed marked differences with common neuron AIS (Pinching and Powell, 1971). Classical AIS shows typical cellular machinery as neurotubules, free ribosomes, high vesicular concentration, Golgi apparatus and synaptic contacts among others. In contrast, if PG cells presumed AIS contains a limited amount of granular endoplasmic reticulum and many ribosomes, it lacks the presence of most elements cited above. More recently, Kosaka and Kosaka, (2011) did not detect the AIS classical molecular markers, i.e. sodium channel clusters, AnkyrinG, ßIV-spectrin and Phospho-IkBa in thin axon like projections from PG cells. In addition, studies in which PG cells where filled with biocytin then morphologically reconstructed ad-hoc suggest that at least a fraction of PG cells do not have axons (Hayar et al., 2004b; Kiyokage et al., 2010; Najac et al., 2015). In conclusion, it is possible that some PG cells do not have axons and others do, reflecting two distinct morphological groups. However, based on my own experience, most of (if not all) the PG cells that I have visualized during patch-clamp recording were axonless suggesting that axon bearing PG neurons described in some studies may in fact be sSACs.
PG cells also have diverse dendritic projections (Figure 8). Most PG cells have a small dendritic tuft that projects inside a single glomerulus (Pinching and Powell, 1971; Hayar et al., 2004b; Kosaka and Kosaka, 2005, 2007, 2008; Kiyokage et al., 2017). However, some PG cells send dendritic projections into two neighboring glomeruli or within the interglomerular neuropil. These PG cells have been called transglomerular cells. They express Secretagogin, a calcium binding protein, and perhaps may be classified as a new cell type (Kiyokage et al., 2010; Kosaka and Kosaka, 2013).
Figure 8. Periglomerular cells morphological diversity. Camera lucida drawins of calbindin immunostained PG
cells. Cells 1-5 and 8 extend their processes into a glomerulus, cell 9into two glomeruli and cells 6, 7, 10-13 extend their major processes into a glomerulus and other processes in the periglomerular region.Dotted lines represent the glomerular edges. Scale bar: 100 µm (Kosaka and Kosaka, 2010)
1.3.2 PG cell subtypes express diverse molecular marker
Considering the morphological differences among PG cells, it is hard to give a precise definition of what exactly a PG cell is. To narrow these criteria, immunohistochemical labeling is a common tool for identification of interneuron populations. Some of the classical molecular markers of interneurons are calcium binding proteins such as CR, CB or PV and neuroptides such as VIP or SOM (Demeulemeester et al., 1991; Kawaguchi and Kondo, 2002; Rudy et al., 2011). Immunohistochemical characterization of the OB in different mammal species has revealed that most PG cells are immunoreactive to at least one of four molecular markers. Among these markers there are two neurotransmitters and two calcium-binding proteins. The neurotransmitters are: GABA or its synthesis enzyme GAD and dopamine (DA) or the enzyme involved in its synthesis TH. The calcium binding proteins most commonly expressed by PG cells are CB and CR (Figure 9) (Kosaka et al., 1997; Toida et al., 1998; Panzanelli et al., 2007; Parrish-Aungst et al., 2007).
Immunohistochemistry combined with transgenic mouse lines expressing green fluorescent protein (GFP) under the promotor of one of the two GAD isoforms were used to roughly quantify each subpopulation. In the GAD65-GFP mouse, ~37% of the GL cell population are labeled with GFP while immunolabeled GAD67(+) cells represent ~30% indicating that GABAergic neurons constitute the majority of al JG cells (Parrish-Aungst et al., 2007). An interesting feature is that, most GABAergic cells co-localize either with TH(+),