Publisher’s version / Version de l'éditeur:
Metallurgical and Materials Transactions: A, 41, 11, pp. 2844-2855, 2010-11
READ THESE TERMS AND CONDITIONS CAREFULLY BEFORE USING THIS WEBSITE. https://nrc-publications.canada.ca/eng/copyright
Vous avez des questions? Nous pouvons vous aider. Pour communiquer directement avec un auteur, consultez la première page de la revue dans laquelle son article a été publié afin de trouver ses coordonnées. Si vous n’arrivez pas à les repérer, communiquez avec nous à PublicationsArchive-ArchivesPublications@nrc-cnrc.gc.ca.
Questions? Contact the NRC Publications Archive team at
PublicationsArchive-ArchivesPublications@nrc-cnrc.gc.ca. If you wish to email the authors directly, please see the first page of the publication for their contact information.
NRC Publications Archive
Archives des publications du CNRC
This publication could be one of several versions: author’s original, accepted manuscript or the publisher’s version. / La version de cette publication peut être l’une des suivantes : la version prépublication de l’auteur, la version acceptée du manuscrit ou la version de l’éditeur.
For the publisher’s version, please access the DOI link below./ Pour consulter la version de l’éditeur, utilisez le lien DOI ci-dessous.
https://doi.org/10.1007/s11661-010-0293-4
Access and use of this website and the material on it are subject to the Terms and Conditions set forth at
Solidification of aluminum-copper B206 alloys with iron and silicon
additions
Kamguo Kamga, H.; Larouche, D.; Bournane, M.; Rahem, A.
https://publications-cnrc.canada.ca/fra/droits
L’accès à ce site Web et l’utilisation de son contenu sont assujettis aux conditions présentées dans le site LISEZ CES CONDITIONS ATTENTIVEMENT AVANT D’UTILISER CE SITE WEB.
NRC Publications Record / Notice d'Archives des publications de CNRC:
https://nrc-publications.canada.ca/eng/view/object/?id=01d0c96b-8b48-4d88-bd6b-896e78f61e9f https://publications-cnrc.canada.ca/fra/voir/objet/?id=01d0c96b-8b48-4d88-bd6b-896e78f61e9fSolidification of Aluminum-Copper B206 Alloys with
Iron and Silicon Additions
H. Kamguo Kamga
1, D. Larouche
2, M. Bournane
1, A. Rahem
31- University Research Center on Aluminium (CURAL), University of Québec at Chicoutimi, Saguenay, Québec, Canada, G7H 2B1
2- Laval University, Dept of Mining, Metallurgy and Materials Engineering, Aluminium Research Center – REGAL, 1065, Ave de la Médecine, Québec, Canada, G1V 0A6
3- National Research Council of Canada, Aluminium Technology Center (ATC), Saguenay, Québec, Canada, G7H 8C3 Corresponding author. E-mail address: daniel.larouche@gmn.ulaval.ca
Abstract
Solidification of B206 aluminum alloys with additions of iron and silicon was studied to investigate their combined effect on the formation and precipitation of intermetallics, particularly Fe-rich phases. Iron is precipitated mainly by either β(CuFe)or α(MnFe) phases, or both depending of the iron and silicon content, as well as the cooling rate. It was found that in alloys having up to 0.3wt% Fe, the precipitation of β(CuFe) phase can be largely suppressed if the ratio Si/Fe is close to 1 and the cooling rate is moderately high. The low mobility of the large facets of the β(CuFe) platelets is likely the cause limiting the amount of this phase, especially when the iron atoms have the possibility to be captured by another phase, in this case, the α(MnFe) phase.
Keywords: Solidification; Microstructure; Intermetallics; Thermal analysis; DSC
1. Introduction
The solubility of iron in aluminum is very low in pure aluminum (0.048%) and decreases by almost five times when 5wt% copper is added [1]. The iron atoms are generally dispersed in aluminum copper alloys as intermetallics, mainly as the Al7FeCu2 phase. These iron-bearing compounds potentially decrease the
strength and ductility of the alloy. The reduction of soluble copper resulting from their formation establishes the acceptable iron as the lowest possible; say less than 0.1% in B206 alloys. This makes the alloy expensive to produce and limits its use, especially with increased recycling to lower cost and reduce waste disposal. Some efforts are made to safely increase this level of iron in respect to mechanical properties. Tseng et al. [2] studied the effect of iron content on microstructure and mechanical properties of A206 alloy in T7 condition. They concluded that a typical solidification structure is composed of the network of Al2Cu and needle-like of Al7FeCu2, and that the tensile strength linearly decreased with
increasing iron content. Sigworth [3] revealed the possibility to increase Fe and Si limits in 206 alloys in the T4 temper to 0.2% each, resulting in only a small loss of ductility. According to this author, there is some indication that the Fe/Si ratio is important in these alloys although there is disagreement about what is the best ratio to have. Silicon increases the strength of cast alloys, mainly by increasing the castability and the soundness of the castings. However, some losses in ductility and fatigue resistance have been reported, especially when the iron-bearing compounds Al7FeCu2 are replaced by the Al5FeSi β-phase [4]. On the
other hand, it has also been reported that silicon and manganese contents in aluminum alloys can promote the formation of the less detrimental α-Fe phases with Chinese script shape-like morphology instead of the needle shape-like β-phase, resulting in improved mechanical properties [5-7]. In addition, Caceres et al. [8] claimed enhanced ductility in Al-Cu-Mg-Si casting alloys that contain high levels of Fe. They explained this enhancement by the formation of well refined and dispersed intermetallic particles in the presence of high silicon.
Solidification of alloy A206has been studied by Backerud et al. [6], but their study was carried out at very low level of iron (0.03%). The objective of this study was to determine the combined effect of both high
iron and silicon contents on the formation of intermetallic phases in these alloys; their size, distribution, morphology and quantity, since all these parameters influence the properties of the alloy.
2. Experimental procedure
2.1 Alloy composition
The base alloy was a B206 ingot produced by Rio Tinto Alcan and its chemical composition is shown in Table 1.
Table 1: B206 Alloy composition (wt%)
Cu Si Fe Mn Mg Ti Zn Ni Al
4.98 0.05 0.07 0.39 0.21 0.01 0.01 0.02 balance
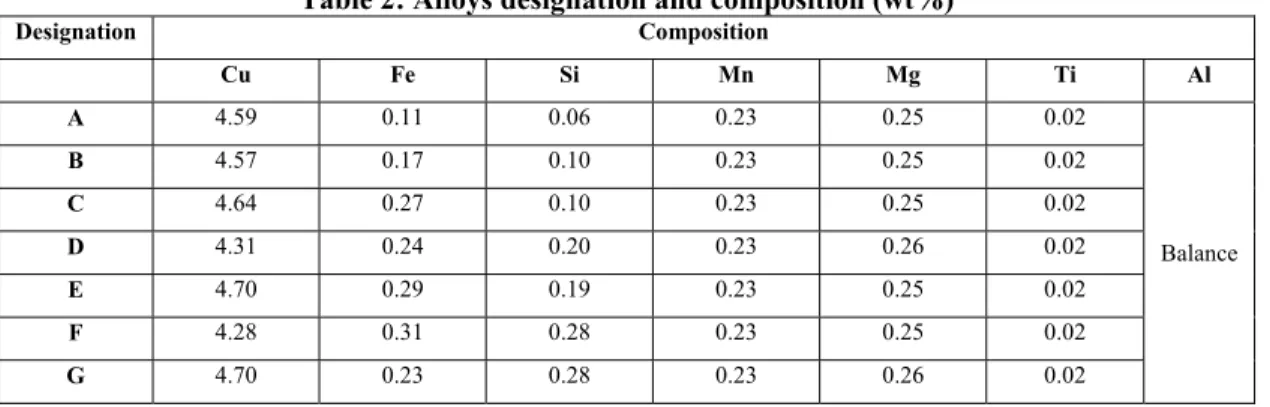
Different levels of Fe/Si ratios and two cooling rates (low and high) were used. A drawback of high manganese content is the increase in both hardness and quantity of intermetallic particles for a given iron content, in such a way that its positive effect on the modification of the intermetallic morphology to increase the resistance to crack propagation is reduced by the increased volume of the brittle α-Fe phase [9]. Since our goal was to maximize the iron content, manganese was kept constant and at the lowest acceptable quantity, that is about 0.2wt%. Compositions were modified using aluminum 1020 and commercial (Al-50wt%Si, Al-25wt%Fe) master alloys. Chemical analyses of the 7 modified B206 alloys were carried out with an optical spectrometer and are presented in Table 2. Notice that the alloys in Table 2 are in increasing order of Si + Fe contents except for alloy G, which has the particularity to be the only one having a Si/Fe ratio above 1. If one accepts that alloys D and E have the same Si content, then one can say that the alloys are also in increasing order of Si content.
Table 2: Alloys designation and composition (wt%)
Designation Composition Cu Fe Si Mn Mg Ti Al A 4.59 0.11 0.06 0.23 0.25 0.02 Balance B 4.57 0.17 0.10 0.23 0.25 0.02 C 4.64 0.27 0.10 0.23 0.25 0.02 D 4.31 0.24 0.20 0.23 0.26 0.02 E 4.70 0.29 0.19 0.23 0.25 0.02 F 4.28 0.31 0.28 0.23 0.25 0.02 G 4.70 0.23 0.28 0.23 0.26 0.02
2.2 Melt treatment and casting
About 1.4 kg of material was melted in a salamander crucible by means of a resistance furnace and the temperature of the melt was maintained to about 730 ± 5°C. The melt was alloyed with sufficient Al-5Ti-1B grain refiner added in rod form to give final Boron content of about 20 ppm. With the Titanium already present in the master alloys, grain refiner additions raised the Titanium concentration up to 0.02wt%. Stirring was carried out before the first casting, and after each four castings. Prior to casting, a specimen was prepared for chemical analysis. The steel crucible (Figure 1) used for sample casting was preheated first in a separate furnace at 450°C, and later by immersion in the melt for about two minutes. In this way, no nucleation could occur in the sample before the system was in thermal balance. The filled crucible was then placed on an alumina plate laid at the bottom of a copper cylindrical cup which could accommodate a pressurized air cooling system. Two K-type thermocouples were then dipped into the melt in the sampling crucible, one at the center and the other close to the wall, while the temperature evolution was recorded with a computerized recording system at the frequency of ten readings per second. The 0.5 mm diameter thermocouple tips were located 20 mm above the bottom of the crucible. Eight samples were produced per batch. Solidification was allowed under free atmosphere and under 2.74 Atm pressurized air. These
conditions provided cooling rates of about 1 and 4 K/sec respectively, calculated from the portion of the cooling curve prior the nucleation of the primary aluminum dendrites. Two cooling curves were recorded for each condition to ensure consistency. The holding time was kept under 90 min. Preliminary experiments showed that the decrease in grain refinement during this time was negligible.
2.3 Thermal analysis and Microscopy
Cooling curves were analyzed to determine precipitation temperatures, solidification ranges and times. As most of the alloys of this system do not freeze under equilibrium conditions and are used after heat treatment, differential scanning calorimetry (DSC) was carried out at the heating rate of 1°C/min on the PerkinElmer power compensated DSC 7 to determine dissolution temperatures of phases and optimize heat treatment conditions. Samples of 10-20 mg were taken at the center of the castings used for thermal analysis. The phases were associated to the dissolution temperature by heating the sample about ten degrees above the DSC peak temperature, holding for about 20 minutes to allow for dissolution or local burning, and then quenched. The sample was later polished and the phases associated to the peak temperature identified. One quarter sections of the as-cast samples were cut parallel to the thermocouples, mounted in resin, polished and then etched with 0.5% HF solution to reveal the microstructure. Optical microscopy, scanning electron microscopy (SEM), electron probe micro analysis (EPMA) and image analysis was used to examine the microstructure. Clemex image analyzer was used with the optical microscope (Olympus) to characterize the amount of intermetallic compounds, their size, distribution, and morphology.
3. Results
Cooling curves at low and high cooling rates and their derivatives are shown in Figures 2 and 3. The difference between the temperature measured near the wall (Tw) and the center (Tc) is also plotted in these
figures. Notice that the time derivative of Tc (dTc/dt) was plotted against Tc while (Tw – Tc) was plotted
against Tw. This was done considering that dTc/dt and (Tw – Tc) can be seen as local variables, the first one
characterizing rate of changes occurring in the center of the specimen and the second one characterizing a temperature gradient at the periphery of the specimen. It can be seen in Figures 2 and 3 that the concordance between the two variables when plotted against their respective local temperature is excellent. Analyses of the curves clearly identify four main precipitation reactions, which are indicated by arrows. The curves (Tw – Tc) were useful to determine with improved accuracy the onset temperature of reaction 2
at high cooling rate. Indeed, it is possible to see in Figure 3 a slight deviation of (Tw – Tc) at the temperature
where the shallow peak of reaction 2 occurs on the dTc/dt curve. At low cooling rate, the difference
between Tw and Tc was much smaller, making difficult to determine precisely the onset temperature of
reactions 2, 3 and 4. In these cases however, the peaks obtained on dTc/dt are well defined.
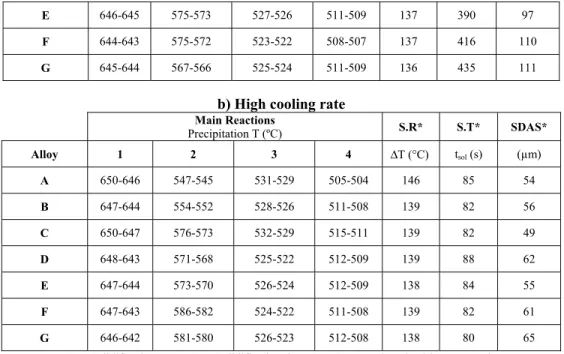
Table 3 presents a summary of the solidification data. The start of solidification was taken as the point where the second derivative of the cooling curve is maximal. Because of the large range of temperature over which dTc/dt is increasing at high cooling rate (See Figure 3), an uncertainty range of 4 or 5 K was
given to the onset of solidification of high cooled rate alloys while an uncertainty range of no more than 1 K was given to the onset of solidification of low cooled rate alloys. The lower bound of these ranges may better reflect the true onset temperatures since for most alloys they are practically the same or 1 degree below for the higher cooling rate. The only exception is alloy C but the difference is not very significant.
Table 3: Summary of solidification data a) Low cooling rate
Main Reactions
Precipitation T (ºC) S.R* S.T* SDAS*
Alloy 1 2 3 4 ∆T (°C) tsol (sec) (µm)
A 647-646 560-556 532-531 507-505 142 320 90
B 645-644 567-564 530-528 508-507 138 438 95
C 645-644 576-575 529-528 508-506 139 425 85
E 646-645 575-573 527-526 511-509 137 390 97
F 644-643 575-572 523-522 508-507 137 416 110
G 645-644 567-566 525-524 511-509 136 435 111
b) High cooling rate
Main Reactions Precipitation T (ºC) S.R* S.T* SDAS* Alloy 1 2 3 4 ∆T (°C) tsol (s) (µm) A 650-646 547-545 531-529 505-504 146 85 54 B 647-644 554-552 528-526 511-508 139 82 56 C 650-647 576-573 532-529 515-511 139 82 49 D 648-643 571-568 525-522 512-509 139 88 62 E 647-644 573-570 526-524 512-509 138 84 55 F 647-643 586-582 524-522 511-508 139 82 61 G 646-642 581-580 526-523 512-508 138 80 65
*S.R: Solidification range; S.T: Solidification time; SDAS: Secondary dendrite arm spacing
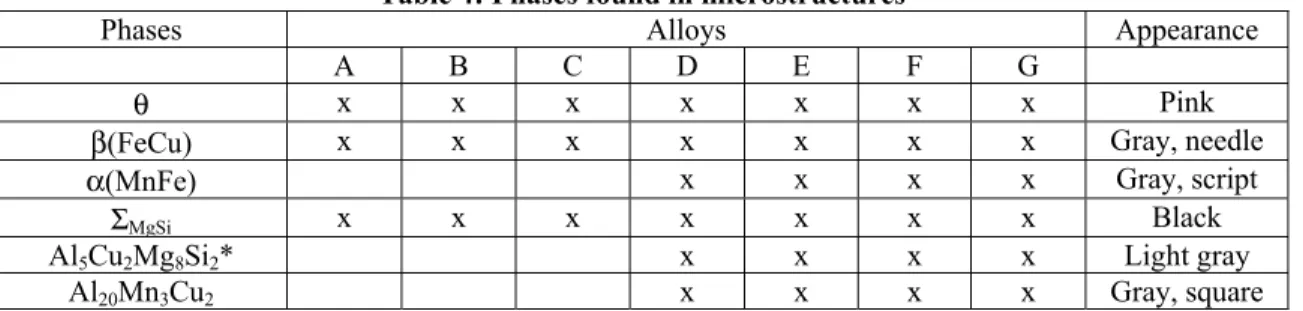
Table 4 lists the phases identified by energy dispersive spectroscopy (EDS) and Table 5 presents their volume fractions as measured by optical microscopy. Two hundreds fields of 28525.75 µm2 surface area each were analyzed per measurement at magnification 500x. The samples were traversed in a regular and systematic manner along the solidification path; i.e. from the wall to the centre. In quantitative stereology, the measured area fraction of a phase is equal to the volume fraction under the assumption that the morphology is equiaxed [10]. Consequently, the measured area fractions of these intermetallic compound particles were transferred to as the volume fractions. A typical microstructure of alloy A is shown in Figure 4. The secondary phases present at the grain boundaries of the aluminum matrix are Al2Cu or θ, Al7FeCu2
or β(FeCu) and other phases containing exclusively light elements like Mg and Si. The latter will be indistinctively referred to as the ΣMgSi phases. The microstructures of alloys B and C are similar to that of
alloy A. In addition to the phases found in alloy A, a negligible amount of iron precipitated as Al32(Cu,Fe,Mn)8(Al,Si)4Si2 or α(MnFe) phase (less than 0.01%, Table 5). Typical microstructures of alloys
D to G at low and high cooling rates are presented in Figures 5 to 13. Some particles of Al20Mn3Cu2 and
very small isolated pockets of Al5Cu2Mg8Si6 phases were found in the microstructure of alloy D at low
cooling rate (Figure 5). The microstructures of alloys E and G are similar to that of alloy D at low cooling rate (See respectively Figures 7, 12 and 5). Still at low cooling rate, about 33% of iron precipitated as α(MnFe) phase in alloy F (Table 5, Figure 9), while Al5Cu2Mg8Si6 phase is found as nucleating and
growing from Al2Cu phases (Figure 10). At high cooling rate, the precipitation of α(MnFe) was done at the
expense of the β(FeCu) phase and nucleation of Al5Cu2Mg8Si6 was suppressed. About 70% and 54% of the
iron content participated to the formation of the α(MnFe) phase in respectively alloys D and E at high cooling rate (table 5). A typical microstructure of alloy E at high cooling rate is presented in Figure 8. In alloys F and G, almost all iron precipitated as α(MnFe) phase at high cooling rate (see Table 5 and Figures 11 and 13). At high cooling rate, some β(FeCu) phases are fragmented in alloys A, B, and C, taking script shape-like morphology. Their characterization (Figure 14) shows that Si can substitute Al in the lattice. DSC curves are presented in Figure 15 and resultant peak dissolution temperatures are listed in Table 6. Three peaks were observed at all compositions and cooling rates around 650, 597, and 540°C. A fourth peak was observed around 514°C for alloys D, E, F, and G at low cooling rate, while a minor fifth peak was observed mainly in alloys F and G somewhere between 622 and 635°C. The peak temperature should closely correspond to the end of a transformation in the heating phase of a DSC scan, especially at a low heating rate. Indeed, when all the latent heat is exchanged at the end of the transformation, the heat power recorded by the DSC starts to deviate, going back to the baseline. Consequently, the peak temperature should also correspond to the start of the reverse transformation during solidification.
Table 4: Phases found in microstructures
Phases Alloys Appearance
A B C D E F G
θ x x x x x x x Pink
β(FeCu) x x x x x x x Gray, needle α(MnFe) x x x x Gray, script
ΣMgSi x x x x x x x Black
Al5Cu2Mg8Si2* x x x x Light gray
Al20Mn3Cu2 x x x x Gray, square
*Observed only at low cooling rate
Table 5: Volume fraction of phases
Volume fraction (%) Alloy Fe (wt%) Si (wt%) Weight ratio Si/Fe Cooling rate
θ β(FeCu)/ Al20Mn3Cu2 α(MnFe) ΣMgSi
A 0.11 0.06 0.54 Low 4.04 0.76 0 0.085 High 4.15 0.88 0 0.06 B 0.17 0.10 0.59 Low 4.08 0.97 0 0.087 High 4.18 1.15 0 0.17 C 0.27 0.10 0.37 Low 3.73 1.35 0 0.05 High 3.95 1.45 0 0.12 D 0.24 0.20 0.83 Low 3.90 1.16 <0.01 0.15 High 4.69 0.37 0.87 0.18 E 0.29 0.19 0.65 Low 3.90 1.33 <0.01 0.11 High 4.48 0.66 0.78 0.19 F 0.31 0.28 0.90 Low 4.06 0.90 0.45 0.17 High 4.79 <0.01 1.48 0.14 G 0.23 0.28 1.2 Low 4.01 1.22 <0.01 0.18 High 4.74 <0.1 1.33 0.17
Table 6: Peak dissolution temperatures a) Low rate cooled alloys
Peak Dissolution Temperature (degree Celsius)
Alloy 1 2 3 4 5 A 646.6 - 595.0 542.0 - B 646.5 - 595.5 541.6 - C 645.2 - 599.9 540.8 - D 643.3 - 594.0 536.9 513.8 E 645.4 - 598.0 539.0 514.0 F 645.5 622.0 592.8 536.4 513.6 G 645.0 634.0 592.0 537.5 514.0
b) High rate cooled alloys
Peak Dissolution Temperature (degree Celsius)
Alloy 1 2 3 4 5 A 647.7 - 596.7 541.5 - B 647.3 - 598.4 540.3 - C 647.0 - 600.0 540.7 - D 646.7 - 596.7 536.7 - E 646.6 - 598.7 539.0 -
F 646.0 627.0 593.5 537.7 -
G 646.4 631.0 595.9 538.9 -
4. Discussion
4.1 Solidification
High iron and silicon content lead us into a complex Al-Cu-Fe-Mn-Mg-Si system for which thermodynamic computational tools can be helpful to understand the solidification path. A computational algorithm calculating the solidification path in multiphase systems and using the mobility of each element to calculate the effect of back diffusion was developed by Larouche [10]. This scheme was used in this work with the software Thermo-Calc [11]. Thermodynamic variables were computed with the database TTAL6 [1] and the mobility of elements were retrieved from the MOBAL1 database [12]. The simulations were first conducted by considering all possible phases of the database and assuming local equilibrium conditions at the liquid - solid interface. The scheme predicted the formation of the (Cu,Mn,Fe)(Al,Mg)6
phase (called Al6Mn) in all cases but this phase was not observed in our samples. According to global
equilibrium calculations, this intermetallic phase is supposed to appear between 595°C and 614°C, depending of the alloy, and to disappear at around 580°C in a peritectic reaction. Likewise the Scheil model, which does not consider any reaction of a solid phase, the scheme used in this work was not developed to consider the reaction of a specific solid phase with the liquid, although it can assume a sub-system larger than the liquid phase to calculate interfacial reactions. But to simplify the calculations, we decided to reject phase Al6Mn as a potential phase in the solidification path, which is equivalent to say that
phase Al6Mn did not nucleate in our samples. Considering that up to 1wt% of this phase should have
formed before the peritectic reaction, one would have obtained a clear peak in the cooling curves, but the latter did not show any evidence of secondary phase formation at this stage of the solidification process. The same thing was made for the (Al,Si)3(Fe,Cu,Mn) phase (called Al3Fe) since this phase was not
observed on any specimen. The simulations were thus carried out rejecting phases Al6Mn and Al3Fe.
Calculations were made with the compositions given in Table 2 using secondary dendrite arm spacings and solidification times given in Table 3. The cooling rate for each case was taken as the solidification range divided by the solidification time. The same calculations were done for the higher cooling rate but the results will not be presented here because of their similarity with those presented for the lower cooling rate. It is worthwhile to mention however that the volume fractions of secondary phases obtained for the higher cooling rate were larger than those obtained for the lower cooling rate by 5 to 11% and the temperatures of precipitation were not differing from one to another by more than 1 K. The results of the simulations will be presented by first considering the formation of phases β(FeCu) and α(MnFe), which may have a strong detrimental impact on the mechanical properties of the alloy. Figure 16 presents the calculated volume fractions of α(MnFe) and β(FeCu) phases versus their temperature of precipitation for the alloys solidified at the lower cooling rate.
A comparison between the results shows that the measured volume fractions of β(FeCu) are larger than the calculated values by a factor comprised between 1.0 and 1.9. For α(MnFe), the measured values are almost zero in all cases except for alloy F where the measured value is 0.45%. The calculated volume fractions for this phase are all below 0.2% except for alloy F which is 0.25%. The higher content of α(MnFe) phase in alloy F at low cooling rate was thus correctly predicted. For these two intermetallic phases, the measured volume fractions involved are always below 1.4%, so one could not expect to obtain a much better agreement for such low amounts of phase. The measured volume fractions of the eutectic phase θ were larger than the calculated values by a factor ranging between 1.3 and 1.5. For instance, the maximum volume fraction of θ phase obtained experimentally was 4.1% in alloy B, while the calculated volume fraction for this alloy was 2.79%. The maximum calculated volume fraction of θ phase was 3.2% and was obtained in alloy G. The amounts of eutectic phase were thus satisfactorily predicted, considering the inherent difficulty of measuring volume fractions of secondary phases. The measured and calculated liquidus were very close, differing by less than ±1K. The onset temperatures of reaction 4, which corresponds to the experimental solidus, are in good agreement with the calculated onset temperatures of the following quaternary eutectic reactions:
Alloy A,B,C: L → Al + Al2(AlCu) + Al7Cu2Fe + Mg2Si (1)
Alloy D, E, F and G: L → Al + Al2(AlCu) + Al7Cu2Fe + Al5Cu2Mg8Si6 (2)
Indeed, the calculated temperatures were higher than the measured temperatures by 2 to 4 K, the largest error occurring for alloy F. The calculated evolutions of the most important secondary phases are presented in Figure 17 for one of the compositions studied (alloy D).
The onset temperature of reaction 4 is highlighted on this figure by a vertical plain line at 513°C. At this temperature, a sudden and significant increase of θ phase occurs, which was just enough intense to cause a measurable deviation on the cooling rates. The theoretical true solidus of this alloy is 504°C and occurs after the formation of Mg2Si starting at 510°C. This reaction could not be seen explicitly on the cooling
curves because of the low mass fractions involved. Reactions 2 and 3 of Table 3 correspond respectively to the formation of β(FeCu) and θ phases. The measured and calculated temperatures of precipitation at low cooling rate of these two phases are significantly different, the calculated temperatures being 14 to 22 K higher for the β(FeCu) and 7 to 9 K higher for the θ phase. These differences could not be reduced significantly by changing the compositions inside the margins of error or by modifying the equilibrium conditions prevailing at the interface, as this was done previously on AA6111 [10]. Since the experimental temperatures are lower than the calculated ones, it is reasonable to think that these two phases experienced undercooling. The absence of peak at around 600°C in the cooling curves in all alloys investigated at low and high cooling rates indicate probably that the amounts of α(MnFe) and of course Al6Mn were not large
enough to provoke a measurable deviation in the cooling rate. It is possible however that undercooling may have delayed the formation of α(MnFe) up to the point where the following reaction started:
L → Al + Al7Cu2(Fe,Mn) + Al20Cu2Mn3 + Al32(Cu,Fe,Mn)8(Al,Si)4Si2 (3)
Notice that the phase Al20Cu2Mn3 was not predicted by our simulations, except for alloy A where a
negligible amount (0.006%) was calculated. This phase was observed in only very small amounts in alloys D, E, F and G. If α(MnFe) phase was not observed in significant quantities at low cooling rate, much larger amounts were observed at the higher cooling rate for alloys D, E, F and G as indicated in Table 5. Very small amounts of β(FeCu) phase were obtained for alloys F and G at the higher cooling rate and surely this explains why these specimens contained more than 1.3% of α(MnFe). The model has not predicted such low amounts of β(FeCu) and volume fractions of α(MnFe) above 0.3% for these two alloys. In fact, one has to reject phase β(FeCu) in our calculations to obtain amounts of phase approaching those measured for these cases. One particularity in the cooling curves obtained for alloys F and G at high cooling rate is the onset temperatures of reaction 2, which were 10 K higher than for any other alloys. Since the α(MnFe) phase had much larger volume fractions than the β(FeCu) phase in these cases, no doubt that the peak of reaction 2 observed in the corresponding cooling curves indicated the start of the formation of α(MnFe). Adding a driving force to the nucleation of α(MnFe) phase in the model to simulate undercooling did not reduce the calculated volume fraction of β(FeCu). Modifying the sub-system at the solid-liquid interface did not also permit to obtain volume fractions of α(MnFe) larger than β(FeCu). Since growth kinetics phenomena other than back-diffusion were not modeled in the computational scheme, we decided to conduct DICTRA [13] simulations to see if limited diffusion in the liquid could explain the onset temperature of the α(MnFe) phase. Even by reducing the mass diffusivity of the heavier elements by 10, the temperature of nucleation of the α(MnFe) in alloy F did not change significantly. Notice that α(MnFe) started to form in these simulations when the volume fraction of the primary phase reached 73%, so the size of the remaining liquid was just in the order of 8 µm, promoting a good mixing.
Before going further in the discussion, we will summarize the findings. With silicon content equal or less than 0.1%, i.e. for alloys A, B, and C, iron precipitated as β(FeCu) phase under both the cooling rates employed. With increasing silicon content, α(MnFe) starts to precipitate. The rate of precipitation of α(MnFe) at the expense of the β(FeCu) phase is increased with the cooling rate and at around 0.3% Si and high cooling rate, almost all iron is precipitated as α(MnFe). The reaction described by Eq. (3) tells that 3 intermetallic phases compete together when they grow simultaneously at the expense of the liquid phase. The phase Cu2Mn3Al20 was rarely formed in the microstructure. This scarcity may be explained by two
reasons. First, manganese has a great affinity with α(MnFe) and Mondolfo [4] reported that if the silicon composition in the liquid is greater than 1% in Al-Cu alloys, α(MnFe) will form over Cu2Mn3Al20
compounds. It is therefore, likely that at temperature where this reaction occurs, the enriched melt contains sufficient silicon to promote the precipitation of α(MnFe). The second reason is related to the crystal structure of the phases. Most intermetallic phases grow by stepwise nucleation on specific crystallographic planes. There are, of course, differences in the growth rate of different intermetallic crystals. The phase α(MnFe) has a cubic structure and will nucleate and grow more easily and more quickly than the tetragonal β(FeCu) phase and the orthorhombic Cu2Mn3Al20 phase. The first one should therefore dominate at high
cooling rate, provided that the chemical composition allows the formation of this phase. Manganese is known to stabilize α(MnFe) but in this case, cooling rate effect on stabilization of α(MnFe) phase is dominating factor due to lower manganese content.Based on Mondolfo’s assumption for the promotion of α(MnFe) phases, one should have expected more α(MnFe) phases in the G alloy than in F alloy. But the reverse was found. We do not have a clear explanation for this but maybe the formation of α(MnFe) phases do not depend solely on the percentage of silicon in the liquid metal, but also on the iron level and the Si/Fe ratio, the latter promoting more α(MnFe) when it is closer to one. Also, it has been reported that silicon has a growth restriction factor of 5.74 in aluminum alloys, which is about twice that of iron (2.86) [14]. This restriction factor may have play a role in the growth of α(MnFe) phases, delaying this growth with more silicon present, which resulted in lower fraction of α(MnFe) phases in the G alloy. In the case of the β(FeCu) phase, the precipitates have a thin platelet morphology, which indicates that the rate of transformation of this phase is essentially governed by the mobility of the large facets. This certainly contributes to minimize the volume fraction of that phase when the cooling rate is high and that iron atoms have the possibility to be captured by another intermetallic phase having faster growth kinetics. During the eutectic period, the θ phaseprecipitates together with either α(MnFe) or β(FeCu) or both according to the following reaction:
L → Al + Al2(AlCu) + Al7Cu2(Fe,Mn) + Al32(Cu,Fe,Mn)8(Al,Si)4Si2 (4)
Notice that at this stage of solidification, the growth rates of α(MnFe) and β(FeCu) are very small as this can be seen in Figure 17 below the eutectic temperature (533Cº). Indeed, the large portion of α(MnFe) or β(FeCu) phases is forming at temperatures above the eutectic point as this is confirmed on Figure 18 where both iron phases are present after soaking and quenching a sample of alloy G at 560°C. In the final stage of solidification (post-eutectic), the θ phase precipitates together with Mg2Si and β(FeCu) through reaction
given by equation (1) for all alloys at high cooling rate and for alloys A, B, and C at low cooling rate. For alloys D, E, F, and G, Al5Cu2Mg8Si6 precipitated at low cooling rate through reaction given by equation (2).
The precipitation of Al5Cu2Mg8Si6 became significant at 0.3%Si (alloys F and G). The phases Mg2Si and
pure silicon were found agglomerated in many places with other phases containing oxygen. These agglomerated phases were labeled ΣMgSi in Figures 4 to 13, irrespective of the fact that they had oxygen or
not. X-ray spectroscopy revealed that ΣMgSi zones contain level of oxygen comprised between 1 and 22
wt%. It became thus difficult to identify unambiguously the phases. After investigation, it was found that oxygen was drawn in from Al-Si master alloy as shown by the presence of oxygen in the WDS mapping of the master alloy (Figure 19). Fortunately, most of the silicon was not combined to oxygen; but it is clear that the effective silicon content was a little bit below the concentration given in Table 2. From this we concluded that commercial master alloys should always be investigated carefully before use.
4.2 DSC
The peak temperatures obtained during the heating of samples in the DSC are in good agreement with the onset temperatures calculated with the multiphase back diffusion scheme. The liquidus temperatures differ by less than 1.6 K, except for alloy D at low cooling rate, which shows a distinct behavior as this can be seen in Figure 15. Near the solidus (around 513ºC), the temperatures of the quaternary eutectic (reaction 4; Eq. 1 and 2) differ also by less than 1.6 K. Notice however that the peaks were found only for alloys D, E, F, and G previously cooled at the lower rate. The absence of peaks around 513ºC results from the dissolution of the Mg2Si and silicon phases during the heating process, as this can be deduced from Figure
20 where these phases are difficult to find after soaking and quenching at 520°C. Notice also that incipient melting did not occurred in this sample. It seems that a heating rate of 1 K/min was slow enough to allow
sufficient time for diffusion and dissolution. For the samples cooled at the higher rate, no peak was obtained in any of them. Dissolution was complete in these samples due to the small size of the particles. The agreement obtained between the calculated precipitation temperatures of β(FeCu) and θ phases and the corresponding DSC peak temperatures is better than the agreement obtained between the former and the thermal analysis. For the precipitation of the β(FeCu) phase, the temperatures differ between 3.8 and 13.7 K and for the precipitation of the θ phase, they differ between 3 and 6.9 K. The DSC peak temperatures for these two transformations are all above the calculated onset temperatures. Some of the discrepancies can be explained by the chemical compositions of the DSC samples, which can be different from the nominal compositions of the alloy because of the macrosegregation occurring during the solidification of the thermal analysis samples. One has to recall also that a slow reheating process is not a perfect inverse solidification path, as demonstrated by the dissolution of the low melting phases. Some minor peaks (peaks 2, table 6) appear on DSC curves between 619 and 626°C for alloys F and G. These peaks may result from the formation and dissolution of (CuMnFe)Al6 phases (although we could not identified them in the
microstructure). The calculated precipitation temperature of (CuMnFe)Al6 at equilibrium by Thermo-Calc
with the TTAL6 database and those observed on DSC curves differ by a gap comprised between 5.2 and 20.3 K. Some of the DSC experiments were repeated and the cooling curves obtained showed variable temperature of precipitations supporting the idea that the main source of deviation was the variations in the composition of the DSC samples. Some of the DSC experiments gave temperatures of precipitation in very good agreement with the multiphase back diffusion scheme, giving us the confidence that the thermodynamic database is not an issue regarding the accuracy of the model.
5. Conclusion
The solidification path of 206 type aluminum alloy was investigated to see the influence of minor additions of iron and silicon when different cooling conditions are applied. It was found that the content of iron intermetallics β(FeCu) and α(MnFe) are largely dependant upon the cooling rate. Important undercoolings for the precipitation of these phases were observed at a moderately low cooling rate (1 K/s before liquidus) for all compositions investigated and a very few β(FeCu) platelets were obtained at a high cooling rate (4K/s before liquidus) when Si content was 0.3wt% and Fe content not exceeding 0.3wt%. In order to precipitate iron as α(MnFe) phase, a minimum of 0.2%Si was required with a Fe/Si ratio of one being preferred, the optimum ratio being 0.3wt%Fe/0.3wt%Si. High cooling rate was essential to prevent the formation of the β(FeCu) phase and this is likely caused by the low mobility of the large facets of the β(FeCu) platelets. The limit of 0.3wt% Fe when the alloy contains 0.3wt% Si is therefore conditional to castings undergoing rapid solidification. The phases Al6Mn and Al3Fe were not observed in the specimens
and this is probably due to the difficulty of these phases to nucleate from the melt. A multiphase back diffusion model would have predicted the formation of phase Al6Mn in the seven compositions investigated
of the alloys and very few Al3Fe in some of them. The inaccuracy of the database used and the limited
diffusion of the elements in the liquid were discarded to be the cause of the discrepancies between the calculated and measured temperature of precipitations of the iron intermetallics. The driving force required for nucleation is very likely the cause explaining the differences.
Acknowledments
The authors thank University of Quebec at Chicoutimi (UQAC) and the Aluminium Research Center - REGAL for financial assistance, as well as the National Research Council Canada - Aluminium Technology Centre for their technical support.
References
1. TTAL6, TT Al-based Alloys Database, version 6.0, ThermoTech Ltd, Surrey Technology Center, Guildford, UK.
2. Tseng, CJ, Lee, SL, Wu, TF, Lin, JC, “Effects of Fe Content on Microstructure and Mechanical Properties of A206 Alloys”, Materials Transactions, JIM, Vol.41, No.10, pp 708-713, 2000.
3. Sigworth, GK, Major, JF, “Chemistry/Property Relationships in AA206 Alloys” AFS Transactions, Vol. 02, pp 117-128, 2006.
4. Mondolfo, LF, “Aluminum Alloys: Structure and Properties”, London: Butterworths, 1976.
5. Totten, GE, Mackenzie, DS, “Physical Metallurgy and Processes”, Handbook of Aluminum,Vol.1, Marcel Dekker Inc, New York, 2003.
6. Backerud, L, Chai, G, Tamminen, J, “Foundry Alloys”, Solidification Characteristics of Aluminum Alloys, Vol.2, AFS/Skanaluminium, 1990.
7. Mondolfo, LF, “Manganese in Aluminum Alloys”, The Manganese Centre, Neuilly sur Seine, France, 1978.
8. Caceres, CH, Taylor, JA, “Enhancement Ductility in Al-Si-Cu-Mg Casting Alloys with high Si Content”, Shape Casting: The John Campbell Symposium, Tiryakioglu, M, Crepeau, PN, Eds, The Minerals, Metals & Materials Society (TMS), pp 245-254, 2005.
9. Jonason, P, AFS Transactions, Vol. 100, p.601, 1992.
10. Larouche, D, “Computation of Solidification Paths in Multiphase Alloys with Back-Diffusion”, CALPHAD, Vol. 31, pp 490-504, 2007.
11. Sundman, B, Jansson, B, Andersson, J-O, CALPHAD, Vol. 9, pp 153-190, 1985. 12. MOBAl1, TCS Al-Alloys Database, version 1.0, Thermo-Calc Software AB.
13. Andersson, J-O, Helander, T, Höglund, L, Shi, P, Sundman, B, CALPHAD, Vol. 26, pp 273-312, 2002. 14. Arnberg, L., Backerud, L., Chai, G., “Dendrite Coherency”, Solidification Characteristics of Aluminum
Alloys, Vol.3, AFS Inc, Des Plaines, IL, 1996.
Figure captions
Figure 1: Steel crucible in the copper cup. Crucible thickness 1mm; Height 42mm. Upper diameter 44mm; Bottom diameter 25mm.
Figure 2: Cooling curves at low cooling rates for alloys A to G. Plain lines are Tc vs time (above) or Tw−Tc vs Tw. (below). Dotted lines are dTc/dt vs Tc..
Figure 3: Cooling curves at high cooling rates for alloys A to G. Plain lines are Tc vs time (above) or Tw−Tc vs Tw. (below). Dotted lines are dTc/dt vs Tc..
Figure 4: Typical microstructure of alloy A obtained at low cooling rate. Figure 5: Typical microstructure of alloy D obtained at low cooling rate. Figure 6: Typical microstructure of alloy D obtained at high cooling rate. Figure 7: Typical microstructure of alloy E obtained at low cooling rate. Figure 8: Typical microstructure of alloy E obtained at high cooling rate. Figure 9: Typical microstructure of alloy F obtained at low cooling rate.
Figure 10: Enlarged portion of Figure 9 showing Al5Cu2Mg8Si6 phase growing out of Al2Cu in alloy. Figure 11: Typical microstructure of alloy F obtained at high cooling rate.
Figure 12: Typical microstructure of alloy G obtained at low cooling rate. Figure 13: Typical microstructure of alloy G obtained at high cooling rate.
Figure 14: Fragmented β(FeCu) during solidification of alloy C at high cooling rate (compositions in
weight %).
Figure 15: DSC curves from samples previously cooled at: (a) low cooling rate; (b) high cooling rate. Figure 16: Calculated volume fractions for alloys A to G solidified at the lower cooling rate.
Figure 17: Calculated mass fraction evolutions of 4 secondary phases in alloy D. Figure 18: Microstructure of alloy G after soaking and quenching at 560ºC.
Figure 19: Al-Si master alloy. Backscaterred image and mapping for silicon and oxygen. Figure 20: Microstructure of alloy G after soaking and quenching at 520ºC.