Publisher’s version / Version de l'éditeur:
Journal of ASTM International, 4, September 8, pp. 1-18, 2007-09-01
READ THESE TERMS AND CONDITIONS CAREFULLY BEFORE USING THIS WEBSITE. https://nrc-publications.canada.ca/eng/copyright
Vous avez des questions? Nous pouvons vous aider. Pour communiquer directement avec un auteur, consultez la
première page de la revue dans laquelle son article a été publié afin de trouver ses coordonnées. Si vous n’arrivez pas à les repérer, communiquez avec nous à PublicationsArchive-ArchivesPublications@nrc-cnrc.gc.ca.
Questions? Contact the NRC Publications Archive team at
PublicationsArchive-ArchivesPublications@nrc-cnrc.gc.ca. If you wish to email the authors directly, please see the first page of the publication for their contact information.
Archives des publications du CNRC
This publication could be one of several versions: author’s original, accepted manuscript or the publisher’s version. / La version de cette publication peut être l’une des suivantes : la version prépublication de l’auteur, la version acceptée du manuscrit ou la version de l’éditeur.
For the publisher’s version, please access the DOI link below./ Pour consulter la version de l’éditeur, utilisez le lien DOI ci-dessous.
https://doi.org/10.1520/JAI101031
Access and use of this website and the material on it are subject to the Terms and Conditions set forth at
Investigation of the effect of heat on specially formulated thermoplastic
polyolefin (TPO) films by thermogravimetry, dynamic mechanical
analysis, and fourier transform infrared spectroscopy
Delgado, A. H.; Howell, G.; Ober, R.; Oliveir, P. E.; Peterson, A.; Boon, R.;
Paroli, R. M.
https://publications-cnrc.canada.ca/fra/droits
L’accès à ce site Web et l’utilisation de son contenu sont assujettis aux conditions présentées dans le site
LISEZ CES CONDITIONS ATTENTIVEMENT AVANT D’UTILISER CE SITE WEB.
NRC Publications Record / Notice d'Archives des publications de CNRC:
https://nrc-publications.canada.ca/eng/view/object/?id=2ce0dce7-46e4-4b10-9cc6-a24869e92bf5 https://publications-cnrc.canada.ca/fra/voir/objet/?id=2ce0dce7-46e4-4b10-9cc6-a24869e92bf5
I n v e s t i g a t i o n o f t h e e f f e c t o f h e a t o n
s p e c i a l l y f o r m u l a t e d t h e r m o p l a s t i c p o l y o l e f i n
( T P O ) f i l m s b y t h e r m o g r a v i m e t r y , d y n a m i c
m e c h a n i c a l a n a l y s i s , a n d F o u r i e r t r a n s f o r m
i n f r a r e d s p e c t r o s c o p y
N R C C - 4 9 7 1 9
D e l g a d o , A . H . ; H o w e l l , G . ; O b e r , R . ; O l i v e i r a ,
P . E . ; P e t e r s o n , A . ; B o o n , R . ; P a r o l i , R . M .
A version of this document is published in / Une version de ce document se trouve dans: Journal of ASTM International, v. 4, no. 8, Sept. 2007, pp. 1-18
Doi: 10.1520/JAI101031
The material in this document is covered by the provisions of the Copyright Act, by Canadian laws, policies, regulations and international agreements. Such provisions serve to identify the information source and, in specific instances, to prohibit reproduction of materials without written permission. For more information visit http://laws.justice.gc.ca/en/showtdm/cs/C-42
Les renseignements dans ce document sont protégés par la Loi sur le droit d'auteur, par les lois, les politiques et les règlements du Canada et des accords internationaux. Ces dispositions permettent d'identifier la source de l'information et, dans certains cas, d'interdire la copie de documents sans permission écrite. Pour obtenir de plus amples renseignements : http://lois.justice.gc.ca/fr/showtdm/cs/C-42
Ana H. Delgado,1 George Howell,2 Randy Ober,3 Paul E. Oliveira,4 Arnold Peterson,5 Richard Boon,6 and Ralph M. Paroli1
Investigation of the Effect of Heat on Specially Formulated
Thermoplastic Polyolefin „TPO… Films by Thermogravimetry,
Dynamic Mechanical Analysis, and Fourier Transform
Infrared Spectroscopy
ABSTRACT: To explore the use of chemical methods of analysis in investigating the performance of
thermoplastic polyolefins 共TPO兲, the ASTM D08.18 Subcommittee undertook a study to evaluate TPO films of known composition. These specially formulated films with varying amounts of stabilizers were heat-aged for up to 56 days according to ASTM D 6878-03 and then analyzed using dynamic mechanical analysis 共DMA兲, thermogravimetry 共TG兲, and Fourier transform infrared 共FTIR兲 spectroscopy. These techniques were found to be useful in characterizing the effect of heat on the TPO films under study and it is believed that they could be used to evaluate actual TPO membranes. Please note that these are films and not roof membranes. The formulations used for the films could be modified for use in actual membranes.
KEYWORDS: TPO, chemical properties, heat aging, dynamic mechanical analysis 共DMA兲, Fourier
transform infrared 共FTIR兲 spectroscopy, thermogravimetry 共TG兲, mass loss, derivative of TG 共DTG兲
Introduction
Thermoplastic olefin 共TPO兲, in general, is a polymer blend of polypropylene 共PP兲, ethylene propylene, rubber 共EPR兲, polyethylene 共PE兲, pigments, fillers, and additives 关1兴. Thermoplastic polyolefins are in the thermoplastic elastomer family and commonly referred as a TPO in the single-ply roofing industry. TPO roofing membranes are typically based on PP and EPR polymerized together using state-of-the-art polymer manufacturing technology 关2兴. The TPO resin is compounded with other components including heat, light and UV stabilizers, fire retardants, and pigments for color to provide stability against the elements asso-ciated with outdoor exposure 关3兴. For example, the effectiveness of a light stabilizer depends on factors such as solubility and concentration in the polymer matrix.
The physical loss of a stabilizer can occur by diffusion to the polymer surface during exposure 关4兴, by photochemical reactions and degradation 关5兴, and by evaporation and leaching from the polymer surfaces 关6兴. UV and FTIR analysis of low density polyethylene 共LDPE兲 films before and after exposure to natural weathering and accelerated photo-oxidative conditions 关7兴 suggested that the photostabilizer disappearance for HALS 共hindered amine light stabilizer兲 content above 0.4 % 共w/w兲 is most probably due to its physical loss for long photo-oxidation times under the conditions used. However, the photostabilizer disappearance at the initial stage was due to chain scission with a consequent volatilization and diffusion of these fragments on the surface. The most serious physical losses observed are from articles such as fibers, thin films, and coatings, which have a high surface to volume ratio.
Evaluation of the physical and chemical properties of polymeric roofing membranes before and after
Manuscript received February 1, 2007; accepted for publication August 13, 2007; published online September 2007. Presented at ASTM Symposium on Roofing Research and Standards Development: Sixth Symposium on 2 December 2007 in Tampa, FL; W. Rossiter and T. Wallace, Guest Editors.
1National Research Council of Canada—Institute for Research in Construction, 1200 Montreal Road, Bldg. M20, Ottawa, ON K1A 0R6 Canada.
2
UVTEC, Inc., 1121 108th Street, Arlington, TX 76011. 3
Carlisle Syntec, P.O. Box 7000, 1555 Ritner Highway, Carlisle, PA 17013. 4
Firestone Building Products, 525 Congressional Blvd., Carmel, IN 46032-5607. 5Stevens Roofing, Route #2, Box 136, Westfield, NC 27053.
6
Consuper, 7901 S. Adams Way, Littleton, CO 80122.
Paper ID JAI101031 Available online at www.astm.org
exposure to natural and accelerated laboratory exposure is of paramount importance to obtain information on the performance of the material. The minimum physical requirements of roofing membranes as speci-fied in ASTM D 6878, “Specifications for Thermoplastic Polyolefin Based Sheet Roofing” 关8兴 developed by the task group of the D08.18 Subcommittee involves accelerated laboratory aging and the use of physical and mechanical methods of analysis for membrane performance evaluation.
Based on previous work 共see Refs 关9–23兴兲, it is known that chemical methods of analysis can be of assistance in understanding the causes of degradation of polymeric roof membranes such as EPDM, PVC, TPO, etc. Therefore, the ASTM D08.18 task group undertook the study of specially formulated TPO films to investigate the usefulness of chemical methods of analysis.
Seven specially formulated thermoplastic polyolefin 共TPO兲 film samples 共approximately 203 by 279 by 0.35 mm兲 共⬃8 by 11 by 0.01 in.兲 labeled A through G were prepared by a TPO manufacturer and sent to the National Research Council, Institute for Research in Construction 共NRC—IRC兲 to evaluate the chemical properties before and after heating at 116° C for up to 56 days. A generic composition of the specially formulated films is given in Table 1 and graphically represented in Fig. 1. Dynamic mechanical analysis 共DMA兲, thermogravimetric analysis 共TG兲, and Fourier transform infrared 共FTIR兲 spectroscopy were performed on the film samples before and after heating. The goal of this study is not to investigate in detail the degradation process but to evaluate the usefulness of these techniques for evaluating the performance of TPO roofing membranes when field failures occur.
Experimental
Sample Preparation and Exposure
Each of the received TPO films was labeled A–G and cut into strips to allow for ten different heating periods 共exposure times兲. One of the strips was used as the control and was conditioned at 80° C for one hour in an air convection oven as per ASTM D 6878-03 关8兴 to provide a consistent thermal history while the other specimens were placed in an oven and heated at 116° C up to 56 days. The position of the film specimens on the oven racks was changed on a weekly basis. For example, if on the first week of exposure, the specimen occupied the left corner of one of the oven racks, the following week, it was moved to the
TABLE 1—Composition of the TPO films.
Component
Sample 共phra兲
A B C D E F G
Polypropylene 100 100 100 100 100 100 100 Low molecular weight NON hindered
amine light stabilizer 共NON HALS兲
0.6 0.5 0.5 0.2 0.2 0.2 0 Hindered amine light stabilizer 共HALS兲 0.8 0.5 0.5 0.2 0.2 0 0
UV absorber 0.8 0.5 0.2 0.2 0 0 0
a
Part per hundred resin.
opposite corner, and so on, until the specimen occupied the four corners and center of the rack. Then, the specimen was moved to the next rack and the process was repeated. This was to ensure that all samples receive the same heat exposure.
A specimen was removed from the oven every seven days, labeled and stored in a desiccator until conducting the analysis. A specimen from each sample was also removed from the oven after ten days. For analysis purpose, the suffix “c” was added to the control film specimens and the heating period followed by the suffix “d” was added to the heated ones. For example, Sample Ac, was the control specimen for Sample A, while, A14d refers to the specimen that was heated for 14 days. This labeling system was used for all analyses.
Due to unexpected electrical power shutdown in the building on two weekends during heating periods, the 28, 35, 42, and 49-day periods were shortened by 17 hours.
Dynamic Mechanical Analysis (DMA)
Two Rheometric Scientific 共now TA Instruments兲 Solid Analyzers 共RSAII and RSAIII兲 equipped with an environmental controller and film geometry 共tool兲 were used to measure the glass transition temperature 共Tg兲 of the specimens in tension mode. Thin film specimens were carefully cut with a sharp utility knife 共see Table 2 for dimensions兲 from each of the control and heat-aged samples. The film specimen was placed in the film tool 共geometry兲 making sure it was properly loaded. The gap between the upper and lower parts of the tool was measured with a gage and the value used as the specimen length. The specimen was cooled to −80° C, the temperature was allowed to stabilize for five minutes and increased at 2 ° C / min to the final temperature program. The test was conducted as per ASTM D 5026-01 关24兴 under the experi-mental parameters in Table 2. All analyzed specimens were run at least in duplicate. If the Tgof the two runs differed by more than 2 ° C, a third specimen was analyzed.
Thermogravimetric Analysis (TG/DTG)
A Seiko Simultaneous Thermal Analyzer 共STA兲 TG/DTA 320 was used to measure the thermal stability of the samples as per ASTM D 6382-99 关25兴. A piece 共5 – 20 mg兲 was taken from two different areas of the specimen, cut in smaller pieces, and heat aged at 20° C / min from 25 to 600° C under ultra high purity nitrogen and from 600 to 1000° C under ultra zero air. A flow rate of 150 mL/ min was used for both gases. All samples were run at least in duplicates. If the difference in mass loss between the two runs of the same specimen was 3 % or greater, a third or fourth run was carried out. The sample labeling system used in the DMA analysis was also used for the TG analysis.
Fourier Transform Infrared (FTIR) Spectroscopy
A Nicolet Nexus 870 infrared spectrometer equipped with a DTGS detector and a Spectra Tech Thunder-dome attenuated total reflectance 共ATR兲 accessory with a germanium 共Ge兲 crystal was used to collect the spectra of the samples. The specimen was placed on the Ge crystal of the Thunderdome accessory and scanned under the following collection parameters: 32 scans, 4 cm−1 resolution, and 0.6329 cm/ s mirror
TABLE 2—Experimental parameters.
Geometry: Film
Sweep type: Dynamic Temperature Ramp
Dimensions: Thickness:0.32– 0.38 mm; Width:1.23– 1.44 mm Length:19.23– 22.65 mm
Frequency: 1 Hz 共6.28 rad/ s兲
Temperature program: −80° C to 50° C
Ramp Rate: 2 ° C
Soak Time: 1 minute
Time per Measure: 40 seconds
Strain: 0.1 %
Autotension Mode: ON static force tracking dynamic force 共25 %兲
Autostrain Mode: On
velocity. The Ge crystal was cleaned between each specimen with a mixture of acetone-toluene 共50 + 50兲 using a cotton swab. The solvent was allowed to evaporate for 10 to 15 minutes before scanning the next specimen. The sample spectrum was ratioed against a background collected from the Ge crystal before each sample. The ATR, normalization scale, and automatic baseline correction routines from the Omnic software 共Nicolet兲 were applied to all spectra before plotting.
Results and Discussion
Dynamic Mechanical Analysis (DMA)
Tables 3–8 summarize the average glass transition temperature 共Tg兲 of the film samples 共control and heated兲, the changes in the glass transition temperature 共⌬Tg兲 and the storage modulus 共E⬘兲 values at 21° C for each heating period. Each entry is the average and standard deviation of at least two individual measurements. The Tgwas obtained from both the intersect of two tangents on the storage modulus 共Eint⬘ 兲
and the maximum of the loss modulus 共Emax⬙ 兲 curves as shown in Fig. 2.
The Tg obtained from the Eint⬘ shows the same trend as that of Emax⬙ ; hence, only the latter will be
discussed. Note that due to an electrical power shut down, heating periods for 28 through 49 days were reduced by 17 hours 共see Tables 3–8兲. However, the weekly period labeling system will be used hereafter for easy reference.
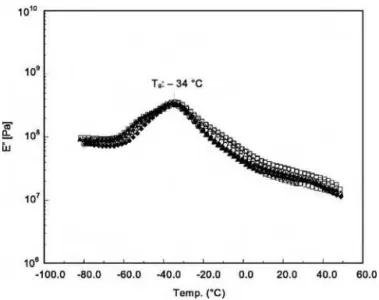
The glass transition temperature, Tg共Emax⬙ 兲, of film specimens for Sample A 共Table 3兲 remained almost
unchanged at −34° C regardless of the heating period. This sample contained all of the stabilizers. The FIG. 2—Typical DMA plot showing how the Tgwas obtained from E⬘and E⬙curves.
TABLE 3—Summary of average glass transition temperature of Sample A. Sample ID Exposure Type Tg共Eint⬘ 兲 °C ⌬Tg共Eint⬘ 兲 Tg共Emax⬙ 兲 °C ⌬Tg共Emax⬙ 兲 E⬘⫻108, 共Pa兲 at21° C Comments 0 −44± 0a −35± 1a 0 2.0± 0.4a Control 7d / 116° C −43± 0 +1 −34± 0 +1 2.5± 0.1 10d / 116° C −44± 0 −34± 0 +1 2.6± 0.0 14d / 116° C −44± 0 0 −34± 0 +1 2.9± 0.1 A 21d / 116° C −43± 1 +1 −34± 0 +1 2.4± 0.5 28d / 116° C NA NA NA Not analyzed 35d / 116° C −43± 0 +1 −34± 0 +1 1.7± 0.1 42d / 116° C −44± 1 0 −36± 0 −2 2.0± 0.0 49d / 116° C −44± 0 0 −36± 0 −2 2.0± 0.0 56d / 116° C −43± 0 +1 −34± 0 +1 1.9± 0.2 a ± = Standard deviation.
overlay of the E⬙curves in Fig. 3 shows that the maximum of the E⬙curve is the same for the control and heated specimens. A similar trend was observed in the E⬙curves for the analyzed specimens from the other six samples. Therefore, their E⬙curves will not be shown due to space limitation.
The ⌬Tg of −2 ° C observed for specimens exposed for 42 and 49 days is considered within the experimental error of the measurements of ±2 ° C. Neither the Tg 共Emax⬙ 兲 nor the storage modulus 共E⬘兲 at
21° C showed significant changes after exposure. Note that for heating periods greater than 21 days, the E⬘ values of the heated specimens decreases slightly and it is closer to that of the control specimen. However, this slight decrease may be due to experimental errors such as sample loading rather than to the heat treatment. Noise can also affect the E⬘values, which are read off the curve without any smoothing. If the heating is responsible for the decrease in the E⬘values, then the samples became slightly softer suggesting slightly compositional changes 共e.g., degradation兲.
Table 4 summarizes the DMA results for Sample B. Results showed that for the analyzed specimens, heating up to 42 days did not have a major effect on their Tgand E⬘value at 21° C. Visual observations showed that specimens heated for 49 and 56 days underwent considerable degradation. They became very brittle and the slightest touch resulted in crumbling 共this sample contained lower amounts of stabilizers than Sample A兲. Therefore, it was not possible to either prepare the specimen or to load it in the fixture because it broke into smaller fragments due to material degradation.
Sample C 共Table 5兲 showed a similar trend as Sample B. For exposure times less than 42 days, there was no significant effect on Tg 共Emax⬙ 兲, which remained almost unchanged at −34° C and there was not much variation in the storage modulus 共E⬘兲. Again, the specimens heated for 49 and 56 days were ex-tremely brittle and it was not possible to analyze them by DMA.
The average Tgand E⬘values for Samples D and E are given in Tables 6 and 7. Again, no significant changes are observed in the Tgvalues of both analyzed samples. The D specimens heated for 14, 21, and
FIG. 3—Overlay of E⬙ curves of Sample A (control and heated).
TABLE 4—Summary of average glass transition temperature of Sample B. Sample ID Exposure Type Tg共Eint⬘ 兲 °C ⌬Tg共Eint⬘ 兲 Tg共Emax⬙ 兲 °C ⌬Tg共Emax⬙ 兲 E⬘⫻108, Pa at21° C Comments 0 −44± 1a 0 −34± 0a 0 2.6± 0.2a Control 7d / 116° C −43± 0 +1 −34± 0 0 2.5± 0.2 10d / 116° C −44± 0 0 −34± 0 0 2.1± 0.1 14d / 116° C −45± 1 −1 −34± 0 0 2.5± 0.7 B 21d / 116° C −44± 1 0 −34± 0 0 2.5± 0.1 28d / 116° C NA … NA NA Not analyzed 35d / 116° C −45± 1 −1 −35± 1 −1 2.9± 0.1 42d / 116° C −42± 0 +1 −34± 0 0 2.4± 0.3
49– 56d / 116° C NA NA NA Not analyzed. Too brittle a
28 days showed a slight increase in the modulus 共E⬘兲 values. It was not possible to analyze the 35-day specimen because it became very brittle and crumbled on cutting. After 28 days of heating, E specimens also became very brittle.
Samples F and G were both greatly affected by the heating treatment 共Table 8兲. Sample F showed considerable degradation after 14 days of heating to the point of crumbling. Sample G showed a similar degradation at ten days of exposure 共Fig. 4兲. For the analyzed specimens from F and G samples, the glass transition temperatures as well as the measured moduli values were similar to those of the other analyzed samples.
Modulated Differential Scanning Calorimetry (MDSC™)
Since it was not possible to measure the Tgof some of the heated specimens from Samples B–G by DMA, preliminary analysis using modulated differential scanning calorimetry 共MDSC™兲 was carried out on some of the heated film specimens. The control and 56 days of Sample A, as well as Samples D 共35 days兲, F 共21 days兲, and G 共14 days兲 were analyzed by MDSC™. The Tg of Sample A 共control and heated兲 was measured by DMA; therefore, this will allow establishing a comparison between the Tgtrend observed by
TABLE 5—Summary of average glass transition temperature of Sample C. Sample ID Exposure Type Tg共Eint⬘ 兲 °C ⌬Tg共Eint⬘ 兲 Tg共Emax⬙ 兲 °C ⌬Tg共Emax⬙ 兲 E⬘⫻108, Pa at21° C Comments 0 −44± 1a 0 −34± 0a 0 2.5± 0.1a Control 7d / 116° C −43± 0 +1 −34± 0 0 2.2± 0.7 10d / 116° C −44± 0 0 −34± 0 0 2.9± 0.0 14d / 116° C −46± 1 −2 −34± 0 0 2.5± 0.3 C 21d / 116° C −43± 1 +1 −34± 0 0 2.2± 0.3 28d / 116° C NA NA NA Not analyzed 35d / 116° C −45± 1 −1 −34± 0 0 2.8± 0.1 42d / 116° C −42± 0 +2 −34± 0 0 2.2± 0.5
49– 56d / 116° C NA NA NA Not analyzed. Too brittle a
± = Standard deviation.
TABLE 6—Summary of average glass transition temperature of Sample D. Sample ID Exposure Type Tg共Eint⬘ 兲 °C ⌬Tg共Eint⬘ 兲 Tg共Emax⬙ 兲 °C ⌬Tg共Emax⬙ 兲 E⫻108, Pa at21° C Comments 0 −42± 0a 0 −34± 0a 0 2.2± 0.1a Control 7d / 116° C −42± 1 +1 −34± 1 0 2.0± 0.0 10d / 116° C −44± 0 −2 −34± 0 0 2.1± 0.0 D 14d / 116° C −44± 0 2 −34± 0 0 2.9± 0.0 21d / 116° C −43± 0 −1 −34± 0 0 2.5± 0.1 28d / 116° C −42± 0 0 −34± 0 0 2.6± 0.1
35– 56d / 116° C NA NA NA Not analyzed. Too brittle a
± = Standard deviation.
TABLE 7—Summary of average glass transition temperature of Sample E. Sample ID Exposure Type Tg共Eint⬘ 兲 °C ⌬Tg共Eint⬘ 兲 Tg共Emax⬙ 兲 °C ⌬Tg共Emax⬙ 兲 E⬘⫻108, Pa at21° C Comments 0 −43± 0a 0 −34± 0a 0 1.9± 0.2a Control 7d / 116° C −42± 0 +1 −34± 0 0 2.0± 0.1 10d / 116° C −44± 0 −1 −34± 0 0 2.2± 0.1 E 14d / 116° C −44± 1 1 −34± 0 0 3.2± 0.1 21d / 116° C −42± 0 +1 −33± 1 +1 2.4± 0.0
28– 56d / 116° C NA NA NA Not analyzed. Breaks on cutting a
DMA and DSC. The analysis was performed from −80 to − 100° C at 2 ° C / min, an amplitude ±0.318° C and a 60-second period. The Tg of the film samples summarized in Table 9 was obtained from the derivative of the reverse heat capacity 共Cp兲 curves, which will not be shown.
Preliminary MDSC™ results 共Table 9兲 suggests that Sample A has a Tgat −37° C and another at 44° C. Sample D only shows a Tg at −28° C. The reverse heat capacity curves 共not shown兲 for Sample F has a peak at −25° C and a shoulder at −15° C. The curve for Sample G, on the other hand, displays Tgs at −19, −10, and +68° C. The multiple Tg observed in the film samples may result from the PE polymer or poor miscibility of the components in the polymer matrix. Glass transitions ranging from −25 to − 120° C have been reported for PE 关26兴. The lack of agreement among research is related to the fact that PE is not commonly accessible in the amorphous state 共below its melting temperature兲 due to its extremely high crystallization rate originated from the perfect chain structure 关27兴.
The Tg 共−37° C兲 of the control and 56-day specimens of Sample A is ⬃3 ° C lower than those mea-sured by DMA 共Table 3兲. Although the Tgof these two samples measured by MDSC™ is lower than that measured by DMA; it follows the same trend indicating that heating of Sample A up to 56 days did not have a significant effect on its Tg. Previous work on measurements of Tg of roofing materials by DMA, TMA, and DSC 关28兴 showed that the Tgof unheated and heated EPDM roofing samples obtained from the maximum of the loss modulus curve 共Emax⬙ 兲 as measured by DMA is slightly warmer than that measured by
TABLE 8—Summary of average glass transition temperature of Sample F and G. Sample ID Exposure Type Tg共Eint⬘ 兲 °C ⌬Tg共Eint⬘ 兲 Tg共Emax⬙ 兲 °C ⌬Tg共Emax⬙ 兲 E⬘⫻108, Pa at21° C Comments 0 −44± 1a 0 −34± 0a 0 2.4± 0.1a Control F 7d / 116° C −43± 1 +1 −34± 0 0 2.0± 0.0 10d / 116° C −44± 0 0 −34± 0 0 2.3± 0.1 14d / 116° C −42± 0 +2 −33± 1 +1 2.9± 0.1
21– 56d / 116° C NA NA NA Not analyzed. Too brittle 0 −43± 0a −34± 0a 2.7± 0.2a Control
G 7d / 116° C −44± 1 −1 −34± 0 0 2.0± 0.3
10d / 116° C −42± 1 +1 −31± 1 +3 3.0± 0.4 Signs of degradation at10 days
14d / 116° C NA NA NA Not analyzed—Sample crumble
a
± = Standard deviation.
FIG. 4—Sample G after ten days at 116° C.
TABLE 9—Summary of average glass transition temperature measured by MDSC™. Sample ID Exposure Type Tg共MDSC™兲 °C A 0 −37/ + 44 56d / 116° C −37/ + 44 D 35d / 116° C −28 F 21d / 116° C −25/ −15/ + 43 G 14d / 116° C −19/ −10/ + 68
DSC. Hence, it is reasonable to say that the Tg of the specimens from Sample D 共35 days兲, F 共21 days兲, and G 共21 days兲 can be considered as an indication of increases in their Tgof the analyzed film specimens due to heating.
Thermogravimetric Analysis (TG/DTA)
The average mass losses between 25 and 1000° C for the specially formulated TPO film samples are summarized in Tables 10–16. Each entry is the average and standard deviation of at least two individual measurements. Under the experimental conditions used, the control film specimens can be considered thermally stable up to approximately 250° C and start to decompose near 350° C. The analyzed heated specimens, however, appear to be slightly less thermally stable than the control specimens. Both heated and control specimens analyzed display 60–71 % mass loss from 25– 590° C under a nitrogen atmosphere due to the decomposition of organic components, approximately 1 % between 590 and 1000° C under air 共inorganic兲, except Samples F and G which show 2–4 % mass loss in this region after 14 days of heating. All analyzed specimen display a 27–33 % residue.
Overlays of the derivative of the mass loss 共DTG兲 curves for all samples are shown in Figs. 5–11. The DTG curves for the analyzed control specimens showed an unresolved DTG peak between 350 and 550° C with a maximum rate of decomposition in the range of 468– 481° C and a shoulder near 450° C. The higher temperature mass loss corresponds to decomposition of the polymer matrix, whereas the shoulder may be due to additives 共e.g., stabilizers, flame retardants, etc.兲. Due to the large amount of data only the DTG curves displaying differences will be shown.
Some of the overlays do not have DTG curves for all heating periods. After exposure, it was not possible to measure the mass loss of some specimens using a 20-mg sample size because large spikes in the signals between 300 and 450° C were observed. The sample mass was then reduced by at least half 共see Tables 11–15兲 but the signal problem persisted for some of the heated specimens. To further investigate the signal problem, Samples C, D, E, which still showed the problem were reanalyzed by TG using a 5 mg mass. No signal problem was observed for this mass size. Please note that only the heating period where the signal problem persisted was investigated. It is not known if samples heated for longer periods 共e.g., 42– 56 days兲 will show the same problem when using the latter mass size.
The signal problem encountered during the TG analysis may be due to either some material flying out of the measuring pan or exothermic reactions occurring during heating. The causes are not fully under-stood, but a possible explanation is that heating may have affected significantly the chemical composition of the specimen and as a result either the combustion rates changed or its density decreased so the gas flow removed material from the pan. It is also possible that the heat exposure may have decreased the effec-tiveness of the flame retardant. Sample A has the highest content of NON HALS such as flame retardant, whereas G does not have any. It is interesting to note that the specimens where such a problem was encountered corresponded to those that became very brittle with heating and DMA testing was not pos-sible.
The control and heated specimens from Sample A show a similar mass loss 共Table 10兲. The major DTG peak at 468° C in Fig. 5 corresponding to the decomposition of the polymer matrix and the shoulder at 423° C remains unchanged for all specimens from this sample. This is an indication that heating up to
TABLE 10—Summary of average mass loss of TPO Sample A.
Sample ID Exposure Type Mass Loss 共%兲 Residue % Comments Nitrogen 25– 590° C Air 590– 1000° C 0 71.2± 0.2a 0.9± 0.1a 27.9± 0.2a Control 7d / 116° C 71.1± 0.3 0.8± 0.1 28.1± 0.2 A 14d / 116° C 71.1± 0.2 0.9± 0.1 28.1± 0.1 21d / 116° C 71.3± 0.1 0.8± 0.0 28.0± 0.1 35d / 116° Ca 71.2± 0.2 0.8± 0.1 27.9± 0.1 49d / 116° C 70.8± 0.3 0.9± 0.1 28.4± 0.2 56d / 116° C 71.0± 0.1 1.0± 0.1 28.1± 0.1 a ± = Standard deviation.
56 days did not affect significantly its chemical composition. This sample has the highest content of all stabilizers used 共Table 1兲; hence, it would be expected that heating up to 56 days might have a lesser effect on this film than on the others.
Control and heated specimens from Sample B 共Table 11兲 showed mass losses similar to Sample A. For heating periods above 35 days, the shoulder observed in the DTG curves 共Fig. 6兲 at approximately 425° C became more resolved, noisier, and its maximum shifted to near 375° C. This is an indication that heating periods greater than 35 days affected the thermal stability of the sample. Another indication of degradation is the fact that it was necessary to reduce the mass size by half for the 56-day specimen due to signal problem. These results are consistent with the observations when attempting to prepare the specimens
FIG. 5—DTG overlay for Sample A.
TABLE 11—Summary of average weight loss of TPO Sample B.
Sample ID Exposure Type Mass Loss 共%兲 Residue % Comments Nitrogen Air 25– 300° C 25– 590° C 590– 1000° C 0 71.2± 0.4a 0.8± 0.1a 28.0± 0.4a Control 7d / 116° C 70.8± 0.3 0.9± 0.1 28.3± 0.2 14d / 116° C 71.4± 0.14 0.8± 0.0 27.8± 0.1 B 21d / 116° C 71.0± 0.2 0.8± 0.1 28.3± 0.1 35d / 116° C 71.0± 0.07 0.8± 0.1 28.2± 0.1 42d / 116° C 71.3± 0.2 0.9± 0.1 27.9± 0.1 49d / 116° Ca 2.9± 0.0 70.1± 0.0 0.8± 0.0 28.5± 0.0 56d / 116° C 2.8± 0.2 69.6± 0.0 1.0± 0.1 29.4± 0.1 Reduced mass共10 mg兲 a ± = Standard deviation.
heated for 49 and 56 days for DMA analysis. They became brittle and it was not possible to measure their
Tg. This TPO film has equal parts per hundred resins 共phr兲 of stabilizers 共Table 1兲 but lower than Sample A. The signal problem observed for the sample heated for 56 days may be an indication that such heat exposure may have diminished the effect of one of the stabilizers.
The average mass losses for Sample C are given in Table 12. The mass loss for the analyzed specimens heated up to 42 days remained almost unchanged. The sample showed similar behavior to that of Sample B for 49 days of heating for which half of the original mass was used, but for 56 days, signals problem continued. Therefore, the mass size was further reduced. From the DTG curves 共Fig. 7兲, it can be seen that the shoulder maximum at 425° C shifted to near 385° C for 56 days at which point it was almost fully resolved, which explains the 22 % mass loss 共Table 12兲 in the temperature range of 25– 402° C. The mass loss up to 300° C is higher than for 49 days. A slight shift to lower temperature is observed in maximum of the DTG peak for the 49 and 56-day specimens. This suggests material degradation as a result of heating. It can be observed that the signal problem for this sample appears at an earlier heating period than in Sample B. The difference in the chemical composition of Sample C and B is the UV absorber content which is lower in the former. Therefore, the signal problem may be attributed to effect of heat on one of the stabilizers.
Specimens from Sample D showed a similar mass loss pattern through the first 28 days of heat exposure 共Table 13 and Fig. 8兲. No major changes were observed until 28 days of heating. The 35-day specimens degraded and it was necessary to reduce the original mass by at least half to analyze them by TG. The DTG curves showed a shoulder on the DTG peak up to 28 days. This shoulder is fully resolved for the 35-day specimen, which explains the loss ⬃23 % up to 402° C 共Table 13兲. No mass loss data are available for specimens heated for periods longer than 35 days because signs of degradation started to appear at this heating period. Only the heating periods at which the signal problem was first encountered were analyzed. Again, it was observed that the signal problem corresponded to specimens that were too
TABLE 12—Summary of average mass loss of TPO Sample C.
Sample ID Exposure Type Mass Loss 共%兲 Residue % Comments Nitrogen Air 25– 300° C 25– 402° C 25– 590° C 590– 1000° C 0 71.0± 0.2a 0.9± 0.0a 28.1± 0.2a Control 7d / 116° C 70.7± 0.1 0.9± 0.0 28.4± 0.1 14d / 116° C 71.0± 0.1 0.8± 0.0 28.2± 0.1 C 21d / 116° C 71.9± 1.2 0.9± 0.1 27.3± 1.1 35d / 116° C 71.0± 0.0 0.9± 0.0 28.1± 0.0 42d / 116° C 70.7± 0.1 0.9± 0.0 28.4± 0.1 49d / 116° C 2.2± 2.2 70.8± 0.6 1.0± 0.1 28.2± 0.4 Reduced mass共10 mg兲 56d / 116° C 3.7± 0.6 21.9± 1 69.6+ 0.1 0.8± 0.5 29.7± 0.4 Reduced mass共5 mg兲 a ± = Standard deviation.
brittle for DMA testing, indicating degradation of the material due to heat aging. The signal behavior for this sample is consistent with the observations made for Sample C regarding the effect of heating periods on one of the stabilizers. Although Sample D has equal phr 共0.2兲 of each stabilizer 共Table 1兲, the phr content of NON HALS and HALS is lower than Sample C.
If the behavior of the film samples with increasing heating periods is due to the heat effect on a specific stabilizer, it is reasonable to expect that samples will show a similar behavior as stabilizer content decreases. For example, Sample B has the same components but lower phr than A. Sample C has only lower phr of UV absorber than B. In fact, the TG results showed that signs of degradation for Sample C are observed at earlier heating periods 共49 days兲 than in B 共56 days兲. Therefore, it may be tempting to attribute the signal problem 共degradation兲 to the UV absorber. However, this is not the case for Sample D, which has the same phr of UV absorber than C but lower phr of NON HALS and HALS stabilizers. This suggests that although each stabilizer is used for a specific purpose, their stabilizing effect on the final product may be a combined one rather than individual. From the film composition, it is difficult to attribute degradation of the films to a specific stabilizer because the phr of more than one stabilizer was varied in the same sample.
The average mass losses in Table 14 for Sample E show no major changes in the mass loss values for control and heated specimens up to 28 days. The TG analysis of the specimens heated for 35 days also required smaller mass than the 28-day specimens. No weight data are available for specimens heated above 35 days at which signs of degradation were first observed. The DTG curves for this sample are similar to those of Sample D and will not be included. The specimen heated for 21 and 35 days became brittle, which is a sign of degradation. This sample has the same phr of NON HALS and HALS but it has no UV absorber. Therefore, the behavior observed in the samples with increasing heating periods may not be related to UV stabilizer content.
The DTG curves in Fig. 9 for Sample F 共control and heated兲 showed a considerable shifting in the maximum of the peak at 477° C at 35 and 56 days of heating and the shoulder, somehow noisy, starts to resolve at 14 days and above. The mass loss for this sample summarized in Table 15 showed a slightly
TABLE 13—Summary of average mass loss of TPO Sample D.
Sample ID Exposure Type Mass Loss 共%兲 Residue % Comments Nitrogen Air 25– 300° C 25– 402° C 25– 590° C 590– 1000° C 0 70.8± 0.2a 1.0± 0.1a 28.3± 0.1a Control 7d / 116° C 70.7± 0.3 1.0± 0.1 28.4± 0.4 14d / 116° C 70.8± 0.21 0.8± 0.0 28.4± 0.21 D 21d / 116° C 71.2± 0.3 0.8± 0.1 28.1± 0.2 28d / 116° Ca 70.1± 0.5 0.4± 0.1 29.4± 0.5 35d / 116° C兲 4.9± 0.1 22.8± 0.1 68.0± 0.8 1.5± 0.1 30.6± 0.8 Reduced mass共5 mg兲 42– 56d / 116° Ca NA NA NA NA NA Not analyzed a ± = Standard deviation.
different pattern for the specimen heated above ten days. They display 3–6 % mass loss in the 25– 325° C range. It was not possible to quantify the mass loss from the DTG curve in this temperature range for specimens heated up to 14 days because the shoulder on the DTG peak was not fully resolved. For specimens heated above 14 days, the shoulder is fully resolved, which allows reading the mass loss of the curve.
The change in mass loss between the control and heated specimen 共21 days and more兲 of the F sample in the temperature range of 25– 590° C is about 5 %, which is above the CIB/RILEM recommended limit of 3 % 关29兴. This indicates that heating has a detrimental effect on the chemical composition of the sample.
TABLE 14—Summary of average mass loss of TPO Sample E.
Sample ID Exposure Type Mass Loss 共%兲 Residue % Comments Nitrogen Air 25– 300° C 25– 402° C 25– 590° C 590– 1000° C 0 70.9± 0.4a 0.9± 0.0a 28.3± 0.4a Control 7d / 116° C 70.9± 0.1 0.9± 0.0 28.2± 0.1 14d / 116° C 70.9± 0.1 0.9± 0.0 28.2± 0.1 E 21d / 116° C 71.1± 0.0 0.9± 0.0 28.0± 0.0 28d / 116° C 71.0± 0.2 0.8± 0.1 28.2± 0.2 35d / 116° C 4.9± 0.1 21.6± 0.2 68.0± 0.8 1.5± 0.1 30.6± 0.8 Reduced mass共5 mg兲 共42– 49兲d / 116° C NA NA NA NA NA Not analyzed 56d / 116° C NA NA NA NA NA Not analyzed a ± = Standard deviation.
FIG. 9—DTG overlay for Sample F.
TABLE 15—Summary of average mass loss of TPO Sample F.
Sample ID Exposure Type Mass Loss 共%兲 Residue % Comments Nitrogen Air 25– 300° C 300– 325° C 325– 590° C 25– 590° C 590– 1000° C 0 0.4± 0.1a 0.2± 0.0a 70.5± 0.2a 71.0± 0.1a 0.9± 0.1a 28.2± 0.1a 7d / 116° C 0.2± 0.1 0.2.± 0.1 70.4.± 0.0 70.8± 0.0 0.8± 0.0 28.4± 0.0 10d / 116° C 0.2± 0.0 0.2± 0.1 70.5± 0.1 70.9± 0.1 1.0± 0.1 28.2± 0.1 14d / 116° C 2.1± 0.4 0.7± 0.3 67.7± 0.6 70.4± 0.1 1.0± 0.1 28.5± 0.1 F 21d / 116° C 4.4± 0.3 1.8± 0.2 60.8± 0.1 67.1± 0.4 2.0± 0.1 30.9± 0.3 28d / 116° C 4.8± 0.1 1.6± 0.3 61.4± 0.4 67.8± 0.1 2.0± 0.2 30.3± 0.1 35d / 116° C 4.4± 0.1 1.6± 0.1 59.8± 0.1 66.0± 0.01 2.7± 0.0 31.4± 0.1 Reduced mass共10 mg兲 共42– 49兲d / 116° C NA NA NA NA NA NA Not analyzed 56d / 116° C 4.2± 0.2 1.8± 0.1 59.8± 0.1 65.8± 0.4 2.8± 0.2 31.4± 0.1 Reduced mass共10 mg兲 a ± = Standard deviation.
It is possible that the effectiveness of some of the additives 共e.g., stabilizers兲 decreased with heating and the sample became more susceptible to heating. In fact, this film has only NON HALS stabilizers.
Sample G showed mass losses below 300° C, ranging from 4 % at 10 days to 7 % at 21 days of heat exposure 共Table 16兲. At ten days the shoulder originally at 425° C became more resolved at 395° C 共Fig. 10兲. The major peak at 481° C also became broader as exposure time increased and shifted slightly to a lower temperature 共⬃460° C兲, indicating a deterioration of the material due to the heat. Moreover, a small peak at approximately 600° C also became more pronounced with exposure time. It was not possible to heat age the specimens from Sample G beyond 21 days since the specimen crumbled to the touch. DMA results showed a change in the material’s Tg共+3 ° C兲 after ten days which is consistent with the mass loss data.
Fourier Transform Infrared (FTIR) Spectroscopy
The spectra of some of the TPO films 共control and heated兲 are displayed in Figs. 11–15. Only spectra showing changes in their absorption bands after heating will be shown due to the large number of spectra. The purpose of the FTIR analysis was to ensure correlation between the three analysis techniques used in this study.
In general, the IR spectra of the films show an intense band at 3690 cm−1 that may result from OH in compounds such as Mg共OH兲2or other organoclays that are used in TPOs. Mg共OH兲2has been reported to
be an effective nonhalogen flame retardant and smoke suppressant 关30兴. Bands in the 3000– 2800 cm−1 region are due to the stretching vibrations of the CH3and CH2groups. The band at 1460 cm−1is attributed
to the CH3asymmetric bending and that at 1376 cm−1 results from the CH3 symmetric bending plus the
CH2wag and the C–C chain stretching. The spectrum of control and heated specimens from Sample A
共Fig. 11兲 showed slight differences in the absorption bands up 56 days of heating. The relative intensity of
TABLE 16—Summary of average mass loss of TPO Sample G.
Sample ID Exposure Type Mass Loss 共%兲 Residue % Comments Nitrogen Air 25– 300° C 300– 325° C 325– 590° C 25– 590° C 590– 1000° C 0 0.4± 0.1a 0.2± 0.1a 70.7± 0.7a 71.2± 0.7a 0.9± 0.1a 27.9± 0.8a Control 7d / 116° C 0.2± 0.1 0.1± 0.0 70.7± 0.0 71.0± 0.1 0.8± 0.1 28.1± 0.1 G 10d / 116° C 4.7± 1.1 0.8± 0.1 65.7± 0. 71.1± 0.7 1.4± 0.1 27.6± 0.8 14d / 116° C 7.2± 0.2 2.1± 0.1 56.4± 0.1 65.7± 0.4 3.2± 0.2 31.2± 0.6 21d / 116° C 7.4± 0.1 2.4± 0.0 53.1± 0.3 62.8± 0.2 4.3± 0.01 32.8± 0.1 共28– 56兲d / 116° C NA NA NA NA NA NA Not analyzed— Sample removed from oven at21 days
共crumbled兲 a
± = Standard deviation.
the band near 1600 cm−1 in the control specimens appears to decrease whereas its shoulder
共⬃1650 cm−1兲 becomes more defined with increasing heating periods but is still a weak absorption band.
The band and the shoulder may be due to the olefinic 共C v C兲 group vibrations. Amines also show bands near 1600 cm−1. Due to the intensity of the CH3 and CH2 bands in the 3000– 2800 cm−1 region, it is
difficult to see the shoulder; therefore, this region was expanded.
Specimens from Sample B 共Fig. 12兲 heated for 49 and 56 days show some additional bands at 1715 and 1598 cm−1, which may result from carbonyl 共C v O兲 and olefinic 共C v C兲 groups, respectively. The
presence of the carbonyl band is indicative of oxidation. Similar bands are observed in the same range for all heated samples depending on the heating period 共Figs. 13–15兲 for the same exposure time. The FTIR results confirm the DMA and TGA results. The latter show differences in the DTG curves of Sample B at 49 and 56 days and problems with brittleness were encountered with the same specimens during the DMA analysis.
Sample E did not show significant differences between the absorption bands of the control and heated specimens up to 28 days of heat exposure 共Fig. 13兲. However, there are additional bands at 1714 and 1596 cm−1 already observed in the spectrum of Sample B 共Fig. 12兲. A shoulder is also observed on the 1770 cm−1band near 1780 cm−1as well as another band at 1165 cm−1characteristic of CH
3that has been
attributed to crystalline PP 关31兴. The 2000– 800 cm−1 region was expanded in Fig. 13 for 35 days of heating to show the additional bands.
The spectra for Samples F and G are given in Figs. 14 and 15. The spectra of Sample F 共Fig. 14兲 FIG. 11—Sample A—Spectra of control and heated specimens.
indicate differences between the control and heated material at 21 days of heating whereas for G they are slightly visible at 10 days. Again, the 2000– 800 cm−1 region was expanded in Fig. 15 to show the
disappearance or decrease in the band at 1598 cm−1 with heating.
ATR analysis on the surface oxidation of thermoplastic olefin elastomer under ozone exposure 关32兴 indicated that after ozone exposure new IR bands were observed near 1746 cm−1 and 1714 cm−1 charac-teristic of carboxyl and carbonyl groups. The ozone attack on rubbery materials can form unstable ozo-nides and polymeric peroxide, and then cleave to generate oxygenated products, such as acids, esters, ketones, and aldehydes. The study also showed that unsaturated double bonds are a common product from saturated polymers under ozone attack. As a result a broad band near 1630 cm−1is attributed to the double
bond formation 共C v C兲. Although the type of exposure used on the TPO film samples is different from ozone exposure, it is possible that low phr of stabilizer combined with the long exposure resulted in a similar degradation. The bands characteristic of oxidation 共1780, 1714, and 1165 cm−1兲 observed in the ATR analysis of the TPO subject to ozone exposure 关32兴 were observed in the TPO film.
Results from the ATR-FTIR analysis have shown that this technique can be used to follow the changes in the samples due to heating. For example, the spectra of the control Samples B-F did not show absorp-tion bands near 1600 and 1165 cm−1 or the concentration of the component responsible for such a band is too low to be detected by the ATR technique, which is primarily a surface technique. However, at 35 days of heating, a weak broad band centered near 1650 cm−1is observed as well as the two new bands at 1598
and 1717 cm−1 at 49 and 56 days of heating. These two bands are observed in all heated samples and its
FIG. 13—Sample E—Spectra of control and heated specimens.
relative intensity appears to increase as the heating period increases suggesting the formation of carbonyl 共due to oxidation兲 and olefinic groups. The decrease and increase, or both, in the relative intensity of the IR bands as well as appearance of new ones are indicative of compositional or structural changes in the sample.
An FTIR surface sampling technique such as photoacoustic spectroscopy 共PAS兲 depth profiling, which has been reported to provide information on the stratification of components in TPO 关1,31兴, may help to gain more information on the heating of the samples under study.
Conclusions
1. With the exception of Sample A, all samples were susceptible to the heating schedule used in this study. Some of the samples underwent significant degradation after certain exposure periods. Some of them became brittle after 10 or 21 days whereas others degraded after 42 days.
2. No significant changes in the glass transition temperature measured by DMA of the analyzed samples were observed, except Sample G that showed a⌬Tg of +3 ° C after ten days of heating. However, one must remember that some specimens were too embrittled to be analyzed by DMA. 3. The degradation of the TPO film samples was confirmed by thermogravimetric analysis. The DTG overlay curves provided some evidence of the onset of degradation temperatures as significant changes in the DTG peaks were observed as a function of heating periods.
4. Certain specimens were not analyzed by TG due to signal problems 共spikes兲 encountered during the TG analysis. In these cases, the sample size was reduced by at least half and the test repeated for the heating period at which the problem was first encountered. It is possible that the remaining heating periods could be analyzed by further reducing the sample mass. Such problems were usually encountered with samples that showed physical degradation due to heat aging and corre-sponded to the exposure periods at which they had become brittle.
5. The FTIR analysis confirmed the DMA and TG results as well as the visual observations of the film samples. The spectra of the film samples showed that the changes observed in DMA and TG data are consistent with the spectra of each sample after exposure. For example, DMA, TG, and FTIR did not show significant changes for Sample A even after being heated for 56 days. How-ever, Sample G became gummy and broke easily after ten days of heating. This sample showed a +3 ° C increase in the Tg. The shoulder observed in the DTG curve of the control specimen heated for ten days became more resolved in the DTG curve showing an ⬃5 % mass loss between 25 and 300° C 共Table 16兲, which is not observed in the control sample.
6. The appearance of new IR bands on the heated film with heat exposure suggests that oxidation due to heat exposure may be the cause degradation since the bands observed by other researchers on oxidation of TPO has also been observed on the heated film specimens.
7. The study has demonstrated that DMA, TG, and FTIR are valuable analysis tools for evaluating TPO films:
• Sample degradation or failure was observed earlier with decreasing concentration of the stabi-lizer used. This can be correlated with the failure of the sample with increasing heating; • Based on the FTIR results, the main absorption bands to follow for the degradation are: 1596 and
1700 cm−1;
• In TG, the mass loss and DTG peak resolution associated with the increased heat aging corre-lated well with the about IR absorption bands; and
• Modulated DSC 共MDSC™兲 showed some potential as a analysis tool to measure the Tg of samples that could not be analyzed by DMA due to failure 共e.g., brittle兲.
Acknowledgments
We would like to thank Robert Glenns for helping with some of the experimental work.
References
关1兴 Pennington, B. D., Ryntza, R. A., and Urban, M. W., “Stratification in Thermoplastic Olefins 共TPO兲; Photoacoustic FT-IR Depth Profiling Studies,” Polymer, Vol. 40, 1999, pp. 4795–4803.
关2兴 Ober, R. and Oliveira, P., “TPO Roofing Membranes,” ASTM Stand. News, 2003. 关3兴 Bonekamp, J. E. and Maecker, N. L., J. Appl. Polym. Sci., Vol. 54, 1994, p. 1593.
关4兴 Billingham, N. C, In: Oxidation Inhibition in Organic Materials, J. Pospsil and P. P. Klemchuk, Eds., CRC Press, Boca Raton, FL, 1990, p. 249.
关5兴 Bell, B., Beyer, D. D., Maecker, N. L., Papenfus, R. P., and Priddy, D. B., J. Appl. Polym. Sci., Vol. 54, 1994, p. 1605.
关6兴 Moisan, J. Y., in: J. Comyn, Editor. “Effects of Oxygen Permeation and Stabilizer Migration on Polymer Degradation,” Polymer Permeability, Elsevier, London, 1985, p. 119.
关7兴 Scoponi, M., Cimmino, S., and Kaci, M., “Photo-stabilization mechanism under natural weathering and accelerated photo-oxidative conditions of LDPE films for agricultural applications,” Polymer, Vol. 41, No. 22, 2000, pp. 7969–7980.
关8兴 ASTM Standard D 6878-03, “Standard Specification for Thermoplastic Polyolefin Based Sheet Roofing,” Annual Book of ASTM Standards, ASTM International, West Conshohocken, PA. 关9兴 Carlson, J., Delgado, A. H., Rosenow, E., Barndhardt, K. C., and Paroli, R. P., “Thermoplastic
Polyolefin 共Flexible Polyolefin兲 Roofing Membranes—A Report on 5 years of Monitored Exposure in North America,” International Conference on Building Envelopes Systems and Technology
ICBEST’07, 28–30 March 2007, Bath, UK.
关10兴 Carlson, J., Delgado, A. H., Rosenow, E., Barnhardt, K. C., and Paroli, R. M., “Performance Evaluation of Unexposed and Field-Exposed Thermoplastic Polyolefin TPO Roof Membranes,”
Proceedings of the RCI International Convention “Seeking Adventure……. Advancing Knowledge”
Phoenix, AZ, 23 March 2006, pp. 1–18.
关11兴 Delgado, A. H., Mukhopadhyaya, P., Normandin, N., and Paroli, R. M., “Characteristics of Mem-branes and Insulations Used for Low-Slope Roofs,” Roofing: Staying on Top of Technology and
Change 共11 cities across Canada兲, 1 September 2005, pp. 1–15.
关12兴 Cash, C. G., Bailey, D. M., Davies, A. G., Delgado, A. H., Niles, D. L., and Paroli, R. M., “Predictive Service Life Tests for Roofing Membranes,” 10DBMC International Conference on
Durability of Building Materials and Components, Lyon, France, 17 April 2005, pp. 1–6.
关13兴 Whelan, B., Graveline, S., Delgado, A. H., Liu, K. K. Y., and Paroli, R., “Field Investigation and Laboratory Testing of Exposed Poly共Vinyl Chloride兲 Roof Systems,” CIB World Building Congress,
“Building for the Future,”Toronto, Canada, 1–7 May 2004.
关14兴 Ramachandran, V. S., Paroli, R. M., Beaudoin, J. J., and Delgado, A. H., Handbook of Thermal
Analysis of Construction Materials, Norwich, New York, Noyes Publications, William Andrew
Publishing, 2002, p. 680.
关15兴 Delgado, A. H. and Paroli, R. M., “Applications of Dynamic Mechanical Analysis in the Building Envelope,” Symposium on Materials Characterization by Dynamic and Modulated Thermal
Ana-lytical Techniques, Toronto, Ontario, 25 May 2000, p. 1.
Spectros-copy in the Analysis of Construction Materials,” 26th Annual Conference of the Federation of
Analytical Chemistry and Spectroscopy Societies (FACSS) and the 45th International Conference on
Analytical Sciences and Spectroscopy (ICASS), Vancouver, B.C., 24 October 1999, pp. 286–287.
关17兴 Delgado, A. H. and Paroli, R. M., “Investigation of Seams in Thermoplastic Polyolefins 共TPO兲 Roofing Membranes by Fourier Transform Infrared Spectroscopy,” 26th Annual Conference of the
Federation of Analytical Chemistry and Spectroscopy Societies (FACSS) and the 45th International
Conference on Analytical Sciences and Spectroscopy (ICASS), Vancouver, B.C., 24 October 1999,
pp. 136–137.
关18兴 Paroli, R. M. and Delgado, A. H., “Evaluating the Performance of Polymeric Roofing Materials with Thermal Analysis,” Rubber World, Vol. 214, No. 4, 1996, pp. 27–32.
关19兴 Simmons, T. R., Liu, K. K. Y., Paroli, R. M., Delgado, A. H., Irwin, J. D., and Runyan, D., “Effects of Welding Parameters on Seam Strength of Thermoplastic Polyolefin 共TPO兲 Roofing Membranes,”
North American Conference on Roofing Technology, Toronto, Ontario, 16 September 1999, pp.
56–65.
关20兴 Paroli, R. M., Rossiter, W. J., Flueler, P., and Delgado, A. H., “Using Thermoanalytical Techniques to Characterize Roof Membrane Materials,” 4th International Symposium on Roofing Technology, Gaithersburg, MD, 17 September 1997, pp. 58–65.
关21兴 Paroli, R. M. and Delgado, A. H., “Analysis of Asphalt-Based Roof Systems Using Thermal Analy-sis,” Preprints of papers presented at the 211th ACS National Meeting, New Orleans, LA, 24 March 1996, pp. 38–42.
关22兴 Paroli, R. M., Dutt, O., Delgado, A. H., and Stenman, H. K., “Ranking PVC Roofing Membranes Using Thermal Analysis,”J. Mater. Civ. Eng., Vol. 5, No. 1, 1993, pp. 83–95.
关23兴 Paroli, R. M., Dutt, O., Delgado, A. H., and Mech, M. N., “Characterization of Ethylene-Propylene Diene Monomer 共EPDM兲 Roofing Membranes Using Thermogravimetry and Dynamic Mechanical Analysis,”Thermochim. Acta, Vol. 182, 1991, pp. 303–317.
关24兴 ASTM Standard D 5026-01, “Test Method for Measuring the Dynamic Mechanical Properties of Plastics in Tension,” Annual Book of ASTM Standards, ASTM International, West Conshohocken, PA.
关25兴 ASTM Standard D 6382-99, “Standard Practice for Dynamic Mechanical Analysis and Thermo-gravimetry of Roofing and Waterproofing Membrane Material,” Annual Book of ASTM Standards, ASTM International, West Conshohocken, PA.
关26兴 Bandrup, J. and Immergut, E. H., Polymer Handbook, Wiley, New York, 1989. 关27兴 Boyanova, M. and Fakirov, S., Polymer, Vol. 45, No. 7, 2004, pp. 2093–2098.
关28兴 Paroli, R. M. and Pen, J., “Measuring the Glass Transition Temperature of EPDM Roofing Mate-rials: Comparison of DMA, TMA and DSC Techniques,” Assignment of the Glass Transition, ASTM
STP 1249, R. J. Seyler Ed., ASTM International, West Conshohocken, PA, 1994, pp. 269–276.
关29兴 “Thermal Analysis Testing of Roofing Membranes Materials,” Final Report of the Thermal Analysis Task Group RILEM 120-MRS/CIB W.83 Joint Committee on Membranes Roofing Systems, 1995. 关30兴 Ashton, H. C., Chen, T., and Lynch, Th. J., The International Conference on Polyolefins, Society of
Plastics Engineers, Houston, TX, 24–26 February 2003, pp. 395–406.
关31兴 Stegge, J. M. and Urban, M. W., “Stratification Processes in Thermoplastic Olefins Monitored by Step-Scan Photoacoustic FTIR spectroscopy,” Polymer, Vol. 42, 2001, pp. 5479–5484.
关32兴 Hong, S.-G. and Liao, C.-M., “The surface oxidation of a thermoplastic olefin elastomer under ozone exposure: ATR analysis,” Polym. Degrad. Stab., Vol. 49, 1995, pp. 437–447.