Publisher’s version / Version de l'éditeur:
Vous avez des questions? Nous pouvons vous aider. Pour communiquer directement avec un auteur, consultez la Questions? Contact the NRC Publications Archive team at
[email protected]. If you wish to email the authors directly, please see the first page of the publication for their contact information.
https://publications-cnrc.canada.ca/fra/droits
L’accès à ce site Web et l’utilisation de son contenu sont assujettis aux conditions présentées dans le site LISEZ CES CONDITIONS ATTENTIVEMENT AVANT D’UTILISER CE SITE WEB.
Student Report (National Research Council of Canada. Institute for Ocean Technology); no. SR-2008-03, 2008
READ THESE TERMS AND CONDITIONS CAREFULLY BEFORE USING THIS WEBSITE.
https://nrc-publications.canada.ca/eng/copyright
NRC Publications Archive Record / Notice des Archives des publications du CNRC :
https://nrc-publications.canada.ca/eng/view/object/?id=8646ddd8-36cf-4bea-a672-75abad6896a3 https://publications-cnrc.canada.ca/fra/voir/objet/?id=8646ddd8-36cf-4bea-a672-75abad6896a3
NRC Publications Archive
Archives des publications du CNRC
For the publisher’s version, please access the DOI link below./ Pour consulter la version de l’éditeur, utilisez le lien DOI ci-dessous.
https://doi.org/10.4224/8895510
Access and use of this website and the material on it are subject to the Terms and Conditions set forth at
Data monitoring client for data acquistion servers
Squibb, C.
National Research Council Canada Institute for Ocean Technology Conseil national de recherches Canada Institut des technologies oc ´eaniques
Student Report
SR-2008-03
Data Monitoring Client for Data Acquistion Servers
C. Squibb
April 2008
DOCUMENTATION PAGE
REPORT NUMBER SR-2008-03
NRC REPORT NUMBER DATE April 2008 REPORT SECURITY CLASSIFICATION
Unclassified
DISTRIBUTION Unlimited TITLE
DATA MONITORING CLIENT FOR DATA ACQUISITION SERVERS
AUTHOR(S) Chris Squibb
CORPORATE AUTHOR(S)/PERFORMING AGENCY(S) IOT/NRC
PUBLICATION N/A
SPONSORING AGENCY(S) N/A
IOT PROJECT NUMBER NRC FILE NUMBER KEY WORDS
Sweet, GDAP, data acquisition, GEDAP, metering, statistics
PAGES 42 FIGS. 19 TABLES SUMMARY
During this past work term, most of my time was spent developing Digital Meter. Digital Meter is a Graphical User Interface (GUI) based application, which primarily allows users to monitor Data Acquisition Server (DAS) channel values. In a general sense, channels are usually data producing sensors such as pitch encoders, load cells, temperature and light sensors, etc. Digital Meter provides the user with an abundance of tools and features to aid in channel monitoring, ultimately allowing projects that make use of DAS technology to be run more effectively.
ADDRESS National Research Council Institute for Ocean Technology Arctic Avenue, P. O. Box 12093 St. John's, NL A1B 3T5
1
Summary
During this past work term, most of my time was spent developing Digital Meter. Digital Meter is a Graphical User Interface (GUI) based application which primarily allows users to monitor Data Acquisition Server (DAS) chan-nel values. In a general sense, chanchan-nels are usually data producing sensors such as pitch encoders, load cells, temperature and light sensors, etc. Digi-tal Meter provides the user with an abundance of tools and features to aid in channel monitoring, ultimately allowing projects that make use of DAS technology to be run more effectively.
The following report has been broken up into two distinct sections, one to act as a user’s guide and another as a brief design document.
The user’s guide walks through most of the prominent features within Digital Meter, explaining how to use them as well as expected results along the way. Diagrams and Digital Meter screen captures have been provided where applicable to provide feedback to the reader ensuring them that Digital Meter is being used properly. Notes have been appended to the relevant sections in an attempt to reason any behaviour that may seem a little strange or unexpected. It is recommended that anyone required to use Digital Meter read the user’s guide section of this report.
The design documentation provides a brief overview of the primary classes within Digital Meter, as well as their interactions. This section of the report details specific software design principles and as such, carries an applicable scope of content. It is intended that this section of the report not be read by end users, rather, it is to be used by future developers of Digital Meter as an introduction to how Digital Meter operates.
Contents
1 Summary i
2 Introduction 5
2.1 Overview of Digital Meter . . . 5
3 User Guide 7 3.1 Start-up Screen Overview . . . 7
3.2 DAS Connections . . . 8
3.2.1 Connecting to a DAS . . . 8
3.2.2 Adding/Removing DAS channels . . . 10
3.2.3 Disconnecting from a DAS . . . 10
3.2.4 Displayed Units . . . 10
3.3 Pages . . . 11
3.3.1 Creating New Pages . . . 11
3.3.2 Page Properties . . . 11
3.3.3 Drag-and-drop Support . . . 13
3.3.4 Column Meanings . . . 13
3.3.5 Column Sorting . . . 15
3.3.6 Other Page Customizations . . . 15
3.4 Status Indicators . . . 16
3.4.1 Alarms . . . 16
3.4.2 Alarm Properties . . . 17
3.4.3 Clock Sync Error . . . 18
3.4.5 Indicator Properties . . . 19
3.4.6 Indicator Precedence . . . 20
3.5 Virtual Channels . . . 20
3.5.1 Creating New Virtual Channels . . . 20
3.5.2 Modifying Virtual Channels . . . 21
3.5.3 Virtual Channel Behaviour w.r.t Offline Channels . . . 23
3.6 Configurations . . . 24
4 Design Methodologies 25 4.1 Introduction . . . 25
4.2 Primary Classes Overview . . . 25
4.3 Algorithms . . . 26
4.3.1 Application Start-up . . . 26
4.3.2 Connecting to a DAS . . . 27
4.3.3 GUI Updating . . . 28
4.3.4 Indicators . . . 28
4.4 Shortcomings and Wish-list Changes . . . 29
4.4.1 Saving and Loading . . . 29
4.4.2 Saving of Page Locations . . . 29
5 Conclusions 31
6 Recommendations 32
Bibliography 33
B UML: Primary Classes 35
List of Figures
1 Digital Meter start-up screen . . . 7
2 Creating a new connection. . . 9
3 A list of channels discovered from a DAS. . . 9
4 The Page Properties dialog . . . 12
5 The page-based font selection dialog. . . 16
6 Digital Meter monitoring a DAS with triggered alarms(red) and stale channels(blue). . . 17
7 Virtual channel creation/modification dialog. . . 22
8 Primary class UML diagram, with function parameter and return types removed. . . 36
9 Slide 1 of 11 . . . 37 10 Slide 2 of 11 . . . 38 11 Slide 3 of 11 . . . 38 12 Slide 4 of 11 . . . 39 13 Slide 5 of 11 . . . 39 14 Slide 6 of 11 . . . 40 15 Slide 7 of 11 . . . 40 16 Slide 8 of 11 . . . 41 17 Slide 9 of 11 . . . 41 18 Slide 10 of 11 . . . 42 19 Slide 11 of 11 . . . 42
2
Introduction
2.1
Overview of Digital Meter
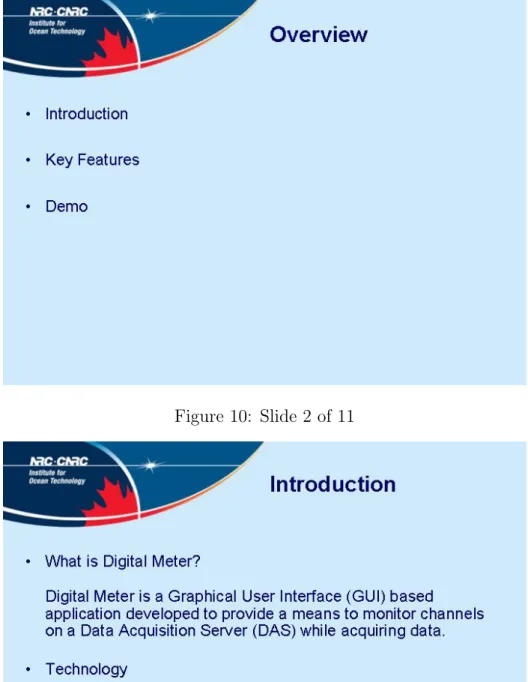
Digital Meter is a Graphical User Interface (GUI) based application devel-oped to monitor channel values on one or more Data Acquisition Servers (DASs). Built from the ground-up as a multi-page application, Digital Me-ter provides the end user with many abilities and configuration options aiding in channel monitoring. While being feature-rich, Digital Meter maintained the ability to be used quickly and easily. Of the features found in Digital Meter, some of the more prominent include:
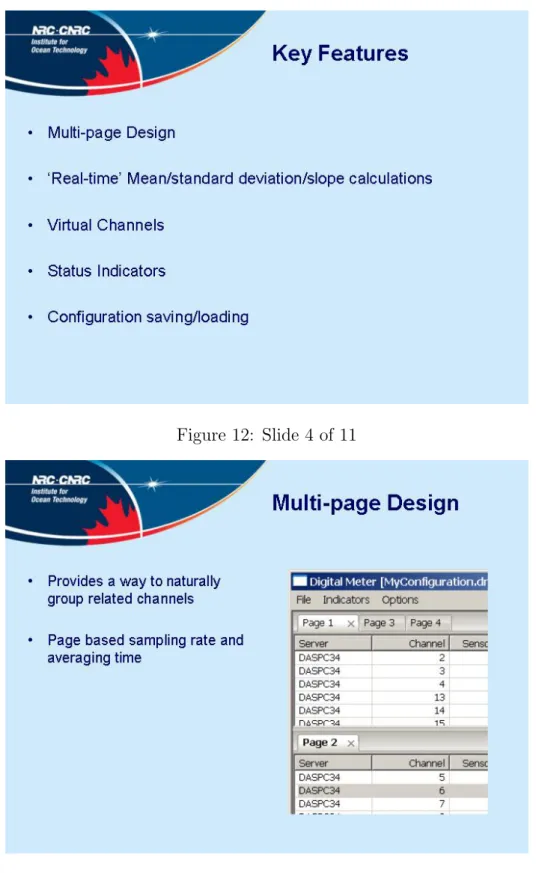
• Multi-page support, with the capability to select data sampling rate and averaging time on a page-by-page basis.
• Ability to display a channel’s mean, min, max, standard deviation, and slope in ’real-time’ once the specified averaging time has elapsed. • Virtual channels can be created as a mathematical combination of one
or more channels that are currently being monitored. These channels can be either from a DAS, or another virtual channel.
• Configuration saving/opening. Once a configuration has been designed (page layout, sampling rate, averaging time, font styles and colours, etc.) it can be saved for later usage, or to share amongst colleagues. • Indicators for clock sync errors between the DASs and Digital Meter,
user specified channel alarms, and channel staleness alert the end user of possible problems while monitoring.
Once installed1, Digital Meter can be opened by double-clicking on its icon, assuming you have the required libraries installed. Digital Meter was developed using the Python scripting language and depends on the following libraries:
• Python {public}
Python is a very powerful object oriented programming language that can be used for a wide variety of applications, such as Web Devel-opment, Database Access, Desktop GUI Applications, and Scientific Computing.
• NumPy {public}
Since Python is an interpreted language, mathematical calculations on large sets of data run a measurable amount slower than they would in a compiled language such as C++. NumPy addresses this problem by providing fast access multi-dimensional arrays packaged with functions and operators that can be performed on these arrays. Thus any algo-rithm that can be expressed primarily as operations on arrays will run almost as fast as the equivalent compiled code [1]. Digital Meter makes use of NumPy in order to calculate such things as the mean, standard deviation, and slope values for each channel.
• wxPython {public}
wxPython is an extension module for Python which allows program-mers to create a robust and highly functional GUI. It is essentially a wrapper of the popular wxWidgets cross platform GUI library, which is implemented in C++and provides access to all of the common window
components.
• SWEET Framework {NRC internal} From the SWEET Wiki[2]:
Sweet (SoftWare Environment for Experimental Technolo-gies) is an environment used to manage the information tech-nology needs of scientific and engineering research organiza-tions. It was developed as a collaboration between the Insti-tute for Information Technology (IIT) and the InstiInsti-tute for Ocean Technology (IOT) of the National Research Council of Canada. It is currently being adapted for use within the Institute for Aerospace Research.
3
User Guide
The following section is intended as a usage guide to the end users of Digital Meter. Explaining everything from the most basic use cases to the more advanced usage of virtual channels. It is recommended that anyone required to use (or interested in using) Digital Meter read the relevant sections of this guide.
3.1
Start-up Screen Overview
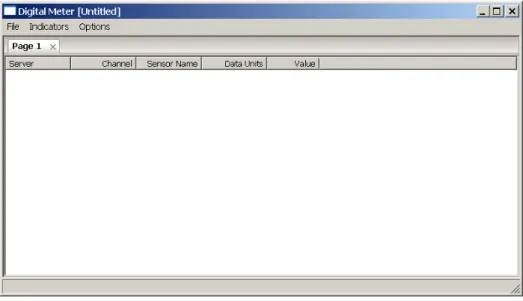
Upon launching Digital Meter you will be presented with a generic applica-tion window as shown in Figure 1. This window contains three main compo-nents; the main menu, the status bar, and the work area.
Figure 1: Digital Meter start-up screen
The main menu provides the user with options to manage their config-urations, enable/disable status indicators and to set properties on them, as well as provide the ability to change global options of Digital Meter such as the time between screen updates.
The status bar is used as a means to quickly display the clock error between the client (computer running Digital Meter) and each server (DAS) that is currently being monitored. Ideally this would be as close to 0 as possible, though this is not always the case. If you are constantly seeing clock
errors in excess of 75 ms in either signed direction it is suggested to make sure that the Network Time Protocol (NPT)[3] software is running correctly on your computer, as well as the computer hosting the DAS software.
The work area is where channel monitoring occurs. Within the work area there can be multiple pages, with different channels on each page. Also accessible from this work area is the context menu. To invoke the context menu, right-click anywhere within a page. The page that is used to invoke the context menu will be the page that receives all events which propagate from actions the user performs from within the context menu. The context menu provides access to most of the functionality available within Digital Meter, with the primary exception of Status Indicators, see Section 3.4. Throughout the rest of this document whenever a reference is made to the context menu, it is referring to this menu unless otherwise specified.
3.2
DAS Connections
3.2.1 Connecting to a DAS
In order to monitor channels from a DAS a connection must first be estab-lished. This process begins by selecting the New Server entry in the context menu. Once clicked, a dialog box will be displayed, prompting you to enter the address of the DAS you wish to connect to, as shown in Figure 2. This address is typically in one of two formats:
1. Local Network Name - If the DAS exists within the same local network as the client computer and the network name of the DAS is known (eg. DASPC35) then it can be entered into the address field.
2. IP Address - If the IP address (in the form of ###.###.###.###) of the DAS is known then it can be entered into the address field. Once the address is supplied, click on the Ok button to attempt to es-tablish a connection to the DAS. If the connection cannot be eses-tablished, a dialog box will be displayed warning you of the connection issues. Attempts to connect will continue until the Cancel button is clicked. If the connection can not be established, ensure that the address specified is correct and that the DAS software is running on the address specified.
Figure 2: Creating a new connection.
If a connection is successfully established with the DAS then a new dialog is displayed, which lists all the channels that were discovered on the DAS, as shown in Figure 3. From this dialog you must select which channels you wish to monitor, by checking the associated check box next to each entry. If you wish to monitor all of the listed channels, you can use the Check All button to select all of the entries. It is important to note that the selections made at this stage are not final, and any of the channels can be imported into (or removed from) Digital Meter very easily at a later time. It is however, required that you select at least one channel to monitor, as a DAS with no channels currently being monitored is considered invalid and the connection to the DAS will be automatically terminated. Once you have selected the desired channels, click Ok to append the selected channels to the page which was used to invoke the connection.
3.2.2 Adding/Removing DAS channels
As previously mentioned, during the process of connecting to a DAS you must select some channels on that DAS to monitor. If you wish to change which channels from a particular DAS are currently displayed on the page, invoke the context menu and choose the menu item corresponding to the DAS server name (near the bottom of the menu). Clicking on a DAS server name in the context menu presents you with the same list dialog presented during the connection process. From this list, check/uncheck the boxes as required and click Ok when finished. This will add/remove the appropriate channels to/from the page.
3.2.3 Disconnecting from a DAS
Disconnections are handled in a somewhat automatic way, in that there is no actual disconnect option. Instead, to disconnect a DAS you remove all channels (from all pages) for that DAS, following the same procedure as discussed in Section 3.2.2.
3.2.4 Displayed Units
The units of each channel being monitored on a particular page can be one of:
• Raw
• Uncalibrated • Calibrated2
To switch between these displayed units, invoke the context menu and at the top you will find a menu entry corresponding to each unit type. Selecting the desired unit type will issue a command to change the displayed units of all channels on the selected page. While different pages can have different display units, all of the channels on a single page are required to have the same.
2To see the correct calibrated units, you must have previously metered or acquired
data from the channel using GDAC, to cause calibration information to be uploaded to the DAS.
3.3
Pages
Digital Meter is a multi-page application. In essence, this provides the user with the capability to monitor the same channel in a different fashion on each page, such as average each channel over a different averaging time. It also provides a means for the end user to separate groups of channels in a logical fashion.
3.3.1 Creating New Pages
To create a new page simply invoke the context menu and select the New Page option. This will create a new page in the work area, using a default name of Page #, where # is based on the number of previously created pages. This default page name can be changed from within the Page Properties dialog, as discussed in Section 3.3.2.
3.3.2 Page Properties
To access the page properties, invoke the context menu and select Page Prop-erties. This will present a standard styled properties dialog, as shown in Figure 4. There are two tabs available within the page properties dialog:
• General - This is the main tab in which you can perform a variety of page configuration options. The page name can be changed by entering in a value in the Page Name field. The sampling rate and averaging time for the selected page can also be set.
– Sampling Rate - This option controls how fast Digital Meter will acquire data from the DAS with respect to the selected page. In the case of a multi-paged configuration, the actual rate of which new data is retrieved from the DAS is determined by the page with the highest sampling rate, however, pages with a lower sampling rate will behave as if the sampling rate is as set.
– Averaging Time - This is the time (measured in seconds) that the selected page will consider when determining such things as the mean, slope, min, max, and standard deviation of a channel. The next section of the page properties dialog provides a quick status overview of each DAS that owns one or more channels on the selected
page. Providing such information as clock sync error and the actual obtained sampling rate allows the user to ensure that things are work-ing correctly. Finally, the last section provides a way to change the significant digits to be displayed when viewing the page in each of raw, uncalibrated, and calibrated units. These values can also be changed through the context menu.
• Columns - This tab allows you to change which columns are to be dis-played and hidden on the selected page. Columns with their associated check box checked are considered to be displayed. For an explanation of each of the columns please refer to Section 3.3.4
Figure 4: The Page Properties dialog
Once changes have been made to the page properties, the Ok button must be clicked in order for them to take effect. Note, setting these op-tions (specifically the sampling rate and averaging time) should not be done without caution. If you are monitoring many channels from multiple servers
within a multi-page environment and set these options too high, then system performance can be adversely affected.
3.3.3 Drag-and-drop Support
Drag-and-drop a is feature inherent within most applications, usually pro-viding the ability for the end user to move or copy data from one item to another. In terms of Digital Meter, drag-and-drop allows you to change the ordering of channels within a page, as well as change the location of pages themselves.
To perform drag-and-drop on pages, click the page tab (where the page name is displayed) and move the mouse to the location that you wish to drop the page. Valid page locations will be identified by a semi-transparent blue rectangle as you move the mouse around the screen. Once the blue rectangle appears in the desired area, let go of the mouse to set the pages new location. There are essentially three combinations of drag-and-drop possible in re-gards to channel re-ordering:
1. Move within a page 2. Move between pages 3. Copy between pages
To perform either of these drag-and-drop options you select3 the desired channels. Once the desired channels have been selected, click on any se-lected channel and drag (while holding the mouse button down) the group of channels to the desired drop location. Once at the drop location, release the mouse button and the channels will be moved. To copy channels from one page to another, repeat the above steps, except hold down the Ctrl key4
before dropping the channels.
3.3.4 Column Meanings
As previously mentioned, on each page within the Digital Meter there are a number of possible columns that can be displayed. By default, the first page
3A channel is identifiable as selected when it turns navy blue in colour.
4The mouse pointer should change to indicate that the Ctrl key was pressed, usually
that is created when Digital Meter is launched contains five columns:
• Server - Address specified to make the connection to the DAS. • Channel -Channel number of the associated channel from the DAS. • Sensor Name - Sensor name of the associated channel, which will be
blank if calibration information has not been uploaded to the DAS. • Units - Units that the channel is currently being viewed in. If this is
not specified then the assumption is that the units are raw counts. • Value - Most recent value obtained from the DAS for the specific
chan-nel.
Digital Meter can be configured (on a page-by-page basis) to include the following optional columns:
• Mean - Displays the calculated mean value of the data collected from the channel over the specified averaging period.
• Min - Displays the minimum value of the data collected from the chan-nel over the specified averaging period.
• Max - Displays the maximum value of the data collected from the channel over the specified averaging period.
• Standard Deviation - Displays the standard deviation of the data col-lected from the channel over the specified averaging period.
• Slope - Displays the calculated slope value of the data collected from the channel over the specified averaging period. The slope is calculated using a line of best fit through all data points in the data set.
• Alarm Name - Displays the optional alarm name associated with the channel. For more information regarding alarms please refer to Section 3.4.1
As one would expect, some of these columns have no meaning unless an averaging time has been specified. If this is the case, a −− value will be displayed in the appropriate cell. This value will also be displayed if there has not been enough data collected to satisfy the averaging time requested.
3.3.5 Column Sorting
Column sorting is available in ascending and descending order for the follow-ing columns:
• Server • Channel • Sensor Name • Units
Column sorting is smart. If sorting by a particular column makes no difference to the order then a secondary5 column would be chosen on which
to sort. For example, if there is only one DAS connection, then sorting by Server would yield no change. In this case the Channel column would be chosen as the secondary sort column.
3.3.6 Other Page Customizations
Along with the general page properties discussed in Section 3.3.2 there are a number of other customizations that can be made to a page:
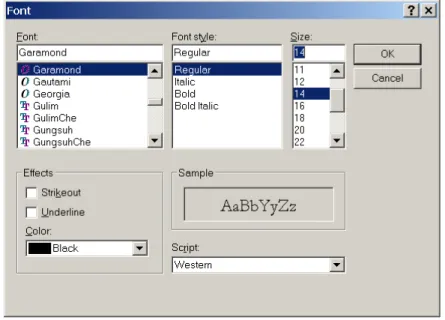
• Fonts - The font style and colour of the entire page can be changed (eg. Font size can be greatly increased so that Digital Meter can be read from a distance.). To change the font of a page invoke the context menu and select Font. This will present you the standard Windows font selection dialog as shown in Figure 5. From it you can change things such as the font face, style, colour, size, etc.
• Channel Background Color - To aid in channel monitoring the abil-ity to highlight channels, by changing their background colour, has been designed into Digital Meter. To change the background colour of a channel right-click on the desired channel(s) and select Change Background Colour. This will present you with a colour chooser dialog box, from which you select the colour you want to associate with that channel. This change applies only to the current page. If a modified
channel exists on another page, it will not be affected. Note also that background colour is preserved through the drag-and-drop operations described in Section 3.3.3.
Figure 5: The page-based font selection dialog.
3.4
Status Indicators
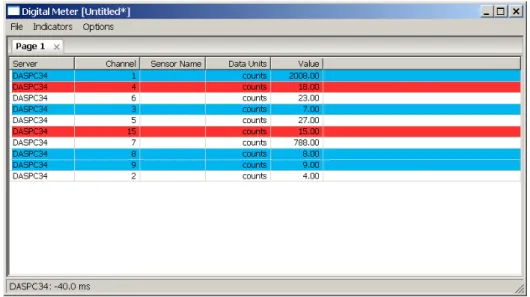
Status indicators are a way of providing the user with some feedback on the status of specific channels of a DAS, or the DAS as a whole. For most of these indicators, what is considered safe and unsafe is determined by input from the user. The user also has the option to disable and enable each of the indicators globally, or based on a specific DAS channel in some cases. The following three sections outline the details surrounding each of the three major indicators, Alarms, Clock Sync Error, and Channel Staleness. Refer to Figure 6 to see a sample configuration of Digital Meter in which multiple indicators have been triggered.
3.4.1 Alarms
Alarms are used to indicate when the value of a channel falls outside of a user specified range. When this happens the alarm is triggered and all instances of the channel will show up with a red background (by default).
Figure 6: Digital Meter monitoring a DAS with triggered alarms(red) and stale channels(blue).
A list of alarms and their properties can be viewed by one of two methods: 1. Page-by-page - If you wish to view only those alarms for channels on
the selected page, invoke the context menu and select Edit Alarms. 2. All alarms - If you wish to view a list of all alarms, from the main menu
click Indicators → Edit Alarms.
3.4.2 Alarm Properties
The Alarm Properties dialog is accessible two ways. The easiest way to access the Alarm Properties dialog is to right-click on a single channel on any page, and from the context menu select Alarm Properties. Another way is to bring up a list of alarms as discussed in Section 3.4.1 and double-click on the desired alarm.
Alarms have three properties that are associated uniquely to each channel, independent of page. All of which are modified through the Alarm Properties dialog. These properties are:
• Alarm Name - Alarms can be given a, which will be displayed in the Alarm Name column on any page that contains the channel (assuming
the column is enabled). Alarm Names are intended to allow the user en-hance the existing channel description information to make identifying the channel easier. They are especially useful when multiple channels are similar (such as core body temperature of group of people, where the alarm name could be the persons name).
• Alarm Limits - As previously mentioned, alarms must have their limits defined by the user. Limits can be defined in a multiple ways. It is possible to change the limits on a single channel, as well as batch modification of multiple channels.
– Single channel - From the Alarm Properties dialog, enter the min and max values to define the limits. These values can be either entered manually, or by use of the % of Range feature to set the min and max values based on a percentatage of the measurement range.
– Multiple channels - From the list of alarms, select the channels you wish to modify and then right-click on any of the selected channels. From the displayed menu, choose, Set Limits, or Set Limits as % of Range. Fill in the information in the presented dialog box and click Ok.
• Alarm Status - Alarms can be disabled and enabled on an individual basis. As expected, when an alarm is disabled, it will not be triggered when the value of the associated channel falls outside the limits. Note that, if alarms are disabled globally (via the Indicators main menu item) then the individual alarm enabled/disabled status will have no effect until alarms are globally enabled again.
3.4.3 Clock Sync Error
Clock Sync indicators are used to indicate when the absolute value6 of clock
difference between a server (DAS) and the client (Digital Meter) is greater than 75ms. This value is not configurable by the user. When a clock sync error indicator is triggered the background colour of all channels, on all pages, belonging to that DAS will turn yellow (by default)7.
6While absolute value is taken when considering the status indicator, signed results are
available in the status bar and within the Page Properties dialog.
7Unless an alarm is already triggered, as they have a higher precedence. See Section
Unlike alarms, clock sync errors can not be disabled/enabled on a DAS-by-DAS basis, they can only be enabled/disabled globally from the Indicators main menu item. Clock sync errors for all DASs currently being monitored are always displayed in the status bar. A positive clock sync error represents that client time is ahead of server time, negative indicates the opposite.
3.4.4 Channel Staleness
Channel Staleness is defined as the absence of value change. If a channel is stale for more than 30 seconds then the associated indicator will be trig-gered, setting the background color of the channel to blue (by default)8. The aforementioned 30 seconds can be modified through the indicator properties, discussed in Section 3.4.5.
Channel staleness indicators can not be enabled/disabled on a channel-by-channel basis. They can only be enabled/disabled globally, via the Indicators main menu item.
3.4.5 Indicator Properties
Indicator properties control global options related to all of the indicators discussed above. To bring up the Indicator Properties dialog click Indicators → Properties from the main menu9. This will present a standard styled
properties dialog to you, containing three tabs:
• Alarms - The Alarms tab allows you to enable/disable the global status of alarms, as well as change the colours used to indicate that an alarm is triggered. To change either of these colours simply click the Change Background or Change Foreground10 button as appropriate. This will present a color chooser dialog from which you can select the desired colour. To restore the colours back to their original schema click the Restore Defaults button.
• Clock Sync - The Clock sync tab is similar to the Alarms tab and should be used as such.
8Unless an alarm or Clock Sync Indicator is already triggered, as they have a higher
precedence. See Section 3.4.6.
9Only available if one or more DASs have been connected 10Foreground colour represents the text color.
• Staleness - The Staleness tab is similar to the Alarms tab, with an extra field. The Elapsed Time field is used to determine how long a channel must remain at the same value before it is considered stale.
3.4.6 Indicator Precedence
In the event of multiple indicators being triggered for a specific channel the indicator precedence is as follows:
Alarms → Clock sync error → Channel staleness
Meaning that if an alarm is triggered for a channel, it will be displayed no matter what other indicators are also triggered.
3.5
Virtual Channels
Virtual channels are channels that are not associated with a DAS, but are defined and created by the end user. These channels are typically mathe-matical combinations of one or more channels11. Uses of virtual channels can range from unit conversions (eg. Celsius to Fahrenheit) to resolution of forces and moments. Virtual channels can also be a constant used in other virtual channels.
3.5.1 Creating New Virtual Channels
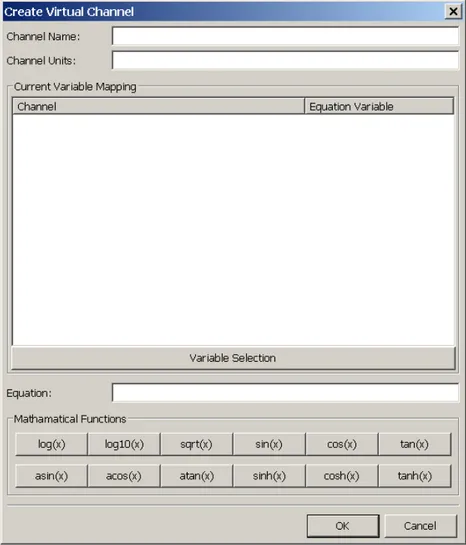
To create a new virtual channel, right-click on a page and choose Create a Virtual Channel. This will display the main virtual channel dialog box from which you can create the virtual channel, shown in Figure 7. Detailed steps of the creation process are as follows:
• Step 1 - Enter appropriate values into the Channel Name and Channel Units fields. While only the channel name is required, it is highly recommended to fill in the units as well, if applicable.
• Step 2 - If the virtual channel requires other DAS or virtual channels as variables, click the Variable Selection button. This will display a new dialog which lists all of the channels currently available. These are categorized based on DAS. For each channel to be reference as a variable, check the associated box next to the channel. Once the desired channels have been selected, click Ok.
• Step 3 - Now that the desired channels have been selected, they must be assigned a variable name (eg. x, y, or something more meaningful). Upon closing the previous dialog, the Current Variable Mapping list is populated with the channels you had chosen. To assign a variable to each of these channels, double-click the associated cell in the Equation Variable column. This should present a yellow highlighted box in which you can type a variable name (no spaces or numbers allowed).
• Step 4 - Finally, the equation can be developed using the variables cre-ated above, constants, and any normal mathematical operation12. For
example, if you assigned a channel to be a variable x, then entering x+3 in the equation field will result in a virtual channel that is equivalent to the channel plus 3, while x ∗ ∗2 would be the channel to the power of two. If you wish to use the math functions provided then select the text you wish to become the operand of the function and then click the desired function button, eg. sin().
Note, the value of virtual channels, by nature, will be slightly delayed to that of real channels. Whether or not this is noticeable depends on a lot of variables, and it usually not noticeable. The reason behind this phenomena is based on the fact that virtual channels depend on the value of real channels. This dependency means that in order for virtual channels to update, the real channels must first be updated, else the virtual channel will get the old value.
3.5.2 Modifying Virtual Channels
Modification of a virtual channel is very similar to the creation of one, except that during the modification process all previous values that were entered in to the applicable fields will be populated with the virtual channels informa-tion. To select new variables for the virtual channel you follow the same process as described above in Step 2, except that the dialog which opens
12Currently supported operations are: Addition (+), Subtraction (-), Multiplication (*),
Figure 7: Virtual channel creation/modification dialog.
up after clicking the Variable Selection button will already have check boxes next to the channels currently contained within the virtual channel. If either of these boxes are unchecked then the associated channel is no longer consid-ered to be a variable of that virtual channel, implying that you will have to also change the virtual channel equation. Any new variables introduced at this time will have to be given new variable names, as done in the creation of the virtual channel.
3.5.3 Virtual Channel Behaviour w.r.t Offline Channels
Creating a dependency between virtual channels and DAS channels presents an issue that must be considered. What should happen to the virtual channel if one of its variables depends on a DAS channel that is no longer available (eg. the DAS has gone offline)? There are essentially three cases to consider, outlined below followed by the expected behaviour.
• Case 1: Virtual channel depends on one DAS, and the DAS goes offline – The virtual channel will not be removed from Digital Meter. – The virtual channel will remain stale at the last value that it
calculated, using the last value from the DAS channel.
– If the DAS comes back online, then the virtual channel will auto-matically pick up on the new values coming in from the DAS. • Case 2: Virtual channel depends on more than one DAS, and not all
of them go offline
– The virtual channel will not be removed from Digital Meter. – The virtual channel will use the new values from all available DASs
and use the stale values for DASs that have gone offline.
– If the DAS comes back online, then the virtual channel will auto-matically pick up on the new values coming in from the DAS. • Case 3: Loading a configuration that has a virtual channel that depends
on at least one DAS, which is offline at the time of loading – The virtual channel will still be added to Digital Meter.
– A value of −− will be displayed, since there is no old stale value available from the offline DAS(s).
– If the DAS(s) come back online, then the virtual channel will au-tomatically pick up on the new values coming in from the DAS(s).
In either case, trying to edit a virtual channel that contains a variable consisting of a channel from an offline DAS, then a dialog box is displayed indicating that variables associated with channels on the offline DAS(s) can not be loaded. Then the modification proceeds as in Section 3.5.2
3.6
Configurations
While much effort has been put into streamlining the GUI configuration of Digital Meter, some complex configurations may still take some time to create. Once these configurations have been created it would be useful to save them, either for personal use later, or to share with colleagues. Digital Meter provides this functionality through the common Load/Save options found in the File menu. The operating mechanics behind these mimic that of most GUI based applications, down to the keyboard short-cuts.
These save files are of the file type *.dmc, a home-grown file type which stands for Digital Meter Configuration. These files store all13 of the
infor-mation required for a user to load them later (in the same version of Digital Meter) and restore the GUI to the previous functional state, with all DASs and channels preserved, assuming that connections can be established.
4
Design Methodologies
4.1
Introduction
This section of the report will provide a brief overview of some of the major design elements behind Digital Meter, as well as an overview of the algorithms used. It will not go into great detail regarding the implementation of some of these algorithms as it is out of the intended scope of this document. The primary motivation behind this discussion is to aid future developers who may modify the Digital Meter code in any way, either to fix bugs or to add new features.
While Digital Meter consists of nearly 50 classes, only a relatively small subset of these are to be considered primary classes14. The others are usually dialogs, specific extensions of window components to fill these dialogs, or windows component data entry validation classes. To start things off, an introduction to each primary class is given, allowing me to assume the reader has knowledge of these classes when writing about their interactions later.
4.2
Primary Classes Overview
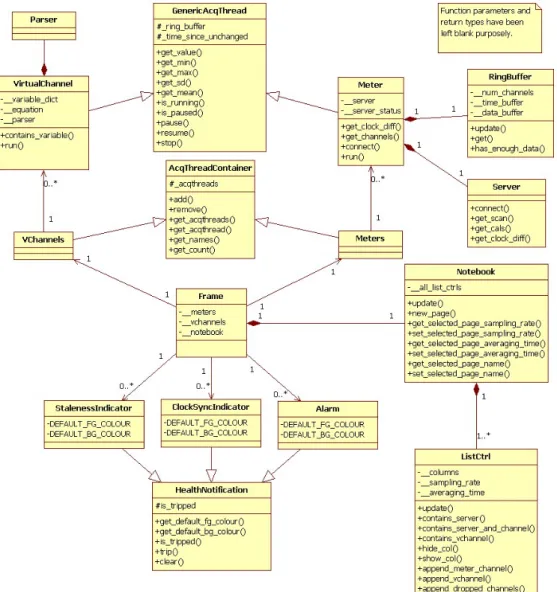
• Frame - Usually involved during any command that is invoked through the GUI from the user. In terms of the common Model/View/Controller[4] design pattern, the Frame would be considered the controller, in a weak sense as it is coupled slightly with the view, though most of the view operations have been delegated to other classes, specifically the Note-book.
• Notebook - This is the primary controller of the GUI. As the name would imply, it is the foundation behind the multi-page capability of Digital Meter. It is through this class that new pages are created, old ones destroyed, and their information updated.
• ListCtrl - The component which makes up a Notebook page. ListCtrl is where the actual channel listings are displayed. It implements (or delegates to other classes) all of the features related to how the channels are displayed. This includes such things as ordering, background colour, font styles, triggered indicators, etc.
• GenericAcqThread - A generic acquisition thread provides Digital Meter with data. There are two derived classes from this base class, Meter (for acquiring data from a DAS) and VirtualChannel (calculates its own data based on its associated equation as opposed to actually acquiring it, though it still provides a value for other classes to retrieve so bundling it under the GenericAcqThread base class makes sense as it requires the same interface).
• AcqThreadContainer - Acts as a container for GenericAcqThread objects, where each class derived from GenericAcqThread should have an associated container. Meter objects are contained within the Me-ters container, while VirtualChannel objects are contained within the VChannels container.
• Server - Contains and controls a DAS connection. A Server object should only exist within a Meter object, in a one-to-one relationship. • RingBuffer - A specialized implementation of the ring buffer data
structure. It is used to store data (as well as the time of retrieval) obtained by GenericAcqThread objects.
• HealthNotification - Provides indicators on channels and DASs, alert-ing the end user in a visual manner of possible problems. There are three derived classes, Alarm, ClockSyncIndicator, and StalenessIndi-cator which implement the behaviour as described in Sections 3.4.1, 3.4.3 and 3.4.4 respectively.
4.3
Algorithms
4.3.1 Application Start-up
When Digital Meter is launched you are presented with a standard windows styled application. Most of this, as would be expected by anyone familiar with GUI programming, is handled by the Frame class. Some of the main components that the Frame class is responsible for upon instantiation are:
• Creation of the Meters and VChannels container classes. • Creation of the Notebook class
Once the application has started, it idles until receiving a command from the user15.
4.3.2 Connecting to a DAS
Lets consider the most probable first command that Digital Meter will re-ceive, a requested DAS connection. After getting the required input from the user (DAS address) a new Meter object is created. During instantiation, a Server object is also created. The Meter object then invokes the connect() method of the Server object in an attempt to establish a connection with the DAS. Assuming the connection is successful, and the user selects one or more channels to monitor, then the Meter thread is told to start, by calling its run() method, which will continually loop until told to pause or stop. A stop would disconnect the DAS while a pause would simply stop it from acquiring data.
Each iteration through the main run() loop invokes the get_scan() method of the Server object, which returns a list of the latest data acquired from each channel on the DAS. These values are then stored in the Meter ’s RingBuffer object.
The size of the RingBuffer is determined by a multiplication of the max-imum averaging time (60 seconds), the maxmax-imum sampling rate (20Hz), and an overflow allowance of 25%, for a total size of 1500 acquisitions. The RingBuffer consists of two lists, one represents data values while the other represents the time of data acquisition. It is assumed that all channels ac-quire their data at the same time16, meaning that the data list will be longer than the time list by a factor of how many channels are located on the DAS. The Meter thread will continuously run until the Server object it is cou-pled with is disconnected. Rather than letting the thread run as fast as possible and hogging CPU time and other resources, it is slept during each iteration of its main loop within run(). The sleep time is determined by the page that has the fastest sampling rate17.
15In the case of loading a configuration the commands are automatically generated. 16While this is not actually true, it is close enough for our purposes.
4.3.3 GUI Updating
Within the main Frame object there is a timer, by default this timer is set to expire once a second, though this can be changed by the user within Digital Meter. When this timer executes it calls the Notebook ’s update() method, which in turn iterates through each page, calling each ListCtrl ’s update() method.
During a ListCtrl update, all items displayed within that ListCtrl are it-erated over, converting them from a text and/or integer entry into the object that it represents. Once this conversion occurs the ListCtrl will ask the asso-ciated Meter or VirtualChannel object for the required values, which include all or some of {Value, Mean, Standard Deviation, Slope, Min, Max} via the methods get_value(), get_mean(), get_sd(), get_slope(), get_min(), and get_max() respectively.
During development it was noticed that the application flickered, espe-cially when a large number of channels were within the ListCtrl. This was caused by trying to update a large number of cells at the same time. While no solution was found to totally eliminate18 the flicker, it was able to be al-leviated a fair amount by simply comparing the ’new’ values to the previous values contained within the cell, if they were the same then the cell would not be updated.
4.3.4 Indicators
All three indicators are checked during the aforementioned ListCtrl ’s update() method. As indicators are not specific to any single page, the ListCtrl asks it’s parent (the Notebook object, which in turn asks its parent (the Frame object)) to perform the indicator checking. If any of the indicators trip then a status variable is flagged in the appropriate Alarm, ClockSyncIndicator, or StalenessIndicator object.
Within the ListCtrl ’s update() method we then check this status variable for each channel in an if/elif/else fashion and set the items background/foreground colour accordingly. This inherently provides us with the idea of indicator precedence without the actual HealthNotification derived classes knowing
18Usually done with double-buffering, though it did not help in this case as the numbers
contained within the cells usually change a fair amount between updates so the buffered image would be much different than the ’next-to-be’ displayed image.
their own level of precedence. The precedence, in order from highest to lowest is as follows:
Alarm → ClockSyncIndicator → StalenessIndicator → User Defined Colours → Default Colour
4.4
Shortcomings and Wish-list Changes
4.4.1 Saving and Loading
Partially due to the lack of experience in the implementation of GUI saving and load capability, a mistake, (or design flaw) is admitted. Currently the save/load functionality is contained within the Frame class, and in fact it is a large chunk of the Frame class. This save/load functionality should be removed from the Frame class and put into its own; I will fictitiously call them GUIStateSave and GUIStateLoad. I then imagine that other objects that contain information that would require saving/loading (eg. ListCtrl ) would extend these GUIState{Save|Load} classes and implement their own save() and load() methods. Then when a new configuration is loaded, each of these save() and load() methods would be iterated over and perform the appropriate action. Of course, there would have to be some form of known priority as some load events depend on other load events having already occurred (eg. you can’t load a Meter object without first loading the ListCtrl).
4.4.2 Saving of Page Locations
Without getting into much detail about wx, due to a limitation in wx-Python the LoadPerspective() and SavePerspective() methods of the AUI Notebook class have not been implemented, thus not allowing access to the page locations. Until this does get implemented in wxPython, there are two workarounds possible:
1. Implement the methods yourself, as wxPython is open source. Once done you could even submit the patch for review!
2. Create similar methods in python within Digital Meter by recording mouse movements and clicks. There are events being sent from the AUI Notebook that would tell us when a page is being dragged, so we
would be able to use these to know when to poll information from the mouse. This is of course a less-than-ideal way to do it.
5
Conclusions
There are a large number of features built into Digital Meter. These features ultimately make Digital Meter more powerful and useful than previously available tools. Providing users with the ability to recognize errors early during the data acquisition stage of a test rather than the data analysis stage can greatly increase efficiently if a failure of a sensor did occur.
The GUI to Digital Meter has also been developed with users in mind, as it is useless to create a tool which is hard to use. Changing the way the GUI interacted with the user was an on-going process during development, always trying to achieve the maximum amount of usability for each feature. In doing so, Digital Meter has encompassed a large feature set that can be accessed very easily and with a minimal learning curve.
From an internal view-point, Digital Meter has made use of common soft-ware engineering design principles and patterns where appropriate, making it a very extensible application.
6
Recommendations
While Digital Meter was designed to follow common software engineering practices, there are some areas in which good design is lacking. If further development were to occur then some of the pre-existing areas that should be considered to re-design include:
• Saving and Loading of GUI Configurations - This is currently encapsu-lated within the Frame class, it should be delegated to it’s own set of classes allowing other objects to extend save() and load() methods. • Screen Flickering - During a heavy load, Digital Meter displays some
flickering during the update() method of each ListCtrl object. This has been alleviated, but still exists.
Aside from this, already there are some features requests from users that should be candidates for implementation:
• Ability to tare channels - Each channel has a tare value associated with it, which defaults to 0, and which is added to the Value column and displayed in a Tared column. The user has the ability to enter the tared value for each channel. Also, the user has the option of capturing a snapshot of the mean, and using it as the tare value, instead of entering it.
References
[1] Performance Python. Retrieved April 2 2008, from
http://scipy.org/PerformancePython
[2] SWEET Wiki. Retrieved April 16 2008, from
http://sweet.iit.nrc.ca/sweet/
[3] Network Time Protocol. Retrieved April 2 2008, from
http://www.ntp.org/
[4] Dean Helman (1998) Model-View-Controller. Retrieved April 3 2008, from http://ootips.org/mvc-pattern.html
A
List of Acronyms
DAS - Data Acquisition Server DMC - Digital Meter Configuration GUI - Graphical User Interface MVC - Model/View/Controller NTP - Network Time Protocol
B
UML: Primary Classes
The following is a class level UML diagram of the primary classes within Digital Meter. Functions and attributes have only been shown if they are important to understanding the logics behind the design.
Figure 8: Primary class UML diagram, with function parameter and return types removed.
C
Presentation
The following images are exported copies of the slides from the presentation that I gave regarding Digital Meter on April 16th 2008.
Figure 10: Slide 2 of 11
Figure 12: Slide 4 of 11
Figure 14: Slide 6 of 11
Figure 16: Slide 8 of 11
Figure 18: Slide 10 of 11