BESDUI: A Benchmark for
End-User Structured Data End-User Interfaces
The MIT Faculty has made this article openly available.
Please share
how this access benefits you. Your story matters.
Citation
García, Roberto, Rosa Gil, Juan Manuel Gimeno, Eirik Bakke, and
David R. Karger. “BESDUI: A Benchmark for End-User Structured
Data User Interfaces.” The Semantic Web – ISWC 2016 (2016): 65–
79.
As Published
http://dx.doi.org/10.1007/978-3-319-46547-0_8
Publisher
Springer-Verlag
Version
Author's final manuscript
Citable link
http://hdl.handle.net/1721.1/115065
Terms of Use
Creative Commons Attribution-Noncommercial-Share Alike
See discussions, stats, and author profiles for this publication at: https://www.researchgate.net/publication/313066222
BESDUI: A Benchmark for End-User Structured
Data User Interfaces
Chapter in Lecture Notes in Computer Science · October 2016 DOI: 10.1007/978-3-319-46547-0_8 CITATIONS0
READS21
5 authors, including: Some of the authors of this publication are also working on these related projects: InVID – In Video Veritas!View project SIEUFERD
View project Roberto García Universitat de Lleida 89 PUBLICATIONS 934 CITATIONS SEE PROFILE Rosa Maria Gil Universitat de Lleida 108 PUBLICATIONS 491 CITATIONS SEE PROFILE Juan Manuel Gimeno Universitat de Lleida 46 PUBLICATIONS 103 CITATIONS SEE PROFILE David Ron Karger Massachusetts Institute of Technology 407 PUBLICATIONS 49,255 CITATIONS SEE PROFILE
All content following this page was uploaded by Roberto García on 31 January 2017.
BESDUI: A Benchmark for End-User
Structured Data User Interfaces
Roberto García1, Rosa Gil1, Juan Manuel Gimeno1,Eirik Bakke2, and David R. Karger2
1 Computer Science and Engineering Department, Universitat de Lleida,
Jaume II 69, 25001 Lleida, Spain
2 Computer Science and Artificial Intelligence Laboratory, MIT,
32 Vassar St., Cambridge, MA
{rgarcia,rgil,jmgimeno}@diei.udl.cat {ebakke,karger}@mit.edu
Resource type: Benchmark
Permanent URL: http://w3id.org/BESDUI
Abstract: The Semantic Web Community has invested significant research ef-forts in developing systems for Semantic Web search and exploration. But while it has been easy to assess the systems' computational efficiency, it has been much harder to assess how well different semantic systems’ user interfac-es help their users. In this article, we propose and demonstrate the use of a benchmark for evaluating such user interfaces, similar to the TREC benchmark for evaluating traditional search engines. Our benchmark includes a set of typi-cal user tasks and a well-defined procedure for assigning a measure of perfor-mance on those tasks to a semantic system. We demonstrate its application to two such system, Virtuoso and Rhizomer. We intend for this work to initiate a community conversation that will lead to a generally accepted framework for comparing systems and for measuring, and thus encouraging, progress towards better semantic search and exploration tools.
Keywords: benchmark, user experience, usability, semantic data, exploration, relational data.
1
Introduction
One of the main barriers alleged when justifying the lack of the uptake of the Seman-tic Web is that it has not reached end-users [1]. The amount of semanSeman-tic data is grow-ing, through open data initiatives like the Linked Open Data Cloud [2] or motivated by SEO benefits like those provided by major search engines for web pages annotated using schema.org [3]. However, this has not noticeably impacted user applications, for instance by the long sought Killer App for the Semantic Web [4].
It might be argued that this is in fact the desired outcome, that client applications should hide the complexities of semantic technologies and that the benefits should just be evident server side. For instance, search engines like Google provide better
results thanks to semantic annotations that users never see. This, in fact, should usual-ly be the desired outcome when trying to satisfy specific user needs: the user should be provided the simplest user experience possible [5].
For known tasks, such as managing a music collection or an address book, the sim-plest possible experience is often provided by a specific application with a task-specific interface. In this case, any Semantic Web nature of the underlying data will be hidden behind the familiar interface. But there will be other cases where no famil-iar application exists to camouflage the underlying semantic web data. A user may need to explore a data collection that is too rarely used to have motivated an applica-tion---perhaps because they are the only ones managing data in that particular schema. Or they may be seeking to learn something by combining multiple data collections that are not often combined.
A general example of this is semantic search, where a user is presented with some arbitrary semantic web data and seeks to find resources that fit some query. Semantic search tools that must work with arbitrary schema cannot hard-code any particular schema into their interfaces. For this task, tech-savvy users can rely on standards like SPARQL to query available data. But this is beyond the capabilities of most users. And even SPARQL-aware developers have trouble querying unfamiliar data collec-tions because it is hard to get a clear idea about what is available from a semantic dataset [6]. Consequently, we focus on more user-friendly visual query tools.
All kinds of users can benefit from tools that make it possible to visually explore semantic data, showing all its richness while provided a smooth user experience. In this particular scenario we might find the Semantic Web killer app that makes all the power of Web-wide connected data available to common users, so they can discover unforeseen connections in it.
Proposals are very disparate [7], ranging from Linked Data browsers [8] to Con-trolled Natural Language query engines [9] or faceted browsers [10]. This makes them difficult to compare, especially from the user perspective, for instance what ways of exploring the data they provide and how efficient they are from a Quality in Use perspective [11, 12].
To enable comparing proposals in this domain, a reference framework for bench-marking is clearly required, as discussions in this research domain have already high-lighted [13]. Moreover, it has also been shown that benchmarks help organizing and strengthening research efforts in a particular research area [14]. An example is the Text REtrieval Conference (TREC) benchmarks [15] which have become the de facto standard for evaluating any text document retrieval system.
In the context of semantic data exploration there have been already some efforts in specific areas. These include the Intelligent Exploration of Semantic Data Challenge1
and the Biomedical Semantic Indexing and Question Answering one2. However, none
of them target the general user task of semantic data exploration, nor provide a com-plete benchmark that facilitates comparability and competition in this research topic.
1 IESD Challenge, https://iesd2015.wordpress.com/iesd-challenge-2015 2 BioASQ, http://www.bioasq.org
On the other hand, there are many benchmarks for performance evaluation from a system perspective, like the Berlin SPARQL Benchmark (BSBM) [16] to evaluate SPARQL query engines, but they do not take into account the end-user perspective.
In this paper, we present a benchmark for semantic data (graphical) user interfaces with a set of user tasks to be completed and metrics to measure the performance of the analyzed interfaces at different levels of granularity. We provide a benchmark not just for semantic-web data exploration, but for structured data more generally. This makes it possible to also compare tools available in more mature domains like rela-tional databases [17]. It is well known that semantic web data can be squeezed into a traditional relational (SQL) database, and vice versa. Since the GUI systems we con-sider are aimed at end users, they generally isolate the user from details of the under-lying storage mechanism or query engine. Thus, these interfaces can in theory oper-ate over either type of data (modulo some simple-matter-of-programming data trans-formations). We also hope to further motivate research in semantic data exploration that goes beyond what is possible with other less rich data models.
In Section 2, we present our approach to providing a benchmark for structured data exploration. Then, in Section 3, we present the benchmark, which is then put into practice with a couple of faceted browsers in Section 4. Finally, the conclusions are presented in Section 5 and future work in Section 6.
2
Approach
Defining a benchmark requires two main decisions. First, we need to choose the tasks that will be benchmarked. Second, we need to decide what to measure about the sys-tems as they are used for the chosen tasks. In both parts, our choices influence the fidelity of our benchmark. First, our chosen tasks should be representative of the tasks we expect users to perform. They should cover the common cases, and be nei-ther too hard nor too easy. Second, our performance metrics should provide some suggestion of what real users will experience using the system. At the same time they will be easier to adopt if at least some measurement can be done analytically, without actual expensive user studies. These two choices are the “axioms” of our benchmark system; they cannot be proven correct but must instead be justified by experience and argumentation. We will discuss both in detail in the following two sections. For tasks we begin with (then augment) the Berlin SPARQL Benchmark, a set of queries initially intended to serve as a benchmark of computational performance. Our per-formance measure consider basic user operations such as mouse movements and key-board clicks under the so-called Keystroke Level Model [18] of user interaction.
In choosing tasks, we want to avoid introducing bias from an a priori conception of the problem or experience developing our own tools. Consequently, we have looked outward to find sets of typical end-user tasks related to structured data exploration.
Although our main interest is semantic technologies, we prefer a benchmark that can also be applied to relational-database tools, so we can compare them with seman-tic tools and highlight pros and cons between them. As discussed in the introduction,
visual query tools will insulate the user from details of the underlying storage repre-sentation, meaning RDF or relational databases could equally be used as back-ends.
From existing benchmarks with user tasks a clear candidate emerged: the Berlin SPARQL Benchmark (BSBM). Although this benchmark is intended for measuring the computational performance of semantic and relational database query engines, it is based on a set of realistic queries inspired by common information needs in these domains. We can therefore leverage the same queries to measure the
user-interaction performance of visual query systems. Moreover, it is based on a synthetic
dataset and a tool that facilitates its generation for a given target size, facilitating thus the distribution of the benchmark. And the data can be generated as SQL or RDF.
All the user tasks are accompanied by both the SPARQL and SQL query to satisfy them. Though from the perspective of a user experience benchmark these queries are technological details that might not be relevant because users can satisfy the tasks by generating different queries, they might be helpful to verify the outcomes of users’ tasks and check they are actually getting the intended result.
Therefore, we adopted the proposed user tasks that motivate the actual SPARQL and SQL queries that conform the Berlin SPARQL Benchmark. The tasks are contex-tualized in an e-commerce scenario, where different vendors offer a set of products and different consumers have posted reviews about these products.
In fact, there are three different sets of tasks in the BSBM depending on task types. The BSBM Explore set of tasks are directly connected to the proposed benchmark aim. There is a second set of Business Intelligence tasks, which are too complex to be considered in the context of data exploration tasks for the moment. Finally, there are Update tasks, which in the future we hope to use to define a benchmark for users
edit-ing, rather than searching semantic data.
Consequently, the data exploration tasks in BSBM have been used as the starting point for the proposed structured data exploration benchmark from a user experience perspective. These are 12 tasks that illustrate the user experience of a user looking for a product. The tasks are presented in the following subsection.
Note that our goal is not to evaluate ecommerce tools specifically. The intended targets are search tools for arbitrary structured data, so cannot have any e-commerce features hard coded into them. Indeed, this domain is so common there are likely to be domain-specific interfaces for tasks in it. However, ecommerce provides a con-venient and intuitive domain in which to define queries we expect users to want to carry out. We are interested in general operations, such as combining two constraints, but for concreteness we provide tasks in our benchmark in e-commerce language.
Our benchmark does not aim to assess discoverability/learnability. We posit a user who is already familiar with the tool being evaluated who knows where to access available operations and how to invoke them. To conclude this section, and before starting to describe each task in detail, it is important to note that the SPARQL and SQL queries associated to each task are not included in this paper due to space con-straints but are available from the benchmark repository [19].
3
Structured Data Exploration Benchmark
The proposed benchmark currently consists of 12 end-user tasks to be completed with the evaluated tool, listed in Section 3.1. For each task we detail the information need and provide some context. Then, we give a sample query based on the sample dataset accompanying the benchmark together with the expected outcome.
The proposed benchmark also includes a set of metrics to measure the effective-ness and efficiency of the evaluated tool when performing each of the proposed tasks. These metrics yield numbers that can be used to compare the performance of struc-tured data exploration tools, as detailed in Section 3.2.
3.1 End-User Tasks
The following subsections describe each of the 12 end-user tasks. All but one of them are directly adopted from the Berlin SPARQL Benchmark (BSBM). One additional task, Task 2, has been added as a variation of Task 1 to cover a gap in the original benchmark (OR versus AND operations for combining subqueries.
Although the BSBM presents a particular e-commerce schema, we hold that a true semantic web query tool cannot make assumptions about the schema of the data it is to query. It should operate equally well on any data schema it encounters. A tool that hard-wires the BSBM schema into its interface will be useless on a different data set and thus is not a true semantic web tool. The BSBM instantiates one arbitrary schema to let us talk about our queries concretely, but the tool being analyzed should not be permitted advance knowledge of this particular instantiation.
Task 1. Find products for a given set of combined features
A consumer seeks a product that present a specific set of features. The corresponding information need for the benchmark dataset specifies a product type from the product hierarchy (one level above leaf level), two different product features that correspond to the chosen product type and that should be present simultaneously and a number between 1 and 500 for a numeric property. For instance:
“Look for products of type sheeny with product features stroboscopes AND
gadg-eteers, and a productPropertyNumeric1 greater than 450”.
For the previous query, and considering the sample BSBM 1000 Products dataset3,
the product labels the user should obtain are:
“auditoriums reducing pappies” and “driveled”.
Task 2. Find products for a given set of alternative features
A consumer is seeking a product with a general idea about some alternative features of what he wants. This task has been added beyond those provided by BSBM. It
makes Task 1 to less specific by considering feature alternatives; the user is interested in any product that presents at least one of them. This benchmarks how exploration tools lets users define OR operations. A sample query for this task might be:
“List products of type sheeny with product features stroboscopes OR gadgeteers, and a productPropertyNumeric1 greater than 450”.
For the previous query, and considering the sample dataset, the product labels the user should obtain if restricted to the first 5 ordered alphabetically are:
“aliter tiredest”, “auditoriums reducing pappies”, “boozed”, “byplay”, “closely jerries”.
Task 3. Retrieve basic information about a specific product for display purposes
The consumer wants to view basic information about a specific product. For instance:
“Get details about product boozed”.
From the entry page, and considering the synthetic dataset generated using the BSMB tool, the response should include the following properties for the selected product with their corresponding values, which are omitted due to space restrictions but avail-able from the benchmark repository4:
“label”, “comment”, “producer”, “productFeature”, “propertyTextual1”, “propertyTextual2”, “propertyTextual3”, “propertyNumeric1”, “propertyNumer-ic2”, “propertyTextual4”, “propertyTextual5”, “propertyNumeric4”.
Task 4. Find products having some specific features and not having one feature
After looking at information about some products, the consumer has a more specific idea what she wants, features the products should have and others that should not. The main feature of this task is the use of negation. A sample query for this task is:
“Look for products of type sheeny with product features stroboscopes but NOT
gadgeteers, and productPropertyNumeric1 value greater than 300 and productPropertyNumeric3 smaller than 400”.
For this query and the BSBM 1000 dataset, the the user should obtain:
“boozed”, “elatedly fidelis release” and “learnable onomatopoeically”.
Task 5. Find products matching two different sets of features
After looking at information about some products, the consumer has a more specific idea what he wants. Therefore, he asks for products matching either one set of fea-tures or another set. The complexity in this case is the union of the sets of products selected by two different patterns. For instance:
“Look for products of type sheeny with product features stroboscopes and
gadge-teers and a productPropertyNumeric1 value greater than 300 plus those of the
same product type with product features stroboscopes and rotifers and a
productPropertyNumeric2 greater than 400”.
For the previous query, and the sample dataset, the product labels the user should obtain if restricted to the first 5 ordered alphabetically are:
“auditoriums reducing pappies”, “boozed”, “driveled”, “elatedly fidelis re-lease”, “zellations”.
Task 6. Find product that are similar to a given product
The consumer has found a product that fulfills his requirements. She now wants to find products with similar features. The corresponding query starts from a product and looks for all other products with at least one common feature and a wider range of values for two of its numeric properties. For instance:
“Look for products similar to boozed, with at least one feature in common, and a
productPropertyNumeric1 value between 427 and 627 and a productProper-tyNumeric2 value between 595 and 895 (150 more or less than its value for
boozed, 745)”.
For the previous query, and considering the sample dataset, the product labels the user should obtain if restricted to the first 5 ordered alphabetically are:
“debouches orangs unethically”, “dirk professionalize”, “grappled”, “imposed”, “pepperiness gothically shiner”.
Task 7. Find products having a name that contains some text
The consumer remembers parts of a product name from former searches. She wants to find the product again by searching for the parts of the name that she remembers. The corresponding query is just one of the words from the list of words5 that were used during dataset generation by the BSBM Data Generator6. For instance:
“Search products whose name contains ales”.
For the previous query, and considering the sample dataset, the product labels the user should obtain if restricted to the first 5 ordered alphabetically are:
“cogitations centralest recasting”, “overapprehensively dales ventless”, “ski-dooed finales noisemaker” and “unwed convalescents”.
Task 8. Retrieve in-depth information about a specific product including offers and reviews
The consumer has found a product which fulfills his requirements. Now he wants in-depth information about this product including offers from German vendors and product reviews if existent. The corresponding query refers to a selected product and
5 https://github.com/rhizomik/BESDUI/blob/master/Datasets/titlewords.txt 6
defines a current date within the "valid from" and "valid to" range of the offers. Com-pared to previous tasks, this one introduces being able to pose restrictions to different model entities that are interrelated, in this case vendors and reviews that are interre-lated with products and offers. For instance:
“For the product waterskiing sharpness horseshoes list details for all its offers by German vendors and still valid by 2008-05-28 plus details for all reviews for this product, including values for rating1 and rating2 if available”.
Considering the benchmark sample dataset, the user should get access to the details about the following offers and reviews:
“Offer10801”, “Offer5335”, “Offer10597”, “Review5481”, “Review7546”, “Review2669”, “Review5731”, “Review8494”.
Task 9. Give me recent reviews in English for a specific product
The consumer wants to read the 20 most recent English language reviews about a specific product. The corresponding query refers to a selected product. This task re-quired being able to filter literals language and ordering by date. For instance:
“For the product waterskiing sharpness horseshoes list the 20 more recent re-views in English”.
Given the sample dataset, the user should obtain the details for the following reviews in the order they are listed:
“Review5481”, “Review8494” and “Review2669”.
Task 10. Get Information about a reviewer
In order to decide whether to trust a review, the consumer asks for any kind of infor-mation that is available about the reviewer. The corresponding query refers to a se-lected product. This tasks explore how easy it is to reach the information about a re-source from a related one. For instance:
“Get all available information about Reviewer11”.
For the sample dataset, the user obtains all the details about the following reviewer:
“Reviewer1”.
Task 11. Get offers for a given product which fulfill specific requirements
The consumer wants to buy from a vendor in the United States that is able to deliver within 3 days and is looking for the cheapest offer that fulfills these requirements. The corresponding query refers to a selected product and defines a current date within the "valid from" and "valid to" range of the offers. For instance:
“Look for the cheapest and still valid by 2008-06-01 offer for the product
water-skiing sharpness horseshoes by a US vendor that is able to deliver within 3
Considering the sample dataset, the user interface should get as a response the follow-ing offers:
“Offer3499", "Offer11865" and "Offer15103”.
Task 12. Export the chosen offer into another information system which uses a different schema
After deciding on a specific offer, the consumer wants to save information about this offer on his local machine using a different schema. The corresponding query refers to a selected offer, or the one considered by the previous task.
“Save in the local computer the information about the vendor for Offer3499, this is half the task. To complete it, restrict the output to just label, homepage and country and map them to schema.org terms: name, url and nationality”.
3.2 Metrics
Our benchmark gives a number of generic yet typical information-seeking tasks to be measured. We now ask the following three increasingly detailed questions to measure the effectiveness and efficiency of the tool on these tasks:
1. Capability (effectiveness) Is performing the task possible with the given system? 2. Operation Count (efficiency) How many basic steps (mouse clicks, keyboard
en-try, scrolling) must be performed to carry out the given task?
3. Time (efficiency) How quickly can these steps be executed to carry out the task? Presumably, a system can be judged superior to another if it can be used to perform more of the tasks, with fewer basic steps that take less time. Our general target is graphical user interfaces for querying structured data. For contrast, if we consider for example a SPARQL command line, a suitably trained user would be able to perform all benchmark tasks with just a single primitive operation (typing the SPARQL query) in a very small amount of time (leaving out designing and debugging the SPARQL query). But most users don't have the training or understanding necessary to use such a tool. Instead, some type of GUI is the norm, and it is such systems we aim to evalu-ate.
The first two questions, of capability and operation count, can be answered entirely analytically. They simply require identifying and counting up a sequence of opera-tions that complete each task. Ideally, the third question would be answered by a timed user study. However, conducing user studies is a very time consuming activity, especially because it involves recruiting users. To facilitate the application of the benchmark, our proposed metric relies on past HCI research that offers a way to an-swer the time question analytically as well, by applying known, analytic timing mod-els for primitive actions (keyboard and mouse operations) in the identified sequence.
In particular, the Keystroke Level Model (KLM) [18] gave experimentally derived timings for basic operations such as typing a key, pointing on the screen with the mouse, moving hands back to the keyboard, and so forth. Given a sequence of these
basic operations, we can total up their timings to yield an overall predicted execution time for the task.
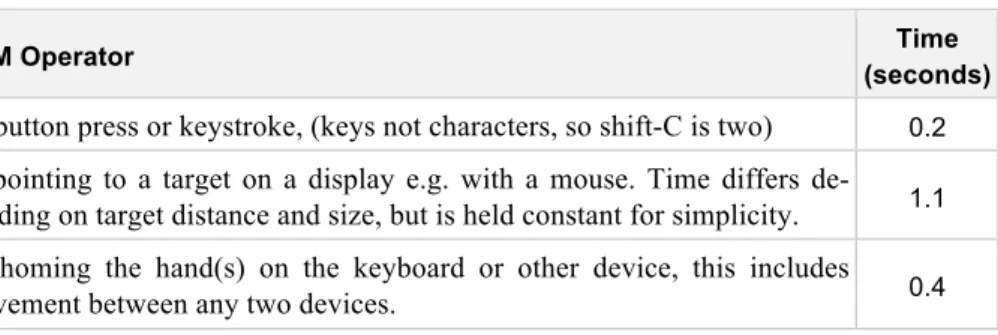
Our proposal is to use the main interaction operators proposed by KLM and their mapping to time to define the Operation Count and Time metrics. The first one does not distinguish among operations so it is computed as the sum of the counts of all operations. The considered operators and their mappings to time in seconds to com-pute the Time metric are shown in Table 1.
Table 1. Mapping from KLM Operators to time
KLM Operator Time
(seconds)
K: button press or keystroke, (keys not characters, so shift-C is two) 0.2
P: pointing to a target on a display e.g. with a mouse. Time differs
de-pending on target distance and size, but is held constant for simplicity. 1.1
H: homing the hand(s) on the keyboard or other device, this includes
movement between any two devices. 0.4
4
Benchmark evaluation with Rhizomer and Virtuoso
To facilitate the adoption of the benchmark, and to evaluate its applicability, we have tested it with two of the most sophisticated faceted browsers for semantic data, which also feature pivoting: Rhizomer [10] and Virtuoso Facets [20]. This way we provide a couple of samples that illustrate how the benchmark works. Due to space restrictions, we provide the results for the first 3 tasks.
Moreover, we have set a GitHub repository7 for the benchmark that can be forked
to contribute results for additional tools, which can be then incorporated into the ref-erence repository through a pull request. Additional details about how to contribute to the benchmark are available from the repository. The whole set of results for both Virtuoso and Rhizomer, and other tools, are available from the repository. For in-stance, the benchmark has been already applied to SIEUFERD [21], a query construc-tion tool through direct manipulaconstruc-tion of nested relaconstruc-tional results.
Task 1 Results
Rhizomer does not support this kind of query because when defining the values for a
particular facet, like stroboscopes and gadgeteers for feature, it is not possible to specify that both should be available for the same product simultaneously. The Capa-bility metric value is then 0%.
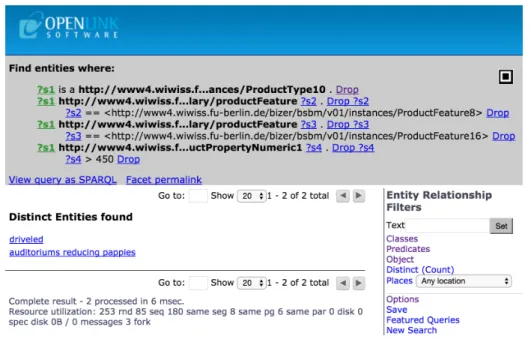
Virtuoso, as it is shown in Fig. 1, can complete this task and the outcome is the
ex-pected considering the sample dataset, the products “driveled” and “auditoriums
ducing pappies”. To complete this task, the interaction steps and KLM Operators are listed in Table 2, while the Operator Count and Time metrics are shown in Table 4.
Table 2. Interaction steps and corresponding KLM operators to complete Task 1 using Virtuoso
1. Type “sheeny” and “Enter”, then click “ProductType10”. 2. Click “Go” for “Start New Facet”, then click “Options”. 3. For “Interence Rule” Click and Select rules graph then “Apply”. 4. Click “Attributes”, then “productFeature” and “stroboscopes”. 5. Click “Attributes”, then “productFeature” and “gadgeteers”. 6. Click “Attributes” and “productPropertyNumeric1”. 7. Click “Add condition: None” and select “>”. 8. Type “450” and click “Set Condition”.
9K, 2P, 3H 2K, 2P 2K, 2P 3K, 3P 3K, 3P 2K, 2P 2K, 2P 5K, 2P, 2H Task 2 Results
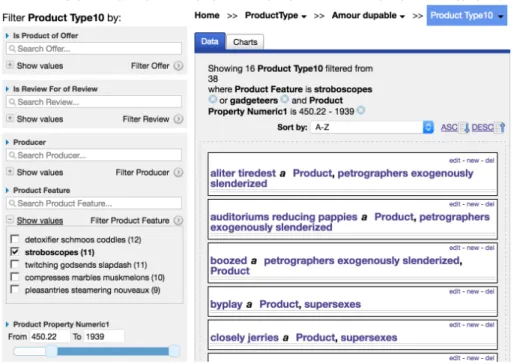
Rhizomer, as shown in Fig. 2, supports this task because its facets can be used to
select more than one of their values as alternatives. The interaction steps and KLM Operators are presented in Table 3 and the Operation Count and Time in Table 4.
Fig. 2. Using Rhizomer to complete Task 2.
Table 3. Interaction steps and KLM operators to complete Task 2 with Rhizomer
1. Click menu “ProductType” and then “Sheeny” submenu. 2. Click “Show values” for facet “Product Feature”. 3. Click facet value “stroboscopes”.
4. Type in input “Search Product Feature” “gad...” 5. Select “gadgeteers” from autocomplete
6. Set left side of “Product Property Numeric1”slider to “450”.
2K, 2P, 1H 1K, 1P 1K, 1P 4K, 1P, 1H 1K, 1P, 1H 1K, 2P
Virtuoso also supports this task in a very similar way to Task 1, though in this case
alternative feature values are defined using the “Add condition: IN” feature. The re-sults are available from Table 4.
Task 3 Results
Rhizomer supports this task. The user clicks the “Quick search…” input field and
types “boozed”, then selects the entry for the product from the autocomplete.
Virtuoso also supports this task. The user types “boozed” in the entry page search box
then clicks the entry for the requested product in the results listing to get the details.
The outcomes for the rest of the tasks cannot be included in this paper due to space restrictions but are available from the benchmark repository7. From the operation
count and their classification following the KLM model detailed in , it is possible to compute the numbers that measure their performance using the metrics presented in Section 3.2. These values constitute the benchmark evaluation results and are present-ed in Table 4.
Table 4. Summary of benchmark results for Rhizomer and Virtuoso for Tasks 1 to 3, more results available from the BESDUI Repository7
Rhizomer Virtuoso
Task Capacity Operation Count (seconds) Time Capacity Operation Count (seconds) Time
1 0% - - 100% (28K, 18P, 5H) 51 27.4
2 100% (10K, 8P, 3H) 21 12.0 100% (29K, 19P, 5H) 53 28.7
3 100% (8K, 2P, 3H) 13 5.0 100% (9K, 2P, 3H) 14 5.2
5
Conclusions
As already shown in other research domains, the existence of a benchmarks that facil-itate comparing contributions related to a specific research challenge helps foster efforts in that particular domain and clarify the scope of the contributions. In the do-main of semantic data exploration and search, there are many proposed tools and surveys but there is not a benchmark to compare them from a user experience per-spective.
Our proposal is based on a set of user tasks, most of them borrowed from the Ber-lin SPARQL Benchmark (BSBM), to be completed using the evaluated tools. Though this tasks are originally conceived to test SPARQL engines’ performance, they are very well contextualized in the e-commerce domain, cover a wide range of infor-mation needs and are accompanied by a synthetic dataset generator that facilitates the distribution of the benchmark and its deployment, even for very big testing datasets.
Though the dataset is synthetic and, for instance, many resources present funny names like “waterskiing sharpness horseshoes”, it is important to note that this does not introduce any significant effect from the user experience perspective when meas-ured using the KLM-based metric. Moreover, it is also important to note that, as test-ing with real users is very costly and time consumtest-ing, the benchmark is based on analytical methods and therefore require only the involvement of a researcher experi-enced in semantic data exploration tools.
The metrics are Capability, an effectiveness metric that measures if a task can be completed or not using an evaluated tool, Operation Count, an efficiency metric counting how many Keystroke Level Model Operators are required to complete the
task, and Time, another efficiency metric that translates the KLM Operators required to complete the task into an approximate amount of time.
Based on the 12 proposed tasks and the 3 metrics, the application of the benchmark consists of trying to complete each of the tasks using the evaluated tool. This can be done without having to recruit test users, an experienced user capable of using the tool is enough. The user record the interaction steps and then translates them to KLM Op-erators: K for keystrokes or button press, P for pointing to a target with the mouse and H for homing the hands on the keyboard or other device. The amount of operators of each kind should be counted to be able to compute the efficiency metrics. Operator Count is just the total amount of operators needed while Time is the conversion of the operators to a time measure, where K amounts 0.2 seconds, P 1.1 and H 0.4s.
The benchmark has been tested with two of the most sophisticate semantic data faceted browsers, Virtuoso Facets and Rhizomer. Just the results for the first three tasks including all the metrics are included in this paper, the rest are available from a GitHub repository intended for maintaining the benchmark, keeping track of evalua-tions and organizing contribuevalua-tions.
Another interesting effect of using BSBM is that it also provides the benchmark dataset in a format suitable for relational databases so it is possible to use the bench-mark to compare semantic-based and relational-based structured data exploration tools. These benchmark results are also available online7.
6
Future Work
The main objective of this contribution is to foster the formation of a community around the evaluation and comparison of tools for structured data exploration. Conse-quently, we have prepared a GitHub repository where all the required elements to conduct an evaluation are available. This includes a sample dataset, the descriptions of the tasks, reference SPARQL and SQL queries to test expected responses, descrip-tions of the metrics and templates to report results.
We plan to add contributing instructions based on common practice in GitHub that encourage forking the repository, making contributions like new evaluation results based on the templates and then doing a pull request to incorporate them in the refer-ence repository. We also expect contributions like additional tasks or metrics, which will be also considered for inclusion. We plan to trigger this community building process by proposing the benchmark as the way to evaluate submission to the IESD Workshop Challenge1, which some of the authors co-organize.
In addition to this expected community building efforts and results, our plans also include concrete tools to be evaluated, metrics and tasks to consider. First of all, we are currently exploring the tasks also proposed in the BSBM in the Business Intelli-gence scenario. Though these tasks are much more complex than the Explore tasks, some of them might be interesting to test with tools featuring visualizations.
We also plan to test many more tools using the benchmark, ranging from semantic data tools providing direct manipulation (SParallax, Explorator, Tabulator,…) to tools
that facilitate building queries interactively (YASGUI, iSPARQL, AutoSPARQL,…) or relational data exploration tools (Cipher, BrioQuery,…).
Our performance metrics currently emphasize low-level basic operations such as keystrokes and mouse clicks. These can be refined. For example, Fitts’s law has related the time to execute a mouse operation to the target regions size and from it’s the mouse starting point; this can be incorporated into our timing analysis. At a high-er level, our benchmark currently does not capture ushigh-er effort. An inthigh-erface that re-quires the user to think hard about which operation to perform next (and how to do it) will be more taxing and take more time. As discussed above, and extreme model of this is the SPARQL command line, which is extremely efficient in the KLM because all the work is mental, figuring out what SPARQL query to time. Similarly, our benchmark favors complicated UI layouts where all actions are “one click away”, neglecting the fact that Fitts’ Law indicates that actually selecting these actions be-comes slower. The KLM model does not capture this, but there are so-called GOMS [22] models that begin to.
To fully evaluate the usefulness of the proposed efficiency metrics, we will also test the systems using user experience evaluation techniques that involve end-users and include measuring the real time users need to complete the tasks.
References
1. Shadbolt, N., Hall, W., Berners-Lee, T.: The Semantic Web revisited. Intelligent Systems. 21, 96–101 (2006)
2. Cyganiak, R., Jentzsch, A.: The Linking Open Data cloud diagram, http://lod-cloud.net 3. Guha, R.: Introducing schema.org: Search engines come together for a richer web, 2011.
https://googleblog.blogspot.com.es/2011/06/introducing-schemaorg-search-engines.html 4. Alani, H., Kalfoglou, Y., O’Hara, K., Shadbolt, N.: Towards a Killer App for the Semantic
Web. In: Gil, Y., Motta, E., Benjamins, V.R., and Musen, M.A. (eds.) The Semantic Web - ISWC 2005. pp. 829–843. Springer Berlin Heidelberg (2005).
5. Krug, S., Black, R.: Don’t Make Me Think! A Common Sense Approach to Web Usabil-ity. New Riders Publishing, Indianapolis, IN (2000)
6. Freitas, A., Curry, E., Oliveira, J.G., O’Riain, S.: Querying Heterogeneous Datasets on the Linked Data Web: Challenges, Approaches, and Trends. IEEE Internet Computing. 16, 24–33 (2012)
7. Dadzie, A.-S., Rowe, M.: Approaches to visualising Linked Data: A survey. Semantic Web. 2, 89–124 (2011)
8. Berners-Lee, T., Chen, Y., Chilton, L., Connolly, D., Dhanaraj, R., Hollenbach, J., Lerer, A., Sheets, D.: Tabulator: Exploring and Analyzing Linked Data. In: Proc. of the 3rd Se-mantic Web and User Interaction Workshop (SWUI’06). Athens, Georgia (2006)
9. Kaufmann, E., Bernstein, A.: Evaluating the usability of natural language query languages and interfaces to Semantic Web knowledge bases. Web Semantics: Science, Services and Agents on the World Wide Web. 8, 377–393 (2010)
10. Brunetti, J.M., García, R., Auer, S.: From Overview to Facets and Pivoting for Interactive Exploration of Semantic Web Data. International Journal on Semantic Web and Infor-mation Systems. 9, 1–20 (2013)
11. Bevan, N.: Extending Quality in Use to Provide a Framework for Usability Measurement. In: Kurosu, M. (ed.) Human Centered Design. pp. 13–22. Springer Berlin (2009)
12. González-Sánchez, J.L., García, R., Brunetti, J.M., Gil, R., Gimeno, J.M.: Using SWET-QUM to Compare the Quality in Use of Semantic Web Exploration Tools. Journal of Uni-versal Computer Science. 19, 1025–1045 (2013)
13. García-Castro, R.: Benchmarking Semantic Web Technology. IOS Press (2009)
14. Sim, S.E., Easterbrook, S., Holt, R.C.: Using Benchmarking to Advance Research: A Challenge to Software Engineering. In: Proc. of the 25th International Conference on Software Engineering. pp. 74–83. IEEE Computer Society, Washington, DC, USA (2003) 15. Voorhees, E.M., Harman, D.K.: TREC: Experiment and Evaluation in Information
Re-trieval (Digital Libraries and Electronic Publishing). The MIT Press (2005)
16. Bizer, C., Schultz, A.: The Berlin SPARQL Benchmark. International Journal on Semantic Web and Information Systems (IJSWIS). 5, 1-24 (2009)
17. Catarci, T., Costabile, M.F., Levialdi, S., Batini, C.: Visual Query Systems for Databases: A Survey. Journal of Visual Languages & Computing. 8, 215–260 (1997)
18. Card, S.K., Moran, T.P., Newell, A.: The Keystroke-level Model for User Performance Time with Interactive Systems. Commun. ACM. 23, 396–410 (1980)
19. García, R., Gil, R., Gimeno, J.M., Bakke, E., Karger, D.R.: BESDUI: A Benchmark for End-User Structured Data User Interfaces , http://w3id.org/BESDUI
20. Erling, O., Mikhailov, I.: RDF Support in the Virtuoso DBMS. In: Pellegrini, T., Auer, S., Tochtermann, K., Schaffert, S. (eds.) Networked Knowledge - Networked Media. pp. 7– 24. Springer, Heidelberg, DE (2009)
21. Bakke, E., Karger, D.R.: Expressive query construction through direct manipulation of nested relational results. In Proc. of the 2016 International Conference on Management of Data (SIGMOD '16), pp. 1377–1392, ACM, New York, NY, USA (2016)
22. John, B.E., and Kieras, D.E.: The GOMS family of user interface analysis techniques: Comparison and contrast. ACM Transactions on Computer-Human Interaction. 3(4), 320-351 (1996)
View publication stats View publication stats